![TSI Divergence Indicator for MetaTrader4 Download - Free - [TF Lab]](https://cdn.tradingfinder.com/image/106271/10-6-en-tsi-divergence-mt4.webp)
![TSI Divergence Indicator for MetaTrader4 Download - Free - [TF Lab] 0](https://cdn.tradingfinder.com/image/106271/10-6-en-tsi-divergence-mt4.webp)
![TSI Divergence Indicator for MetaTrader4 Download - Free - [TF Lab] 1](https://cdn.tradingfinder.com/image/33722/10-06-en-tsi-divergence-mt4-02.avif)
![TSI Divergence Indicator for MetaTrader4 Download - Free - [TF Lab] 2](https://cdn.tradingfinder.com/image/33724/10-06-en-tsi-divergence-mt4-03.avif)
![TSI Divergence Indicator for MetaTrader4 Download - Free - [TF Lab] 3](https://cdn.tradingfinder.com/image/33727/10-06-en-tsi-divergence-mt4-04.avif)
On June 23, 2025, in version 2, alert/notification functionality was added to this indicator
The TSI Divergence indicator, an oscillator in MetaTrader 4 indicator, automatically detects divergences between highs and lows.
This indicator features a curve that issues a buy signal when below the zero line and divergence occurs, and a sell signal when above the zero line after a divergence.
Divergence is one of the best indicators for trend reversals and can confirm the correct detection of trend direction.
Indicator Table
Indicator Categories: | Oscillators MT4 Indicators Signal & Forecast MT4 Indicators Currency Strength MT4 Indicators |
Platforms: | MetaTrader 4 Indicators |
Trading Skills: | Elementary |
Indicator Types: | Trend MT4 Indicators Reversal MT4 Indicators Non-Repainting MT4 Indicators |
Timeframe: | Multi-Timeframe MT4 Indicators |
Trading Style: | Day Trading MT4 Indicators Intraday MT4 Indicators Scalper MT4 Indicators |
Trading Instruments: | Share Stocks MT4 Indicators Indices Market MT4 Indicators Commodity Market MT4 Indicators Stock Market MT4 Indicators Cryptocurrency MT4 Indicators Forex MT4 Indicators |
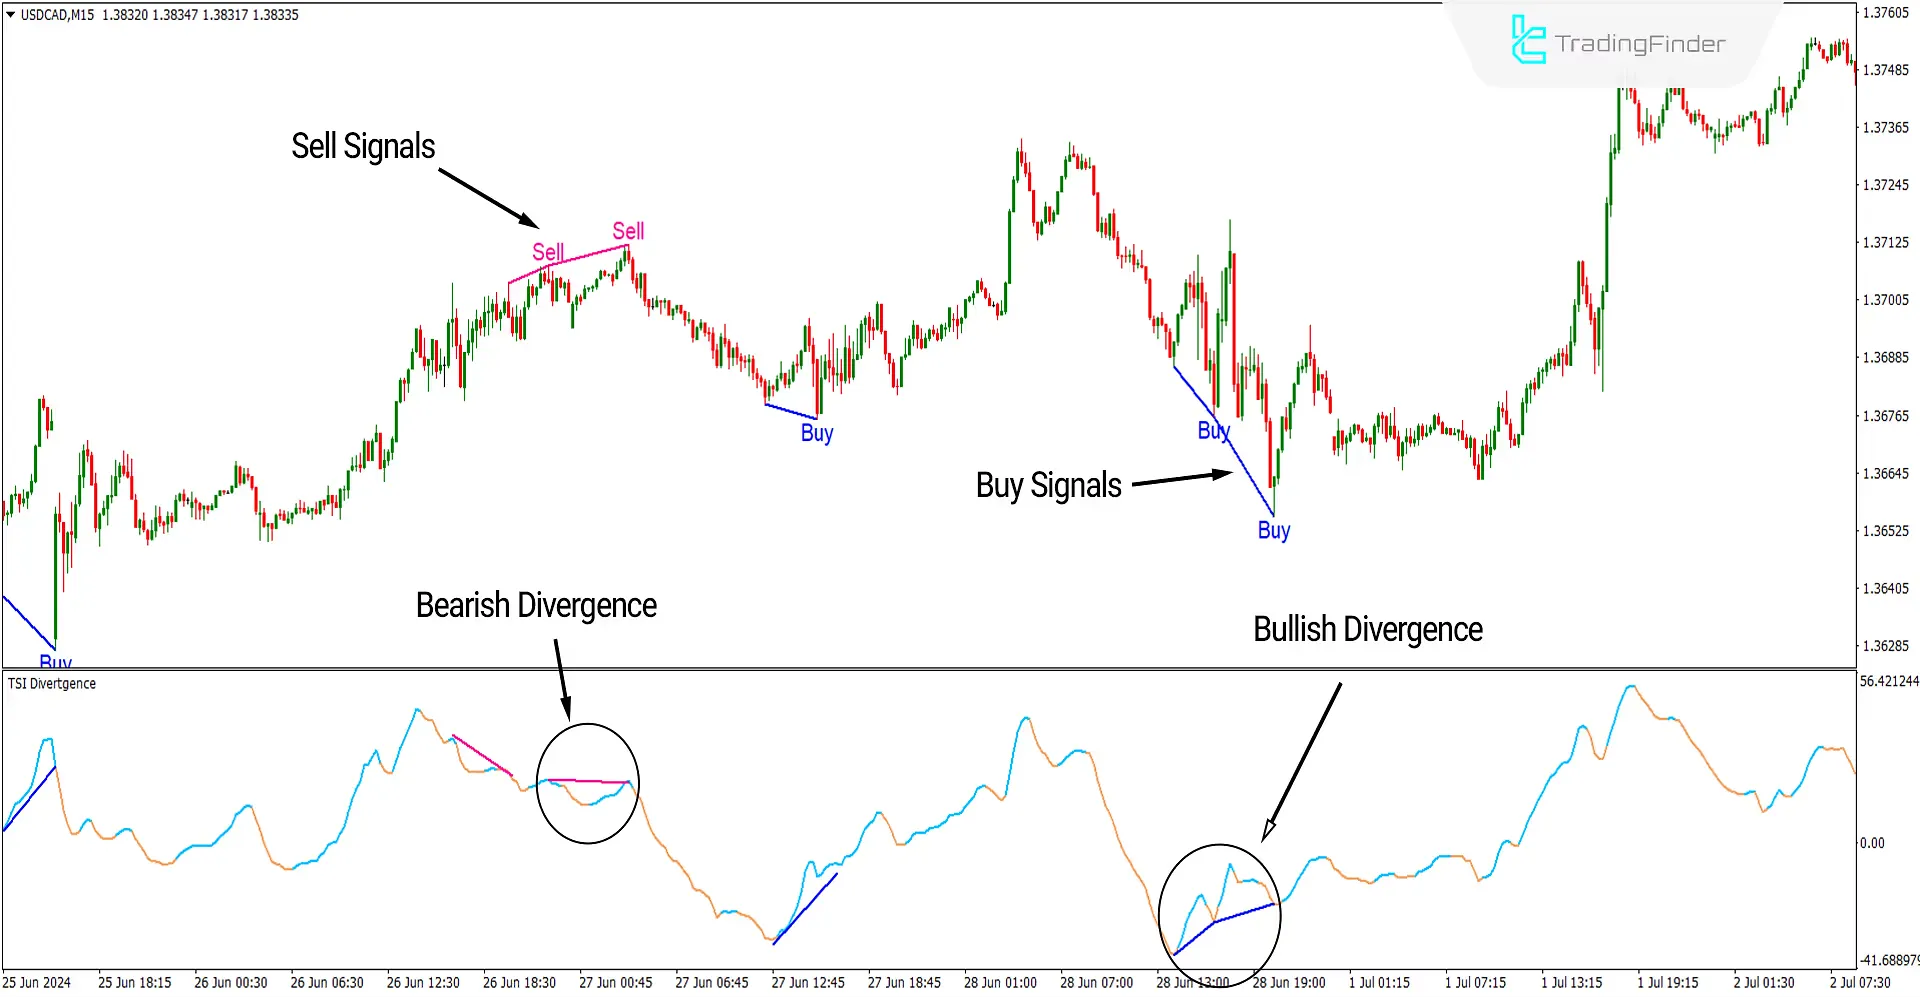
In the image below, the chart of the currency pair US Dollar to Canadian Dollar with the symbol [USDCAD] is shown on a 15-minute timeframe.
The points circled are where divergences have occurred on the price chart, indicating a weakening of the current trend and potential trend reversals.
The best way to obtain valid signals from the indicator is to combine them with support, resistance levels, and trend lines. By integrating these elements, optimal entries into trades can be achieved.

Overview
Divergences are reliable indicators of potential trend reversals. Combining them with classic support and resistance levels, supply and demand zones, trend lines, and channels can be highly effective.
This T4 signal and forecast indicator can automatically and swiftly detect divergences in the price chart, providing traders with timely insights to make informed decisions.
Uptrend Signals (Buy Signals)
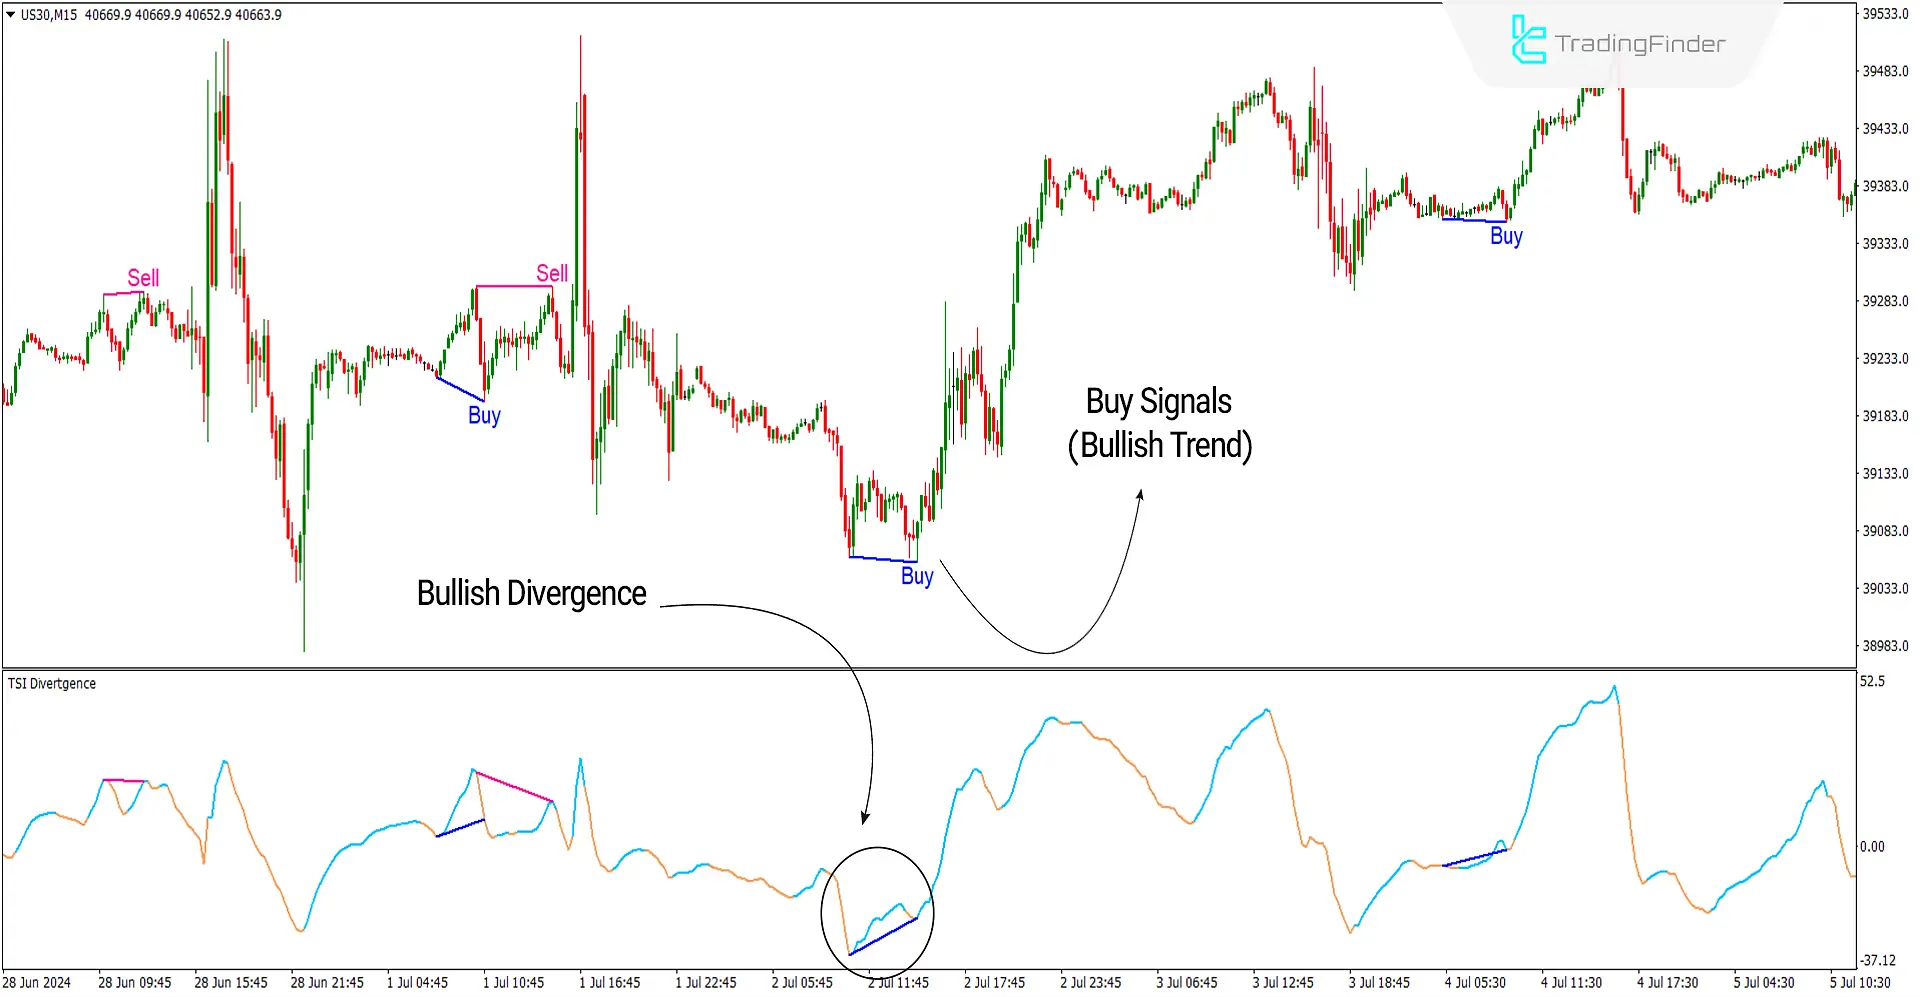
In the image below, the Dow Jones Index (US30) chart is shown on a 15-minute timeframe. After forming two swing lows at the end of a downtrend, the indicator has turned blue below the zero level, detecting a divergence between these two lows.
Under these circumstances, this indicates a weakening of the downtrend, and the indicator has issued a buy signal. Traders can consider entering a long (buy) position, considering other trading confirmations.

Downtrend Signals (Sell Signals)
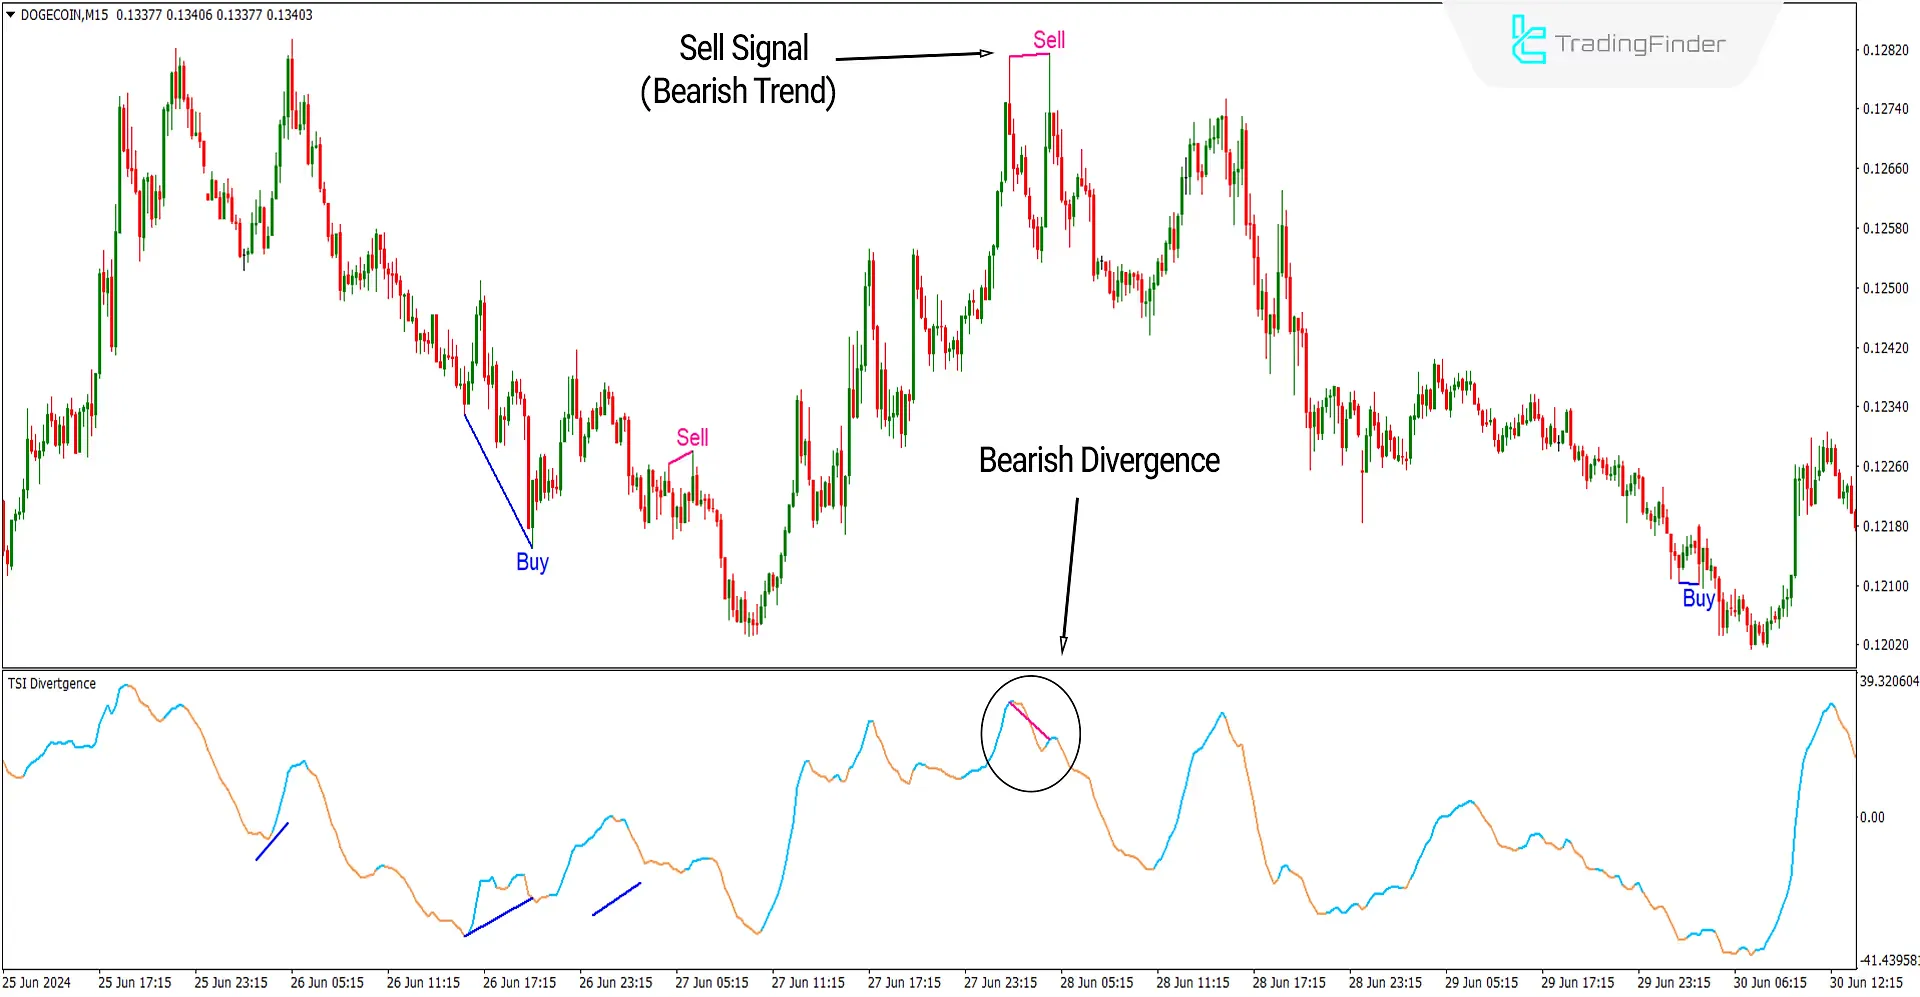
In the image below, the Dogecoin (DOGECOIN) chart is shown in a 15-minute timeframe. After forming two swing highs at the end of an uptrend, the indicator has turned orange above the zero level, detecting a divergence between these two highs at the end of the uptrend.
This indicates a weakening of the uptrend, and the indicator has issued a sell signal. Traders can consider entering a short (sell) position, considering other trading confirmations.

Settings of the TSI Divergence Indicator

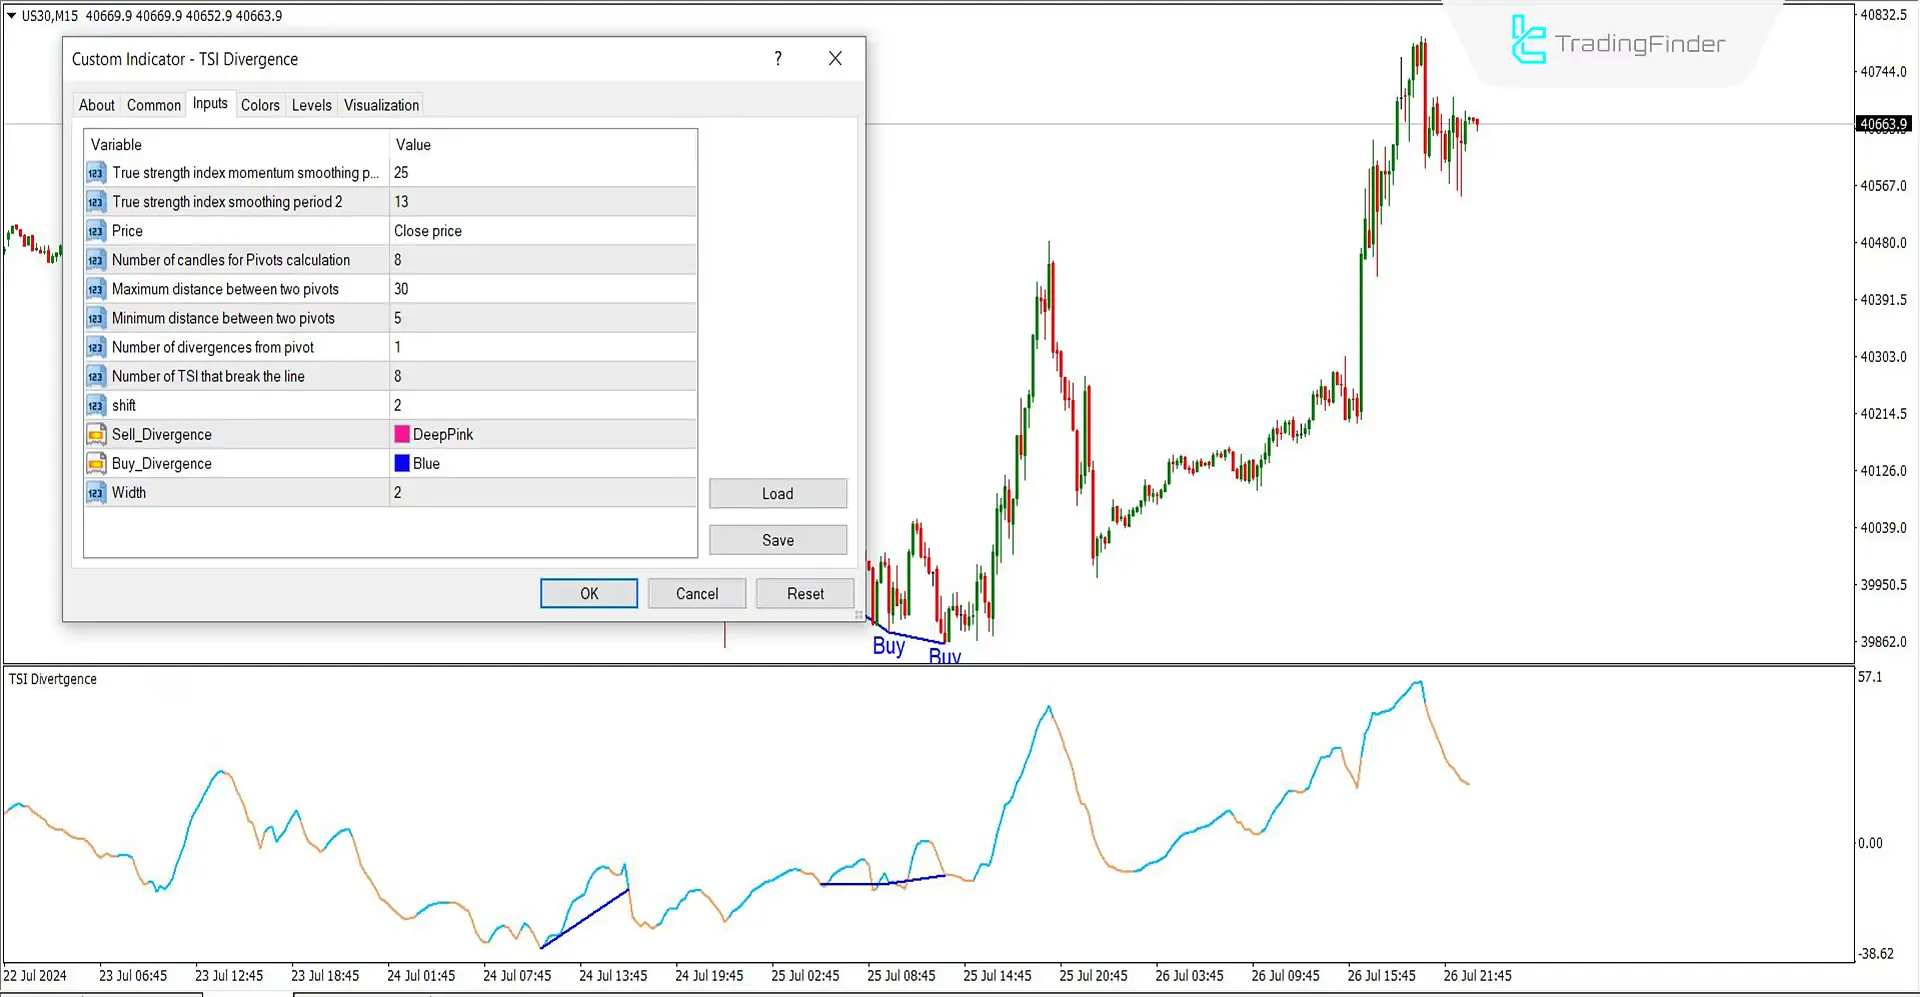
- True Strength Index Momentum Smoothing Period: Use a 25-period moving average to smooth the True Strength Index;
- True Strength Index Smoothing Period 2: Use a 13-period moving average for additional smoothing;
- Price: Base calculations on the Close Price;
- Number of Candles for Pivots Calculation: Set the number of candles used to calculate pivots at 8;
- Maximum Distance Between Two Pivots: The maximum distance between two pivots is 30;
- Minimum Distance Between Two Pivots: The minimum distance between two pivots is 5;
- Number of Divergences from Pivot: There is one divergence counted per pivot;
- Number of TSI that Break the Line: The TSI line break is identified as number 2;
- Shift: The shift is set to 2;
- Sell Divergence: The color for selling divergence signals is pink or any other color you choose;
- Buy Divergence: The color for buying divergence signals is blue or any other color you choose;
- Width: The width is set to 2.
Conclusion
The TSI Divergence indicator is suitable for trading across all time frames, but using it on 15-minute or longer time frames is recommended to minimize errors.
Additionally, more reliable signals can be obtained by integrating them with other classic and modern levels and appropriate tools.
As an experienced trader, you can incorporate divergences into your strategy to confirm trend directions, regardless of your trading strategy. This versatility makes the TSI Divergence indicator a valuable tool in diverse trading environments.
TSI Divergence MT4 PDF
TSI Divergence MT4 PDF
Click to download TSI Divergence MT4 PDFDo the signals from the TSI Divergence indicator align with any strategy?
Divergences can be utilized alongside most trading strategies to enhance their effectiveness
When is the TSI Divergence indicator signal activated?
The indicator's signals are activated when divergences occur at the end of weakening trends, highlighting potential reversal points.
perfect indicator from tf lab


