![TSI MACD indicator for MetaTrader 4 Download - Free - [TradingFinder]](https://cdn.tradingfinder.com/image/138080/13-41-en-tsi-macd-mt4-1.webp)
![TSI MACD indicator for MetaTrader 4 Download - Free - [TradingFinder] 0](https://cdn.tradingfinder.com/image/138080/13-41-en-tsi-macd-mt4-1.webp)
![TSI MACD indicator for MetaTrader 4 Download - Free - [TradingFinder] 1](https://cdn.tradingfinder.com/image/138079/13-41-en-tsi-macd-mt4-2.webp)
![TSI MACD indicator for MetaTrader 4 Download - Free - [TradingFinder] 2](https://cdn.tradingfinder.com/image/138077/13-41-en-tsi-macd-mt4-3.webp)
![TSI MACD indicator for MetaTrader 4 Download - Free - [TradingFinder] 3](https://cdn.tradingfinder.com/image/138076/13-41-en-tsi-macd-mt4-4.webp)
The True Strength Index MACD (TSI MACD) is an advanced hybrid tool for identifying market depth in MetaTrader 4.
This volatility indicator is developed by combining two popular tools, MACD and TSI, providing a more accurate assessment of trend strength and direction.
The TSI MACD indicator, based on the primary features of both tools and aided by a moving average line and a signal line, allows traders to assess the trend's strength.
Indicator Specifications Table
Indicator Categories: | Oscillators MT4 Indicators Volatility MT4 Indicators Currency Strength MT4 Indicators MACD Indicators for MetaTrader 4 |
Platforms: | MetaTrader 4 Indicators |
Trading Skills: | Intermediate |
Indicator Types: | Reversal MT4 Indicators |
Timeframe: | Multi-Timeframe MT4 Indicators |
Trading Style: | Intraday MT4 Indicators |
Trading Instruments: | Share Stocks MT4 Indicators Indices Market MT4 Indicators Commodity Market MT4 Indicators Stock Market MT4 Indicators Cryptocurrency MT4 Indicators Forex MT4 Indicators |
Overview of the TSI MACD Indicator
The MACD indicator is a well-known tool for identifying moving average convergence and divergence; the TSI indicator also serves as a momentum index, showing the intensity and strength of price movements. Combining these two powerful tools provides traders with both elements.
Conditions for Uptrend
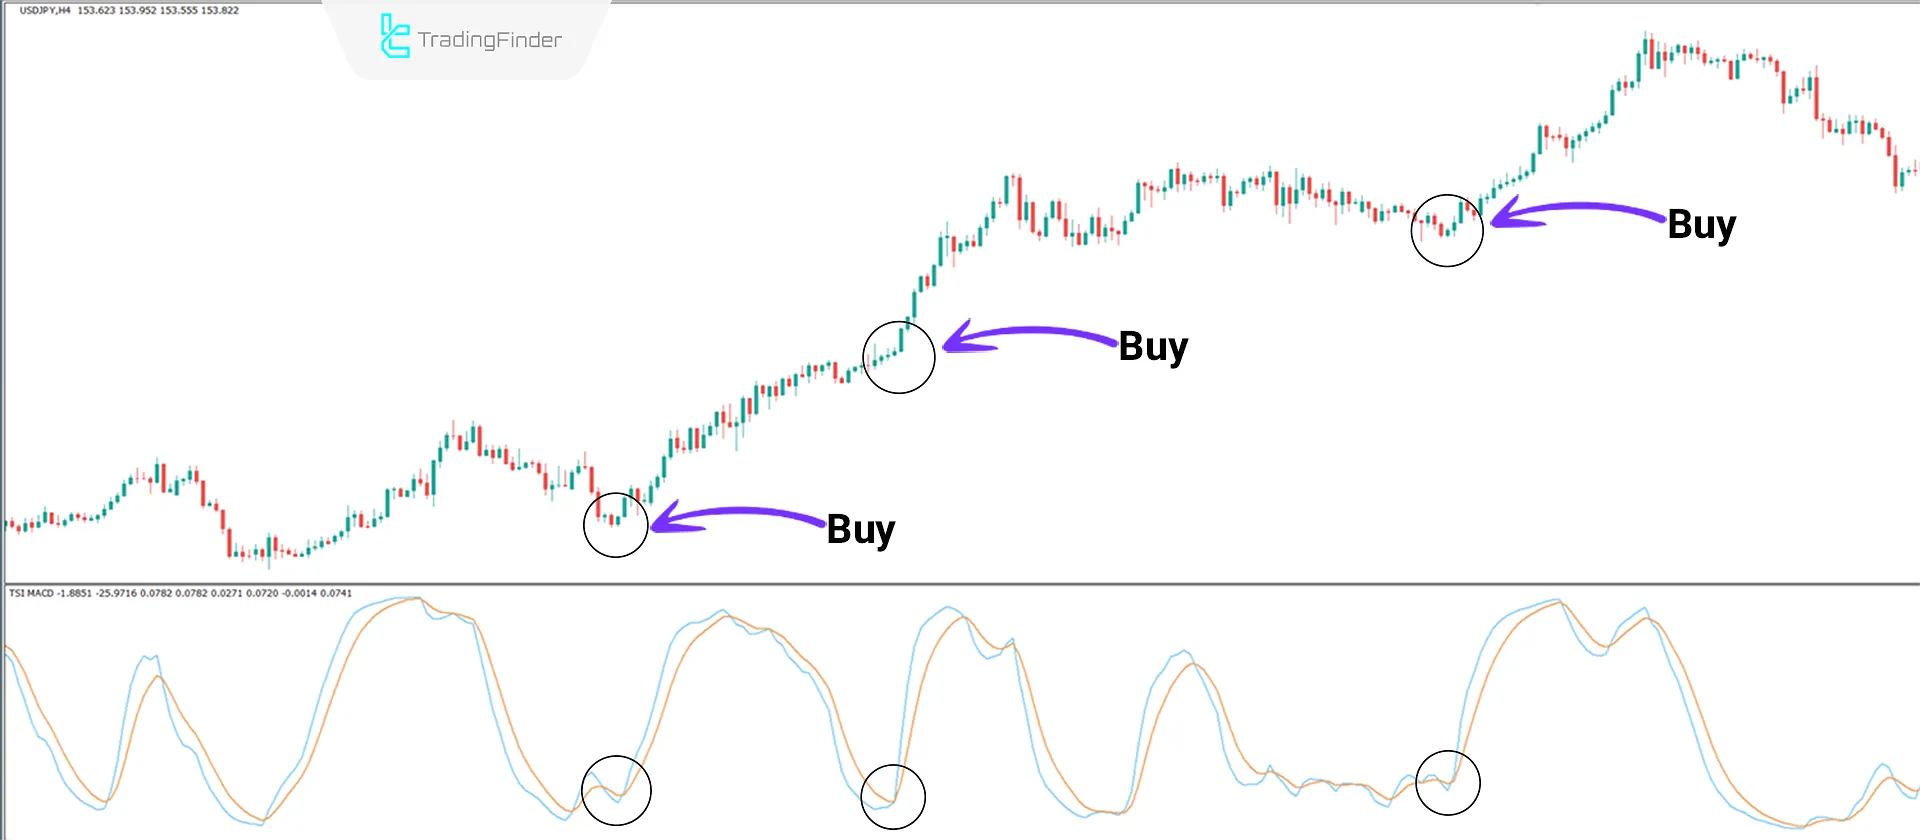
The price chart of the USD/JPY currency pair in the 4-hour timeframe demonstrates how to operate and enter a buy position (Entry).
According to the image, the price trend becomes bullish whenever the blue line crosses the signal line (orange line) upwards and oscillates in the positive phase.
These two lines' intersection points can be considered an entry signal.

Conditions for Downtrend
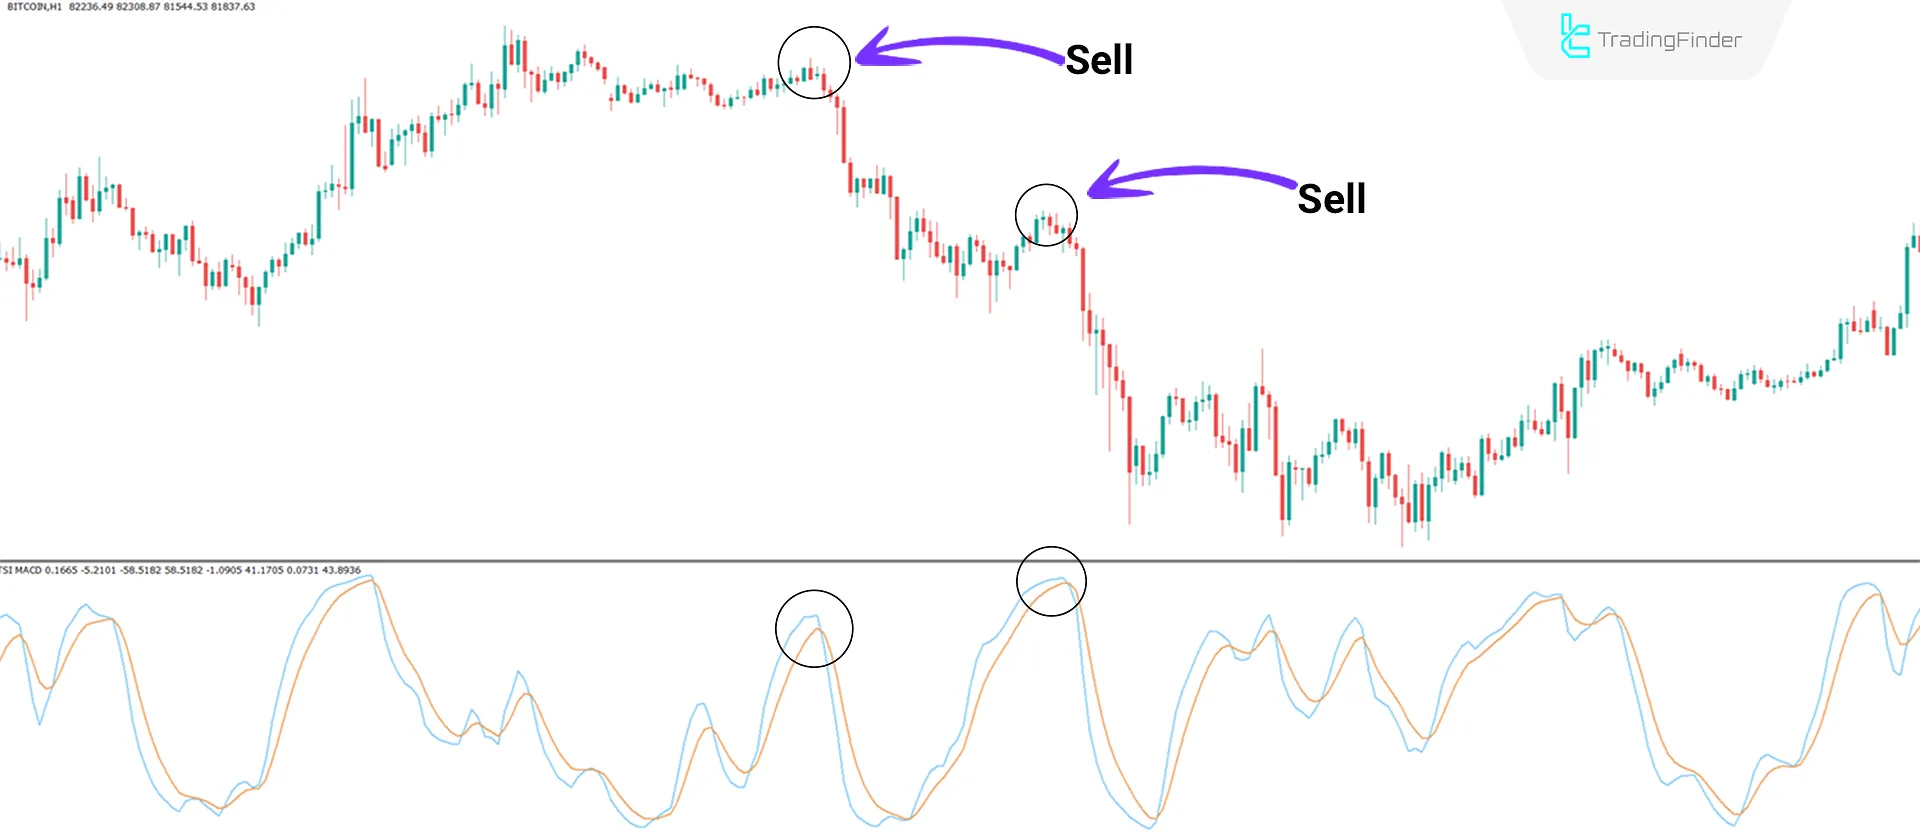
The price chart of Bitcoin (BTC) in the 1-hour timeframe demonstrates how to operate and enter a sell position (Entry).
According to the image, the price trend becomes bearish whenever the blue line crosses the signal line (orange line) downwards and oscillates in the negative phase.
These two lines' intersection points can be considered an entry signal.

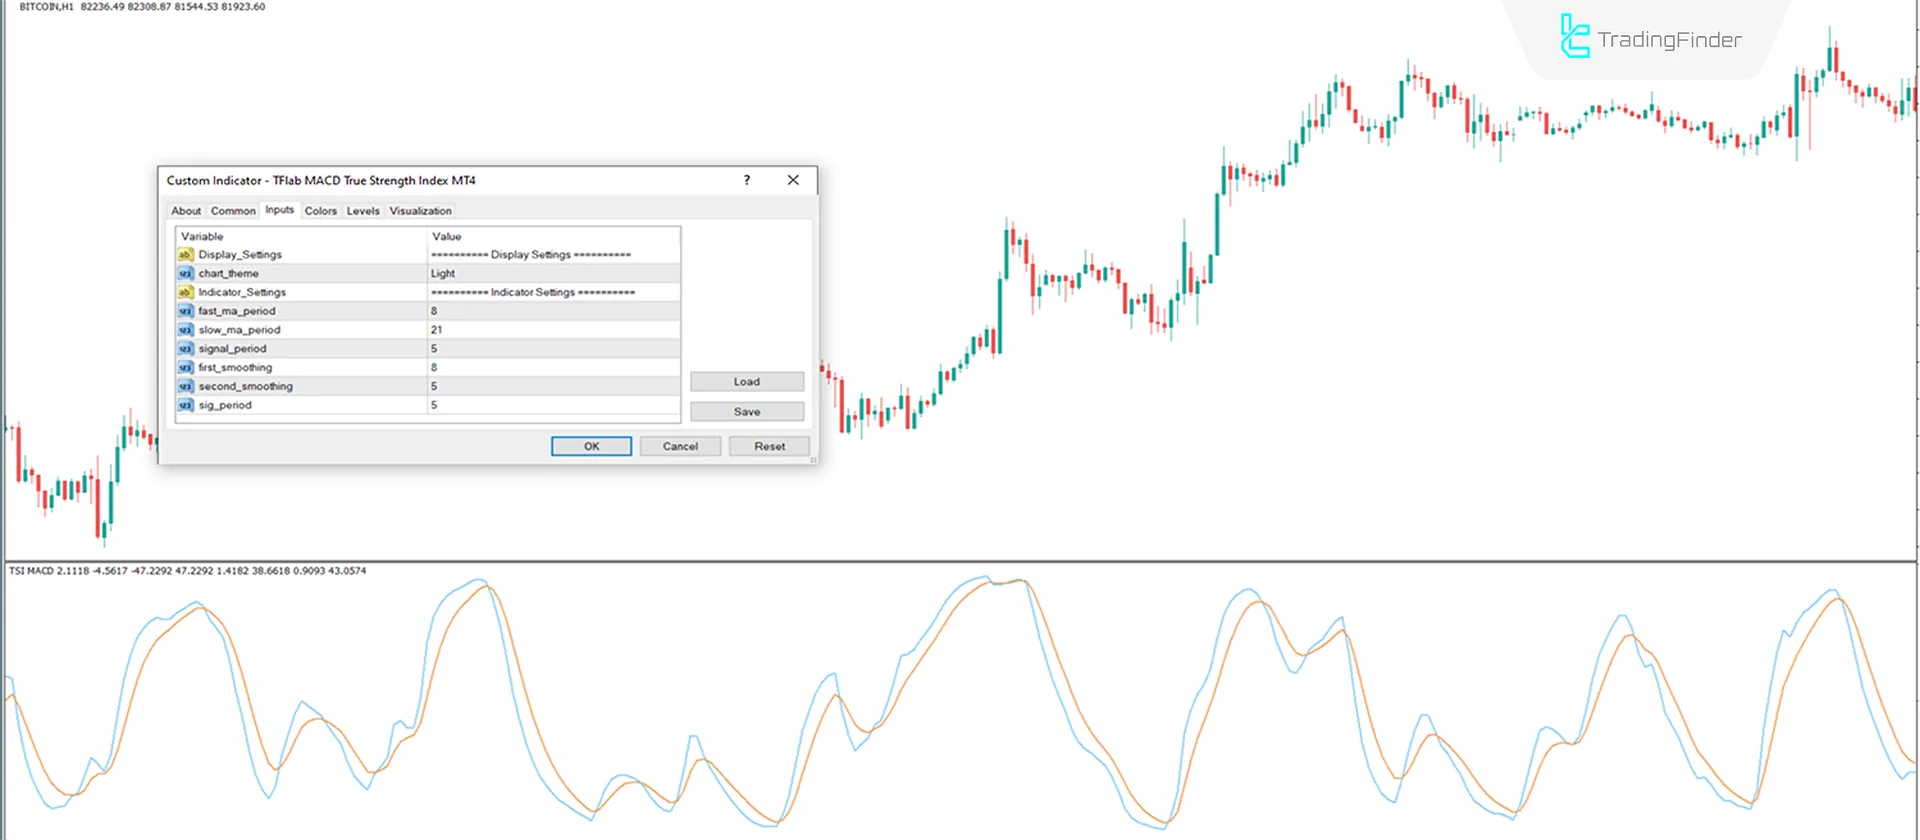
Indicator Settings

- Chart Theme: Indicator theme;
- Fast MA Period: Fast moving average period calculated as 8;
- Slow MA Period: Slow moving average period calculated as 21;
- Signal Period: Signal period set to 5;
- First Smoothing: Initial smoothing parameter set to 8;
- Second Smoothing: Secondary smoothing parameter set to 5;
- Sig Period: Signal line period set to 5.
Conclusion
The TSI MACD indicator combines the features of both tools, providing more precise signals for potential price changes and effectively analyzing price movements and momentum.
This MT4 oscillator is useful for day traders and those seeking short term fluctuations and serves as a reliable index alongside personal analysis.
TSI MACD indicator MT4 PDF
TSI MACD indicator MT4 PDF
Click to download TSI MACD indicator MT4 PDFDoes this indicator issue entry signals for trades?
This indicator does not directly issue entry signals; however, line intersections in the oscillator can be considered signals.
What is the difference between this tool and the traditional "MACD" indicator?
The difference lies in integrating the TSI indicator with the traditional MACD.


