![VH Indicator for MetaTrader 4 Download - Free - [TradingFinder]](https://cdn.tradingfinder.com/image/287411/11-69-en-vh-mt4-01.webp)
![VH Indicator for MetaTrader 4 Download - Free - [TradingFinder] 0](https://cdn.tradingfinder.com/image/287411/11-69-en-vh-mt4-01.webp)
![VH Indicator for MetaTrader 4 Download - Free - [TradingFinder] 1](https://cdn.tradingfinder.com/image/287397/11-69-en-vh-mt4-02.webp)
![VH Indicator for MetaTrader 4 Download - Free - [TradingFinder] 2](https://cdn.tradingfinder.com/image/287404/11-69-en-vh-mt4-03.webp)
![VH Indicator for MetaTrader 4 Download - Free - [TradingFinder] 3](https://cdn.tradingfinder.com/image/287396/11-69-en-vh-mt4-04.webp)
The VH Indicator is one of the MetaTrader 4 indicators that identifies bullish and bearish market trends using the crossover of two moving averages. This indicator displays bullish trends in blue and bearish trends in red.
Traders can use the trend changes displayed by this indicator as entry signals to enter buy or sell positions at appropriate points.
VH Indicator Table
The table below outlines the general specifications of the VH Indicator.
Indicator Categories: | Support & Resistance MT4 Indicators Signal & Forecast MT4 Indicators Trading Assist MT4 Indicators |
Platforms: | MetaTrader 4 Indicators |
Trading Skills: | Intermediate |
Indicator Types: | Entry and Exit MT4 Indicators Lagging MT4 Indicators |
Timeframe: | Multi-Timeframe MT4 Indicators |
Trading Style: | Day Trading MT4 Indicators Intraday MT4 Indicators Scalper MT4 Indicators |
Trading Instruments: | Indices Market MT4 Indicators Stock Market MT4 Indicators Forex MT4 Indicators |
Indicator at a Glance
The VH Indicator is a useful tool for traders looking to identify market trends. This indicator uses the crossover of two moving averages to detect bullish and bearish trends.
In the indicator settings, traders can adjust the periods of the fast and slow moving averages, allowing them to customize it according to their trading strategy.
Bullish Trend
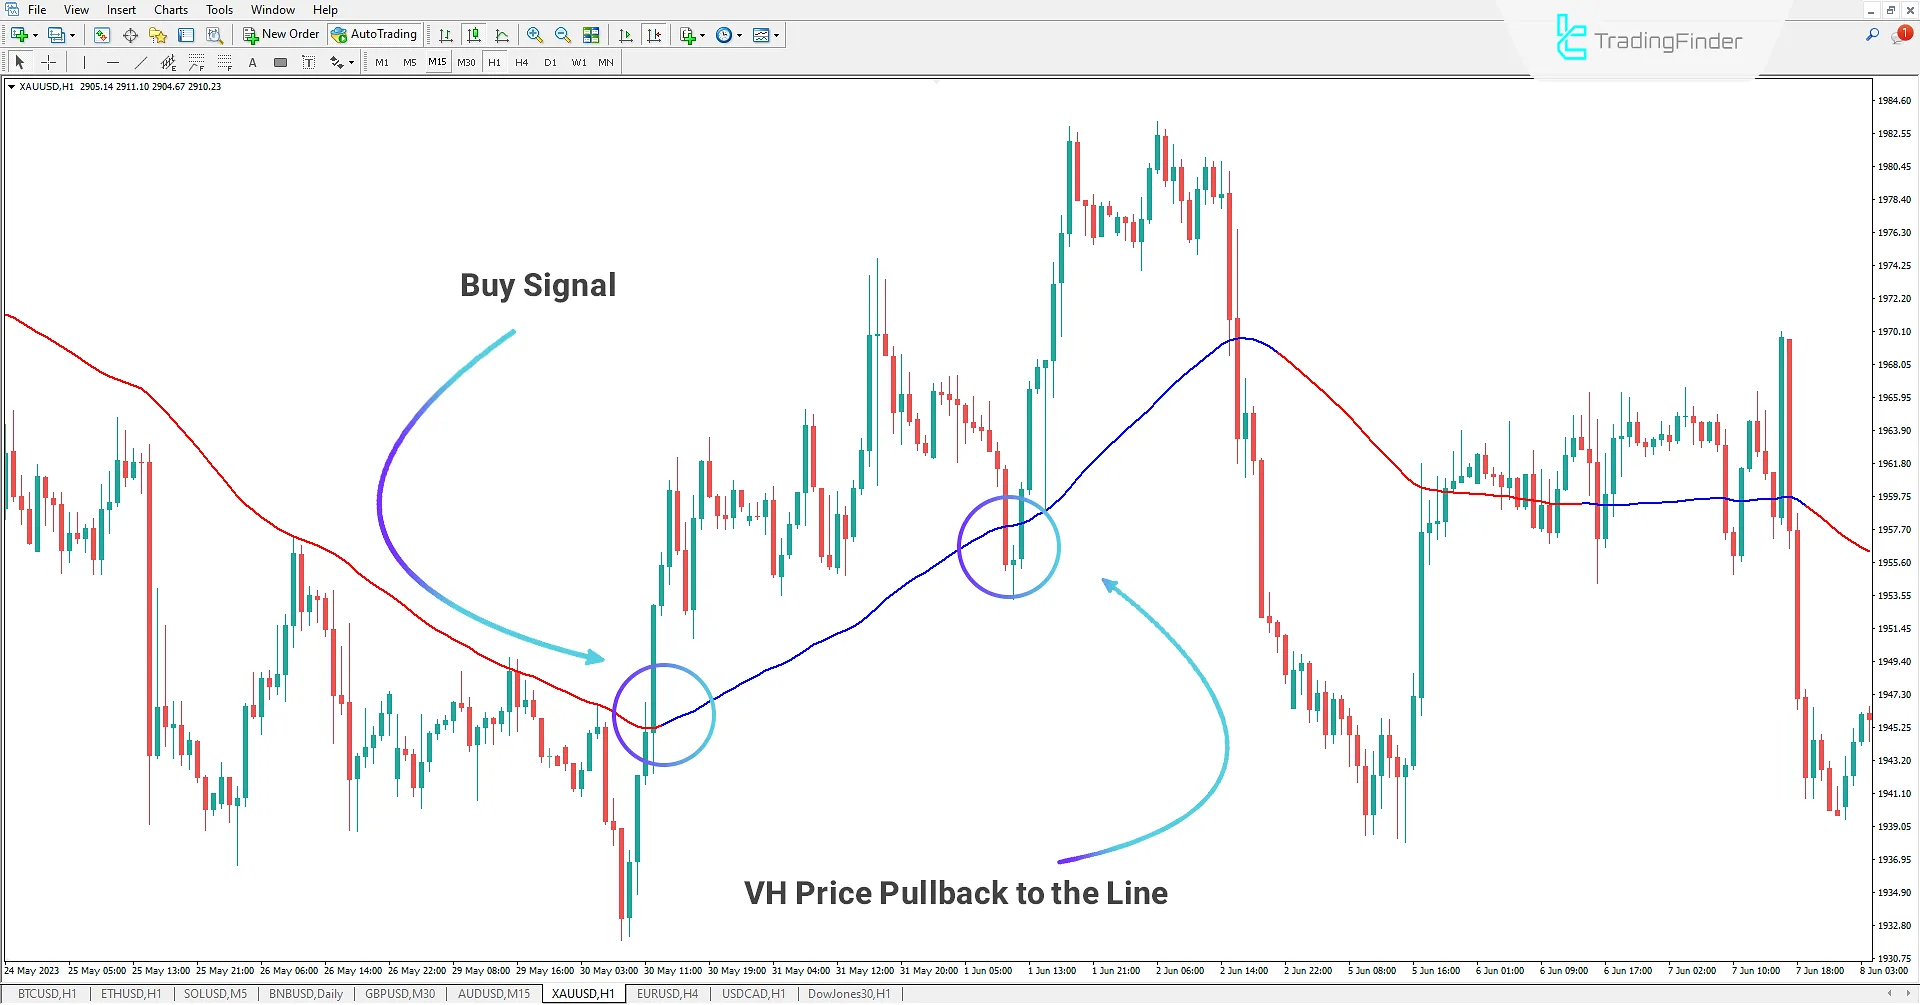
In the 1-hour Gold chart, the VH Indicator has identified a bullish trend. Traders can enter a buy position when the trend changes from bearish to bullish, indicated by the color change of the VH line.
Additionally, the VH line can be used as a support level. If the price retraces to this level, traders can re-enter the market and take advantage of favorable trading opportunities.

Bearish Trend
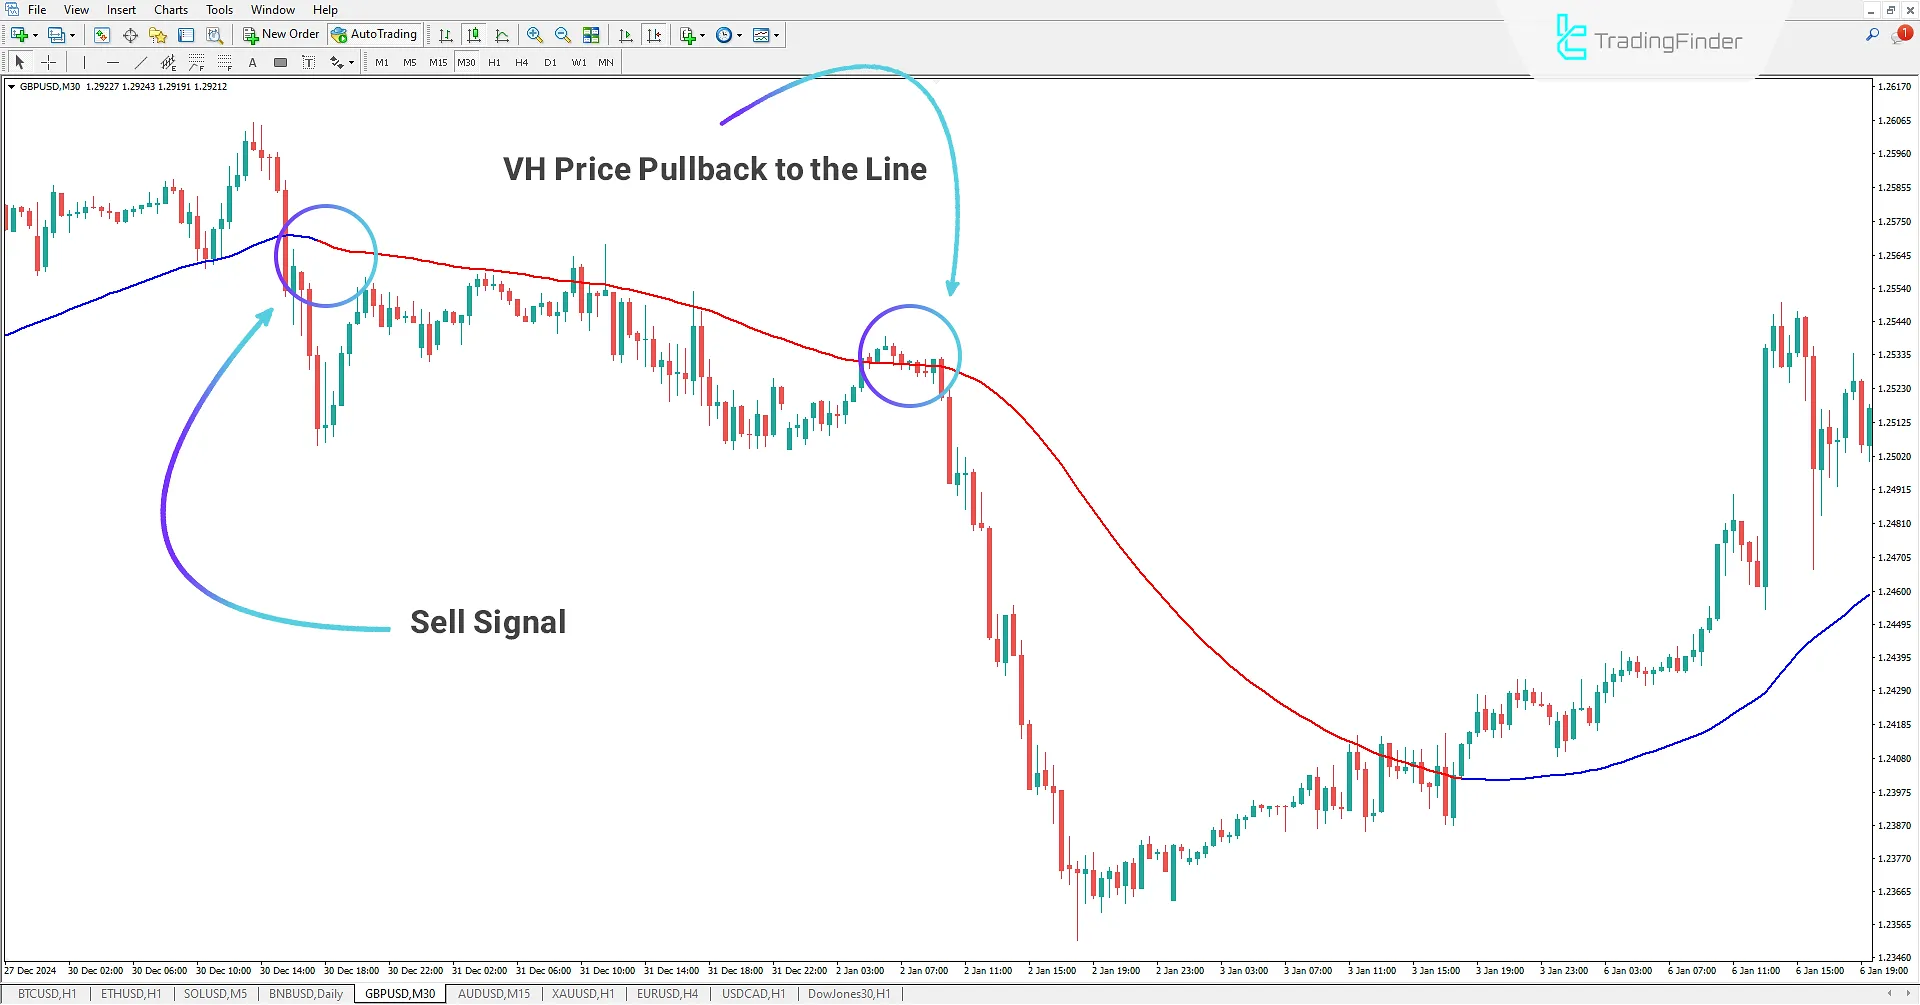
In the 30-minute GBP/USD chart, the price trend has changed from bullish to bearish. Traders can enter a sell position after confirming the trend change through the VH Indicator and observing the color change of the VH line.
If traders delay entering the trade, they can use the VH line as a resistance level and enter a sell position when the price retraces to this level or use it as a re-entry point.

VH Indicator Settings
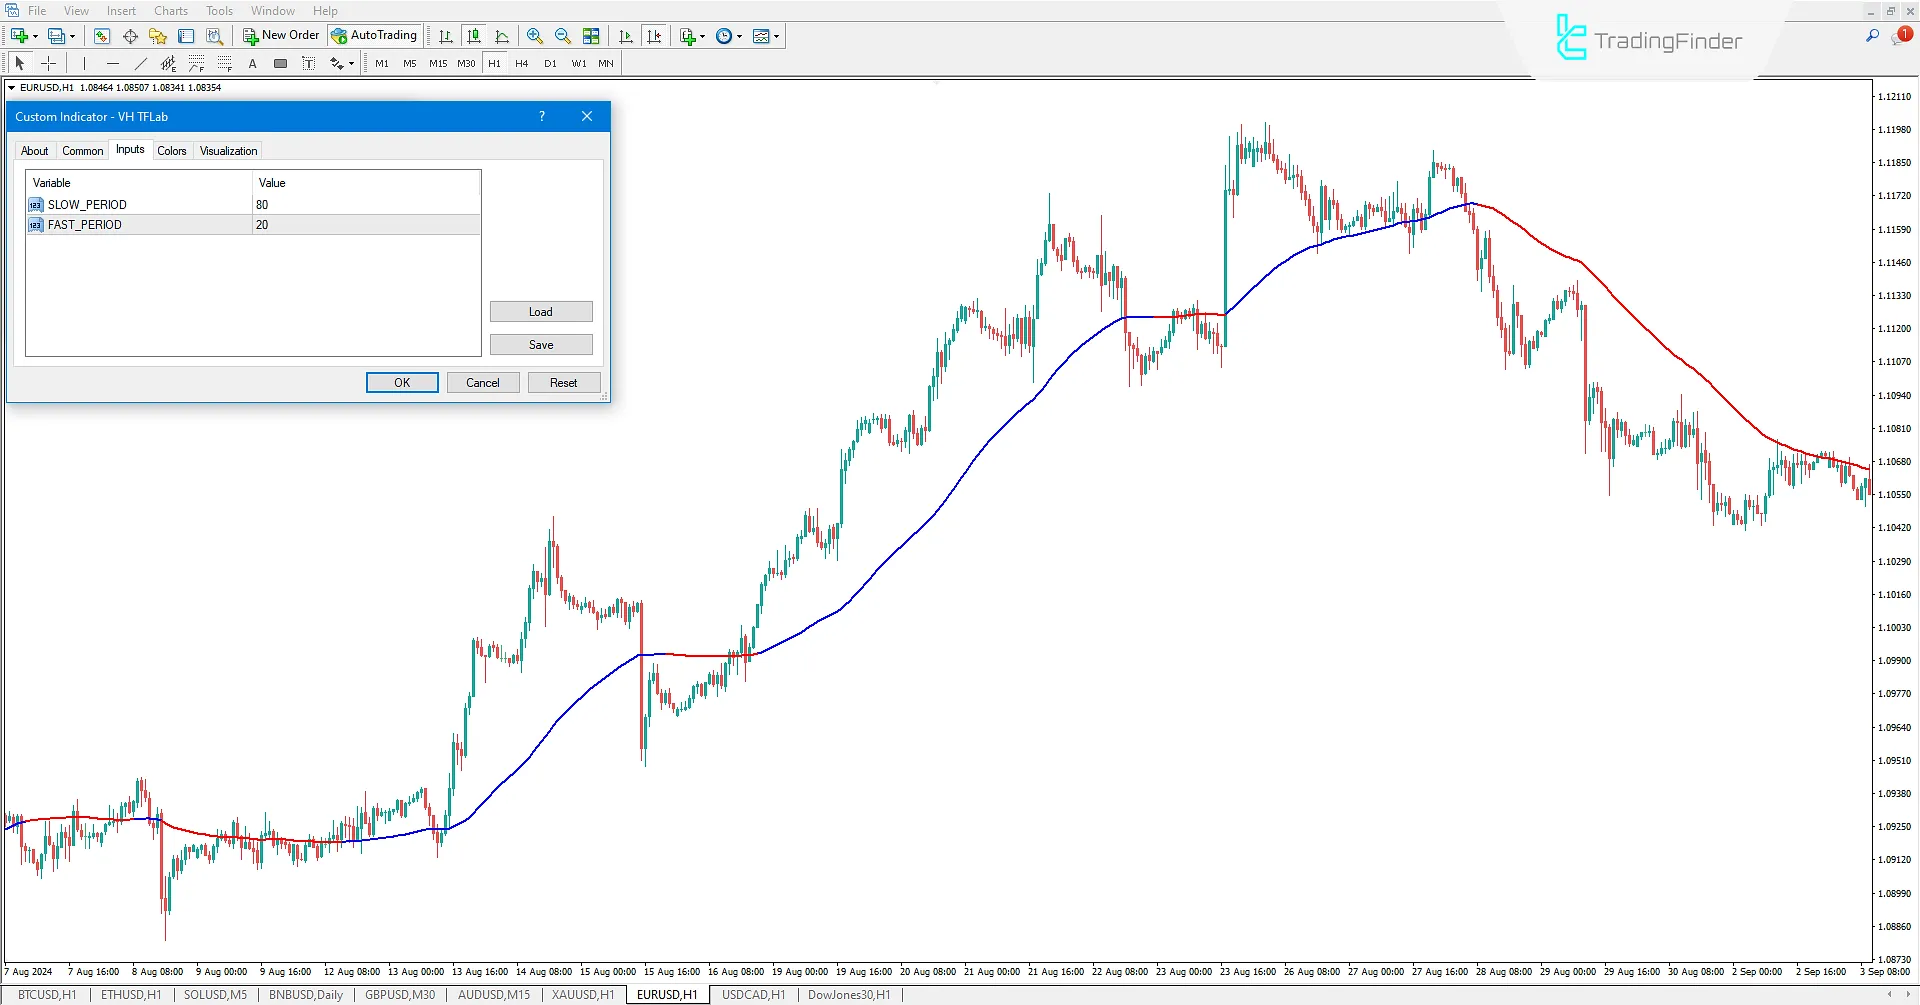
The settings for the VH Indicator are as follows:

- Slow Period: Set the period for the Slow moving average
- Fast Period: Set the period for the Fast moving average
Conclusion
The VH Indicator is a useful tool for identifying trading opportunities. It is one of the signal and forecasting indicators for MetaTrader 4 and is used to detect trends on the chart.
Traders can use the trend changes identified by this indicator as trading signals. Additionally, the VH line can be used as a support or resistance level, allowing traders to make more specialized trading decisions when the price interacts with this level.
VH MT4 PDF
VH MT4 PDF
Click to download VH MT4 PDFWhat is the VH Indicator?
The VH Indicator is one of the MetaTrader 4 indicators that identifies bullish and bearish market trends using the crossover of two moving averages.
How can I identify market trends using the VH Indicator?
This indicator displays bullish trends in blue and bearish trends in red. Traders can use these color changes to enter trades.


