![Volume Profile Indicator for MT4 Download – Free – [TradingFinder]](https://cdn.tradingfinder.com/image/391608/13-126-en-volume-profile-mt4-01.webp)
![Volume Profile Indicator for MT4 Download – Free – [TradingFinder] 0](https://cdn.tradingfinder.com/image/391608/13-126-en-volume-profile-mt4-01.webp)
![Volume Profile Indicator for MT4 Download – Free – [TradingFinder] 1](https://cdn.tradingfinder.com/image/391596/13-126-en-volume-profile-mt4-02.webp)
![Volume Profile Indicator for MT4 Download – Free – [TradingFinder] 2](https://cdn.tradingfinder.com/image/391629/13-126-en-volume-profile-mt4-03.webp)
![Volume Profile Indicator for MT4 Download – Free – [TradingFinder] 3](https://cdn.tradingfinder.com/image/391607/13-126-en-volume-profile-mt4-04.webp)
The Volume Profile Indicator analyzes price behavior and displays trading volume at different price levels.
Unlike traditional volume indicators that showvolume over time, the Volume Profile indicator presents trading volume along the price axis. This trading tool uses green histograms to graphically display volume levels.
Additionally, the indicator highlights areas with the highest volume or POC (Point of Control), as well as Value Area High (VAH) and Value Area Low (VAL) levels.
Volume Profile Indicator Specifications Table
The specifications of the Volume Profile indicator are as follows.
Indicator Categories: | Volume MT4 Indicators Support & Resistance MT4 Indicators Trading Assist MT4 Indicators Volume Profile Indicators for MetaTrader 4 |
Platforms: | MetaTrader 4 Indicators |
Trading Skills: | Intermediate |
Indicator Types: | Reversal MT4 Indicators |
Timeframe: | Multi-Timeframe MT4 Indicators |
Trading Style: | Day Trading MT4 Indicators Scalper MT4 Indicators Swing Trading MT4 Indicators |
Trading Instruments: | Forward Market MT4 Indicators Stock Market MT4 Indicators Cryptocurrency MT4 Indicators Forex MT4 Indicators |
Volume Profile at a Glance
Trading volume peaks at POC or VPOC levels; hence, price often tends to revert to these zones.POC, VAH, and VAL are considered critical support and resistance zones.
Bullish Trend Analysis
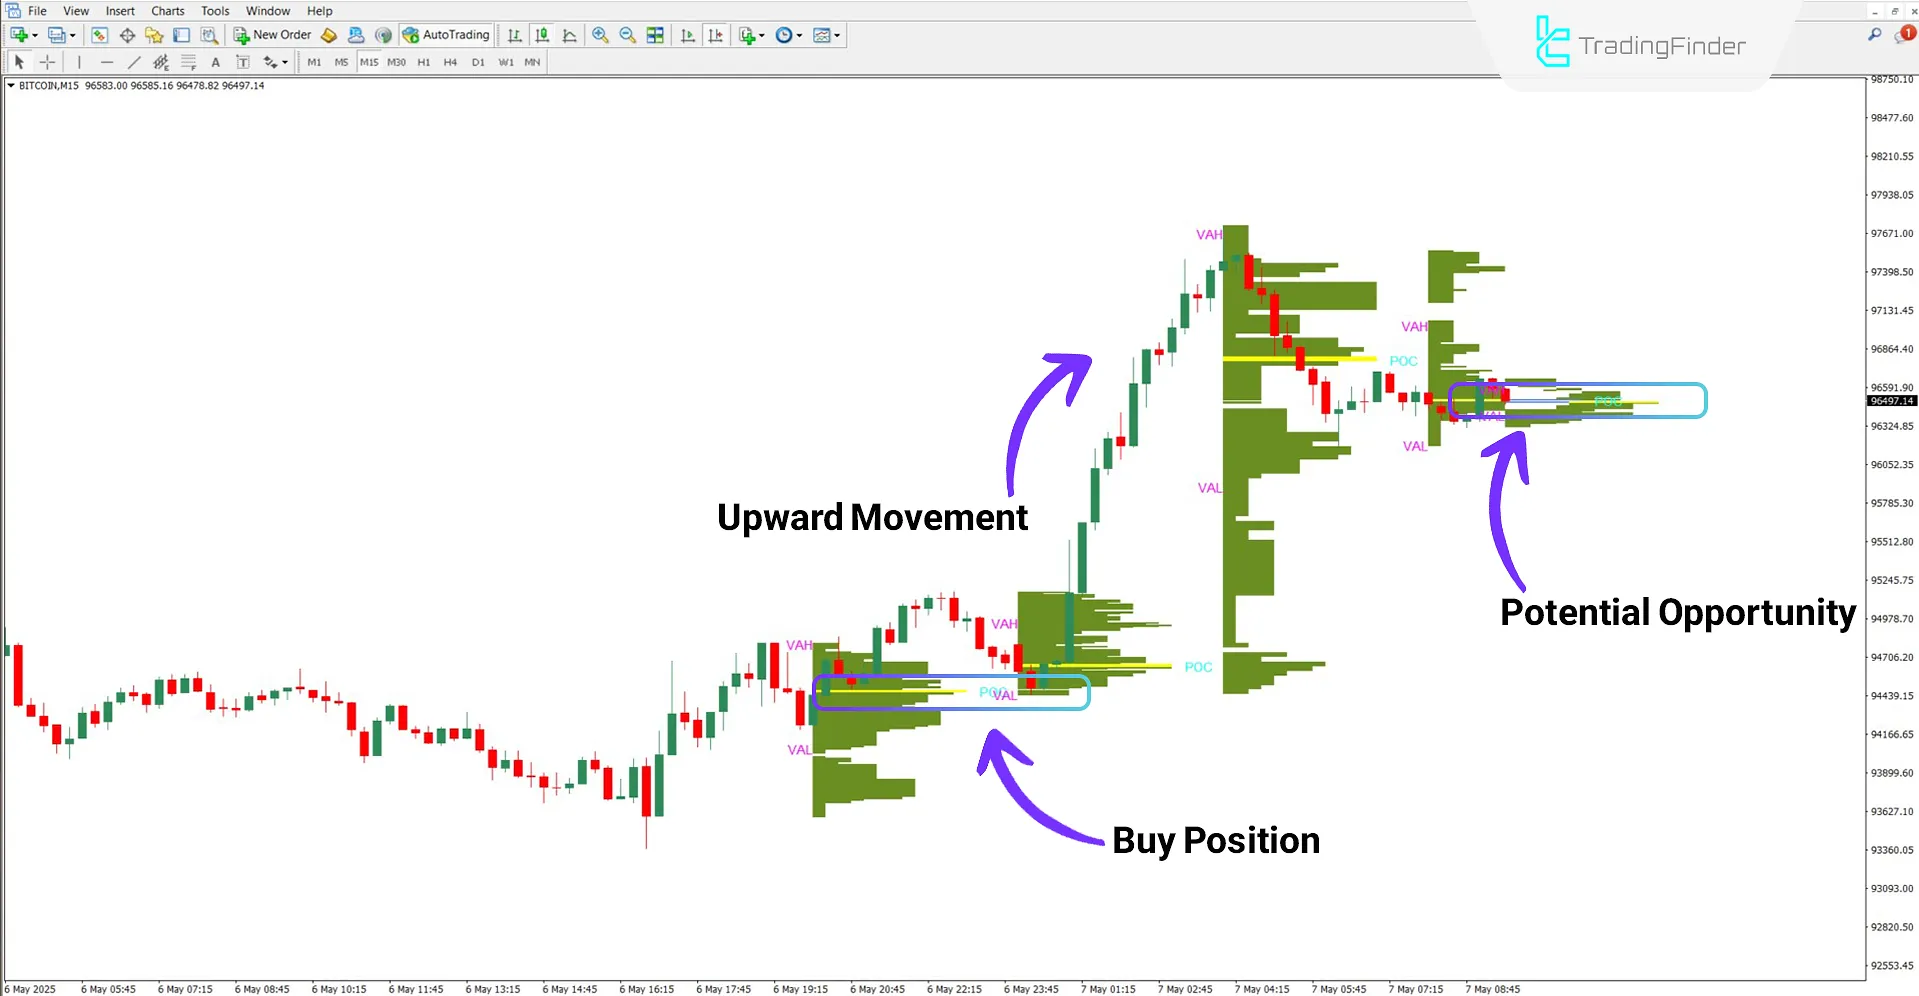
According to the analysis of Bitcoin (BTC) on the 15-minute timeframe, the yellow histogram indicates the POC or VPOC level.
As shown in the chart, the price returned to the POC level amid a short-term pullback, offering an opportunity to enter a buy position.

Bearish Trend Analysis
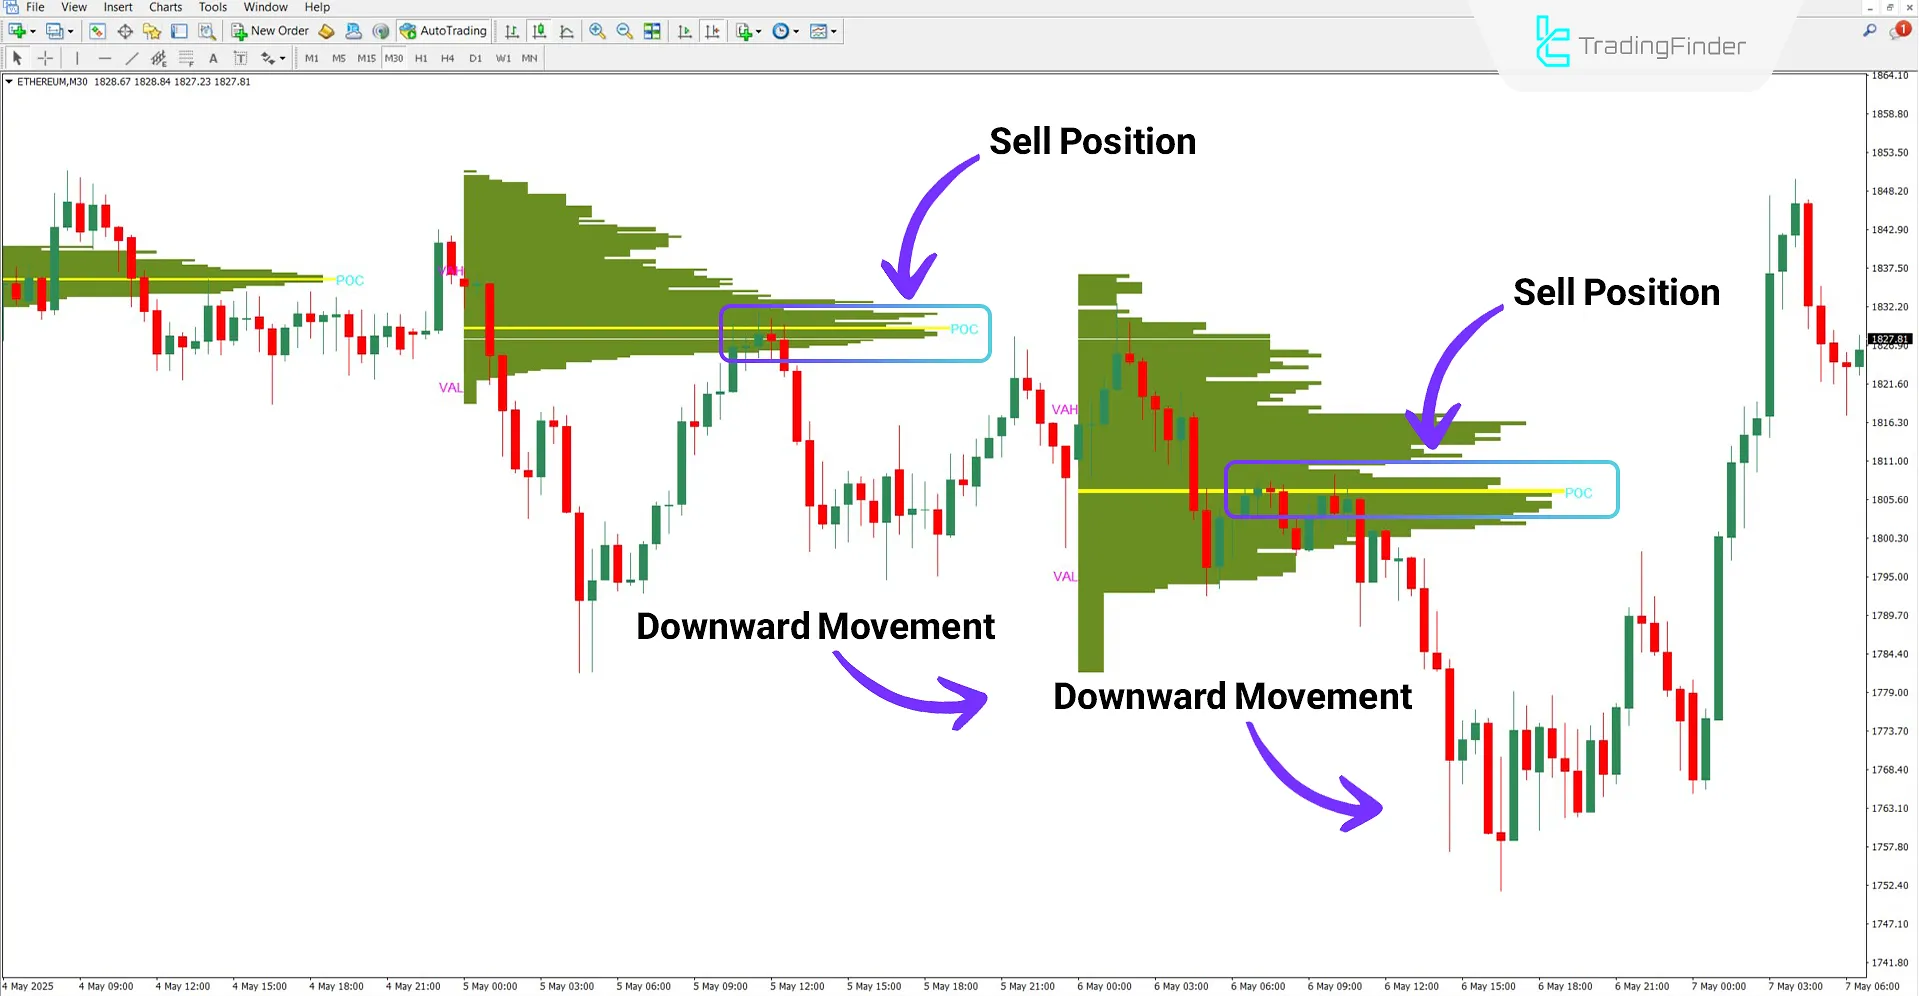
In the Ethereum (ETH) chart on the 30-minute timeframe, the POC level was a strong resistance zone at two marked points.
As seen in the image, each time the price returned to this zone, it created valid opportunities to enter sell positions.

Volume Profile Indicator Settings
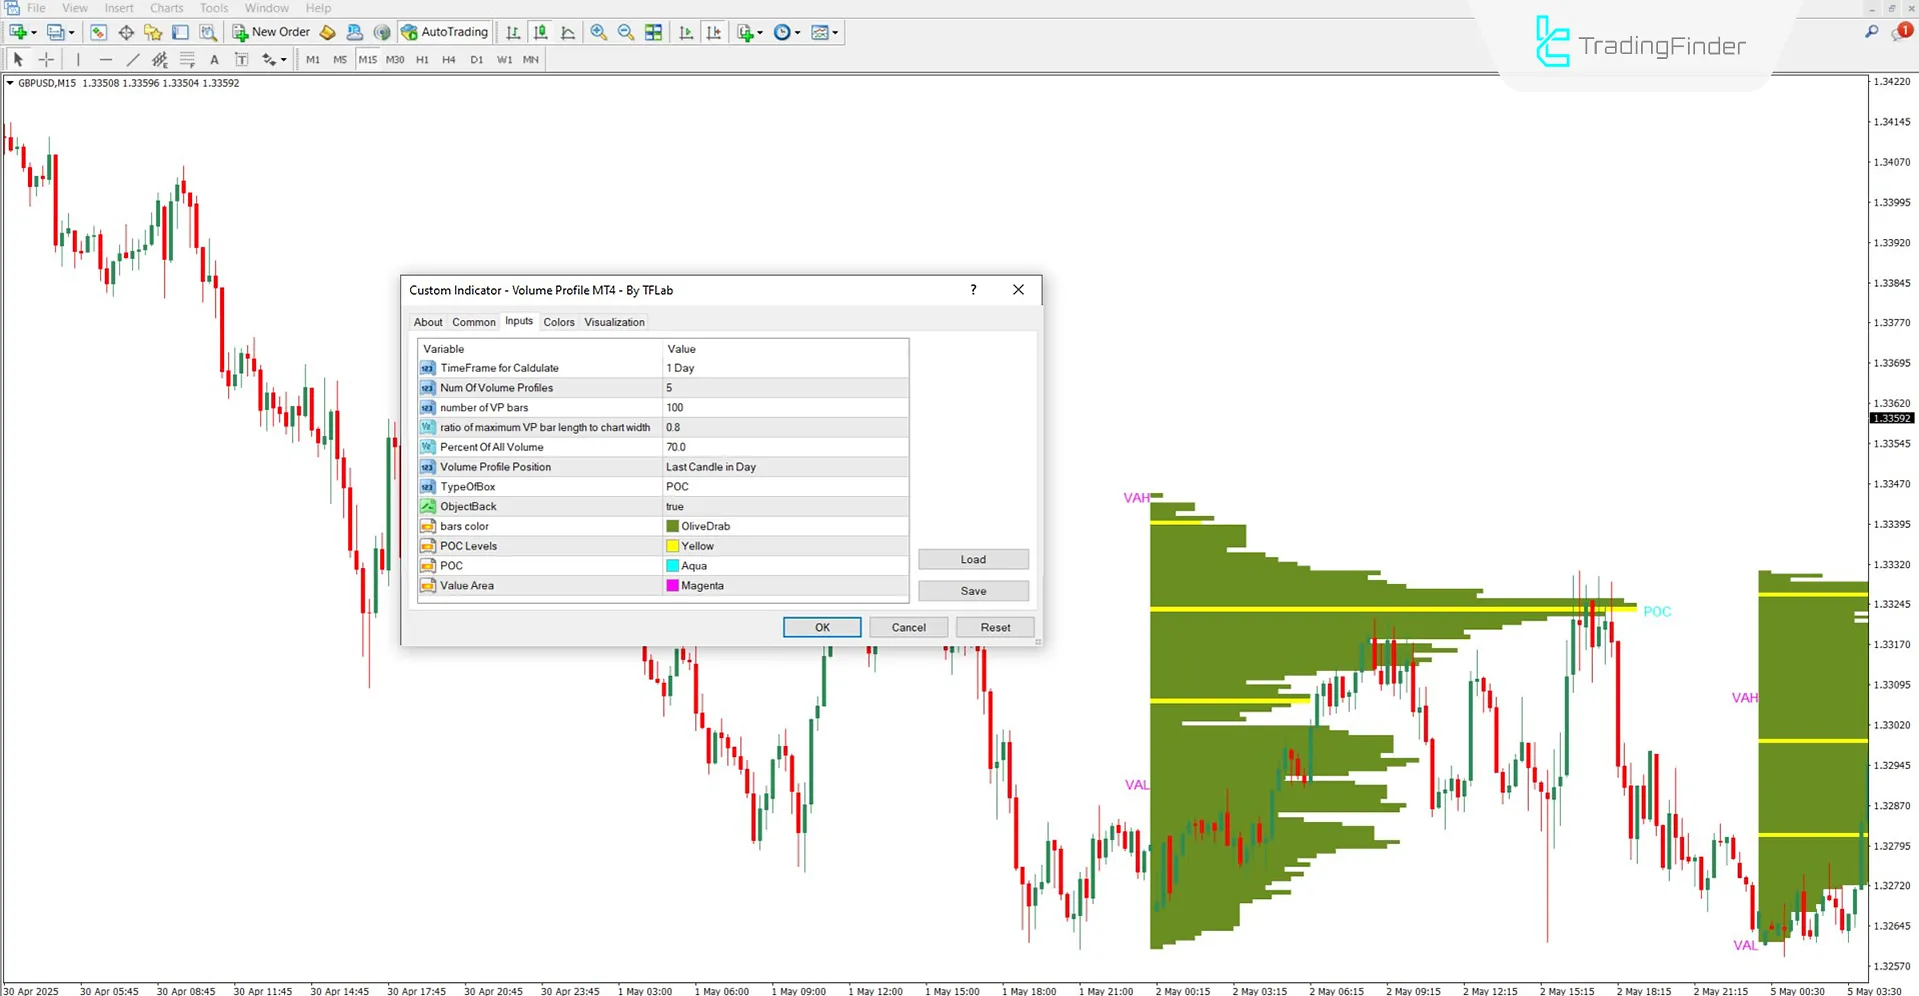
The image below illustrates the available settings of the Volume Profile indicator:

- Time Frame for Calculation: Select the timeframe for volume calculation
- Number of Volume Profiles: Number of volume profiles displayed on the chart
- Number of VP bars: Number of horizontal bars to show volume distribution
- Ratio of maximum VP bar length to chart width: Maximum bar length relative to chart width
- Percent of All Volume: Percentage of total volume to calculate the value area
- Volume Profile Position: Profile positioning on the chart
- TypeOfBox: Style of the volume profile box display
- ObjectBack: Places the volume profile behind the candlesticks
- Bars' color: Volume bar color
- POC Levels: Color setting for the POC bar
- POC: Color of the POC label
- Value Area: Colors for VAH and VAL zones
Note: The selected "Time Frame for Calculation" must be higher than the timeframe for executing the indicator.
Conclusion
The Volume Profile Indicator visually displays trading volume across different price levels, making it a practical tool for identifying potential market reversal points.
This tool offers deeper insight into price behavior and enables analysis based on volume and trend dynamics. Combined with price action strategies, it significantly improves traders' ability to identify optimal trade entry points.
Volume Profile MT4 PDF
Volume Profile MT4 PDF
Click to download Volume Profile MT4 PDFDoes the Volume Profile indicator generate buy/sell signals?
No, this indicator does not generate trade signals. It is designed to display volume levels at various price points.
What is the POC level?
POC or Point of Control is the highest trading volume at the price level.
Thank you for your fast and excellent indicator. There are a few points to mention. First, why doesn’t the Day Volume Profile include the option to extend the Value Area Low, Value Area High, and POC? Also, the line settings section for customization is disabled Value areas and just show POC—could it be made possible to use dot/dash styles, etc.? Second, could a feature be added to extend the Value Area Low, Value Area High, and POC for the Day Volume Profile until future interaction? Thank you.
welcome. i passed your feedback and suggestions to our developer team. they will check.


