![ZigZag Triad Indicator for MetaTrader 4 Download - [TradingFinder]](https://cdn.tradingfinder.com/image/449309/11-91-en-zigzag-triad-mt4-01.webp)
![ZigZag Triad Indicator for MetaTrader 4 Download - [TradingFinder] 0](https://cdn.tradingfinder.com/image/449309/11-91-en-zigzag-triad-mt4-01.webp)
![ZigZag Triad Indicator for MetaTrader 4 Download - [TradingFinder] 1](https://cdn.tradingfinder.com/image/449285/11-91-en-zigzag-triad-mt4-02.webp)
![ZigZag Triad Indicator for MetaTrader 4 Download - [TradingFinder] 2](https://cdn.tradingfinder.com/image/449306/11-91-en-zigzag-triad-mt4-03.webp)
![ZigZag Triad Indicator for MetaTrader 4 Download - [TradingFinder] 3](https://cdn.tradingfinder.com/image/449284/11-91-en-zigzag-triad-mt4-04.webp)
The ZigZag Triad Indicator is an advanced and practical version of the standard ZigZag indicator, developed for the MetaTrader 4 platform. It identifies ZigZag pivot points and marks them on the chart as support and resistance levels (colored blue and red).
Forex traders can use these key levels as price reaction zones, enabling them to make informed trading decisions based on price behavior around these areas.
ZigZag Triad Indicator Specifications Table
Below are the general specifications of the ZigZag Triad Indicator:
Indicator Categories: | Pivot Points & Fractals MT4 Indicators Support & Resistance MT4 Indicators Levels MT4 Indicators Zigzag Indicators for MetaTrader 4 |
Platforms: | MetaTrader 4 Indicators |
Trading Skills: | Intermediate |
Indicator Types: | Leading MT4 Indicators Reversal MT4 Indicators Non-Repainting MT4 Indicators |
Timeframe: | Multi-Timeframe MT4 Indicators |
Trading Style: | Day Trading MT4 Indicators Intraday MT4 Indicators Scalper MT4 Indicators |
Trading Instruments: | Share Stocks MT4 Indicators Indices Market MT4 Indicators Stock Market MT4 Indicators Forex MT4 Indicators |
Indicator at a Glance
The ZigZag Triad Indicator is a highly functional tool for traders seeking to identify pivot points using ZigZag structure. By displaying support and resistance levels on the price chart, this indicator allows traders to recognize key market zones.
In addition, the plotted ZigZag lines help analyze price behavior and market structure, offering deeper insight into trends and price swings for technical traders.
Uptrend
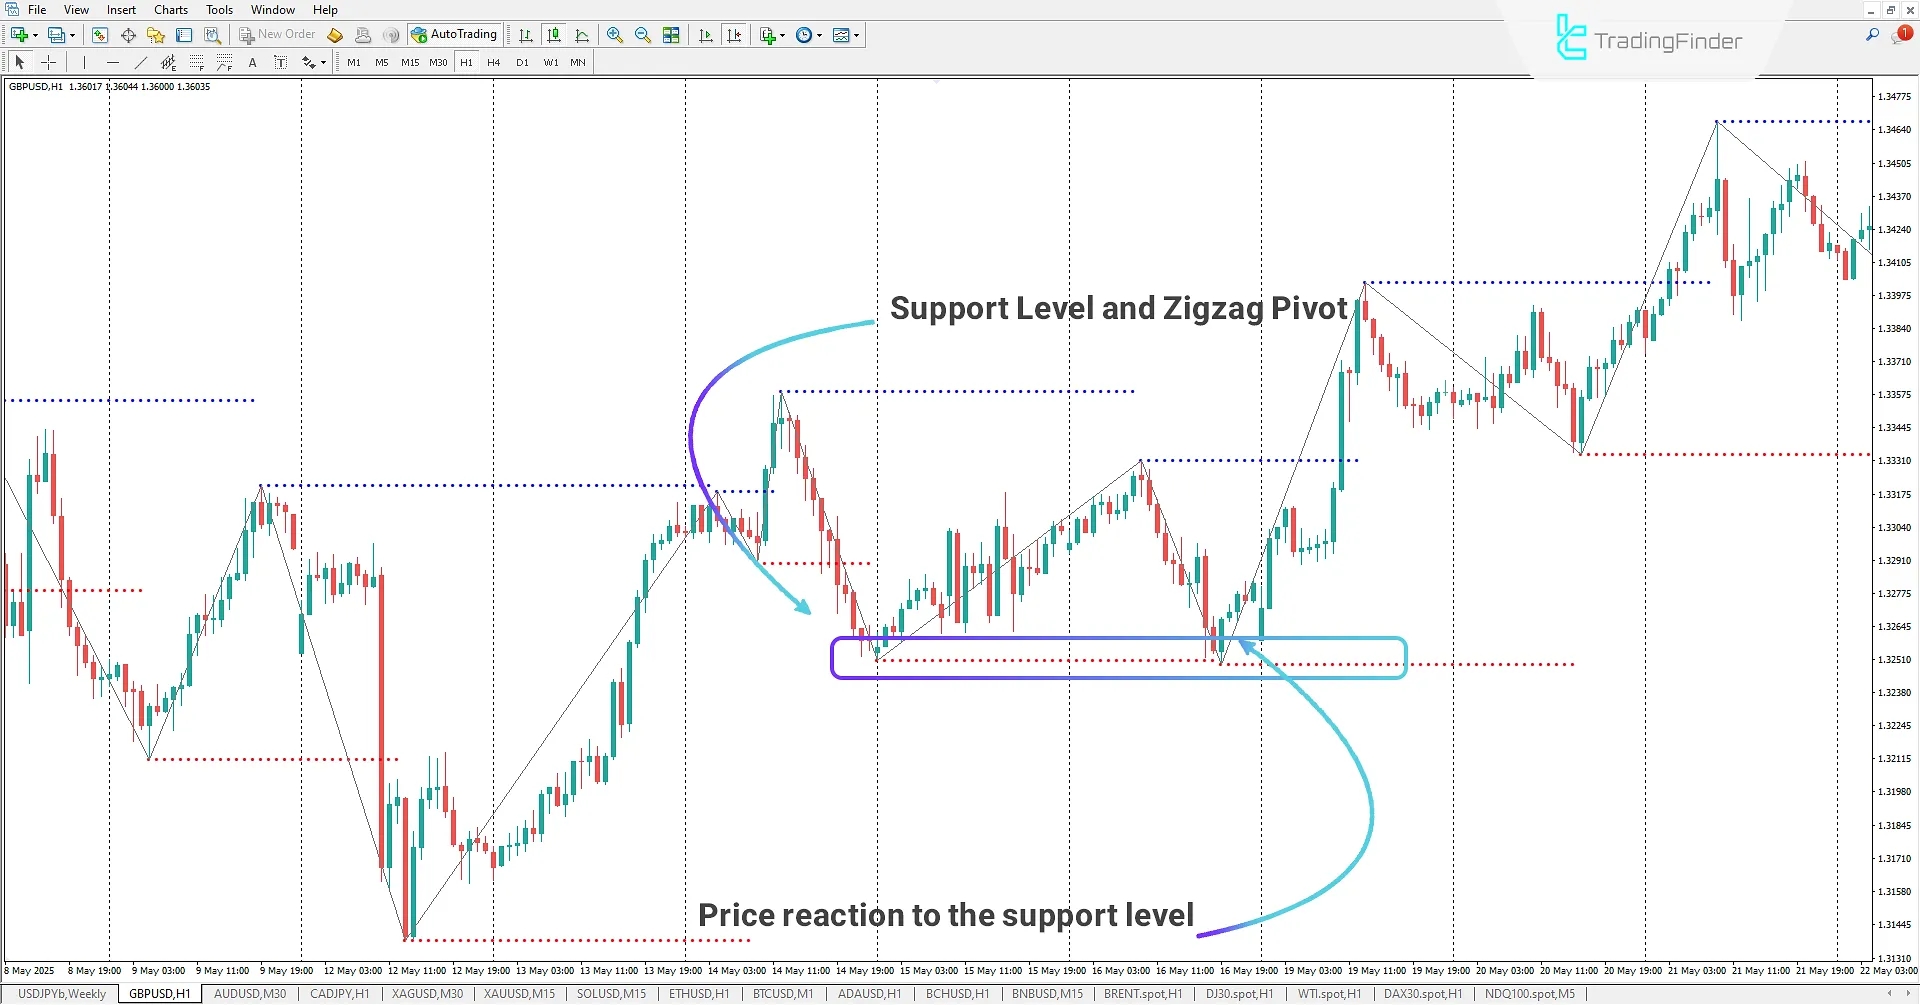
On the 1-hour GBP/USD chart, the ZigZag Triad Indicator, once activated, plots ZigZag pivot levels on the chart. These levels can serve as valid support zones in technical analysis.
By analyzing price behavior and the market’s reversal structure, traders can enter buy positions if the price pulls back to these levels, using them as low-risk entry points.

Downtrend
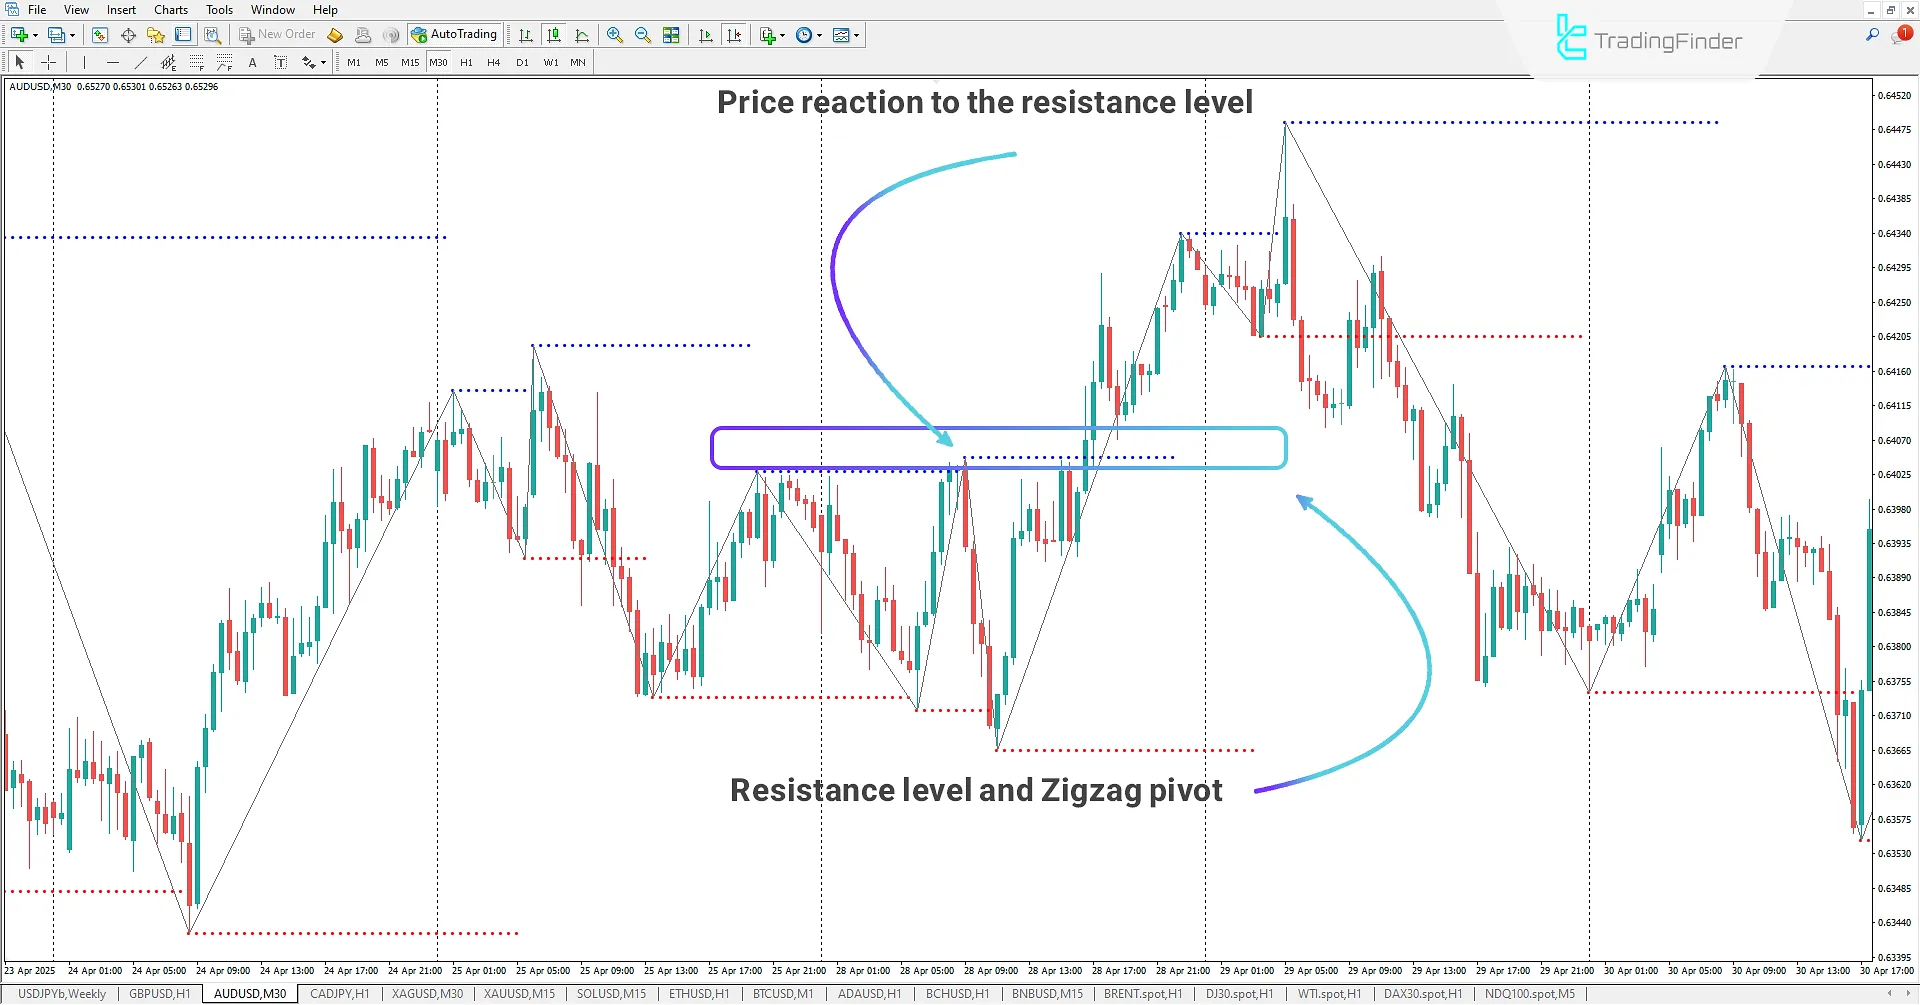
On the 30-minute AUD/USD chart, traders can utilize the resistance levels plotted on the chart for more advanced market behavior analysis.
When the ZigZag Triad Indicator is applied, ZigZag pivot points are displayed on the chart. These levels act as valid resistance zones, and when the price retraces to these areas, traders may enter sell positions.

ZigZag Triad Indicator Settings
Below are the settings related to the ZigZag Triad Indicator:

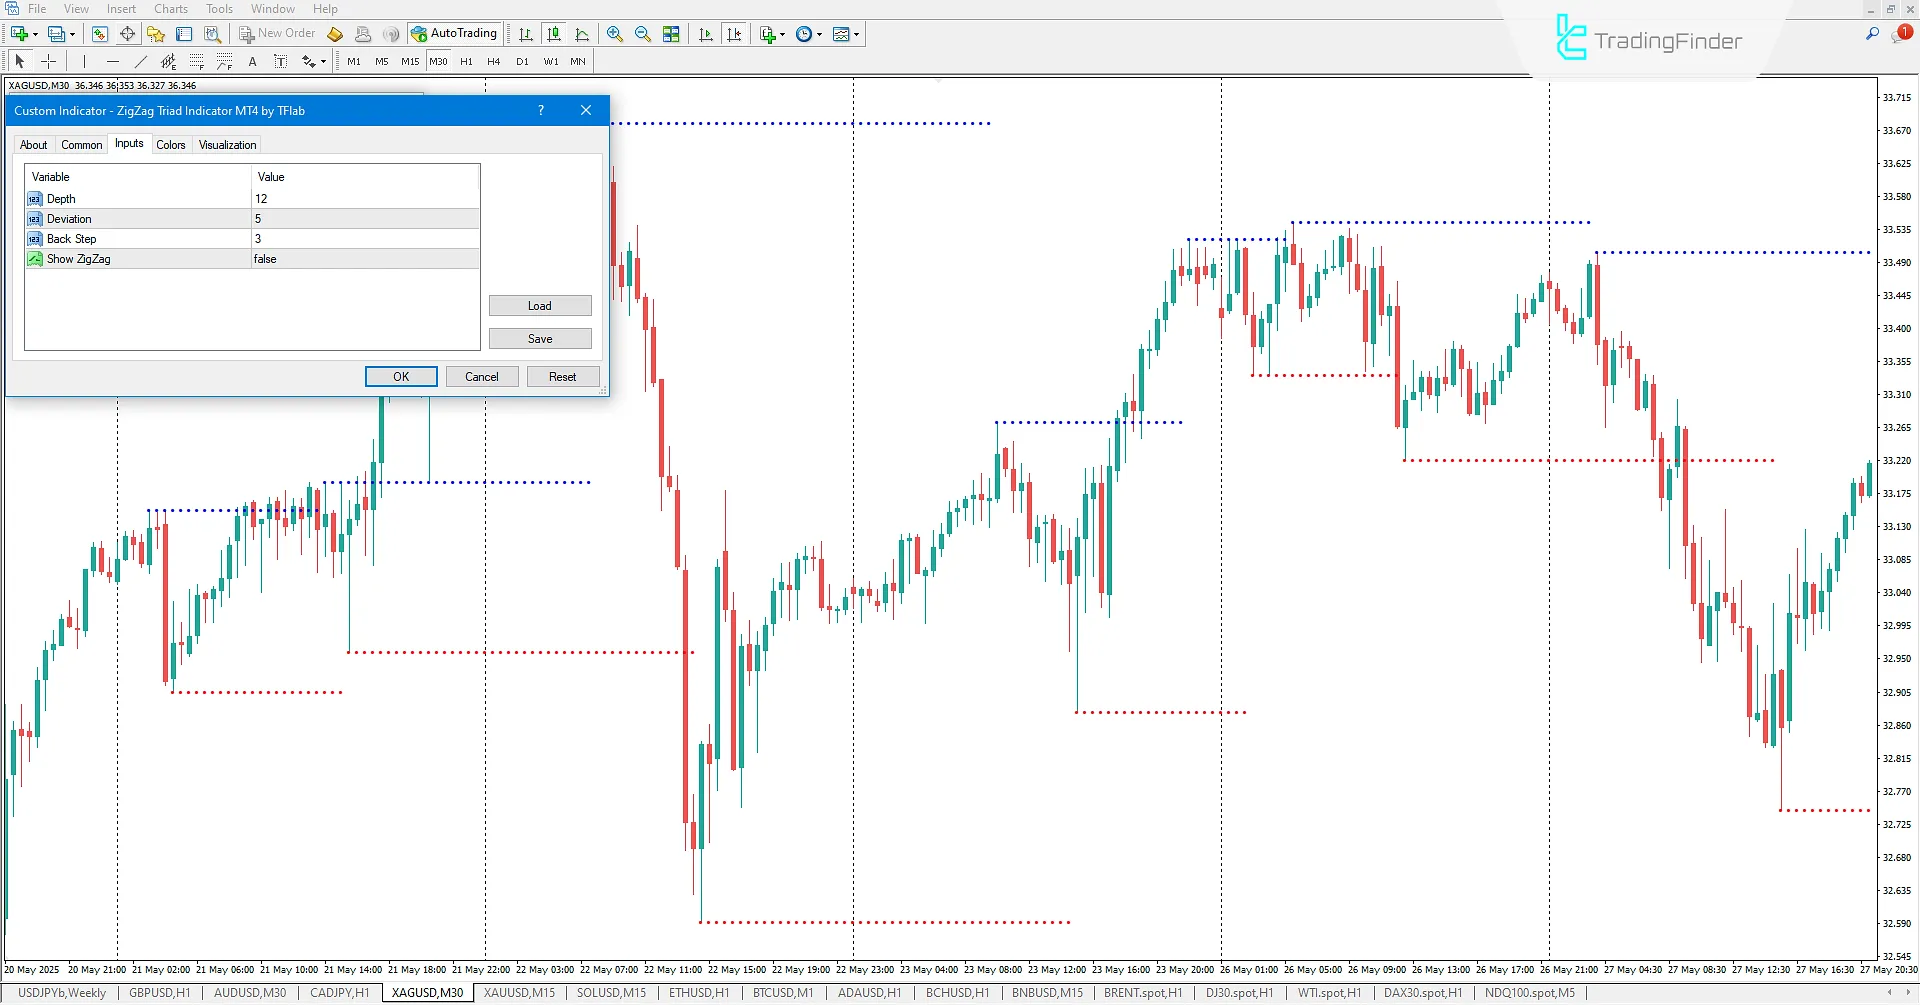
- Depth: Sets the ZigZag depth period;
- Deviation: Sets the ZigZag deviation period;
- Back Step: Sets the ZigZag back step period;
- Show ZigZag: Enables/disables display of ZigZag lines.
Conclusion
The ZigZag Triad Indicator is an advanced and practical tool that not only plots ZigZag lines but also identifies pivot points as support and resistance levels for traders.
With every new pivot in the ZigZag structure, the indicator marks the level on the chart as either a support or resistance line.
This feature allows traders to combine the insights from ZigZag patterns with key market levels, enabling more professional price chart analysis.
ZigZag Triad MT4 PDF
ZigZag Triad MT4 PDF
Click to download ZigZag Triad MT4 PDFWhat is the ZigZag Triad Indicator?
The ZigZag Triad Indicator is an advanced version of the standard ZigZag tool developed for MetaTrader 4. It helps traders better analyze the market by showing pivot points as support and resistance levels.
What makes the ZigZag Triad Indicator different from the standard ZigZag?
While the standard version only displays zigzag lines, the triple version marks pivot points as support (red) and resistance (blue) levels on the chart, enabling more advanced analysis.


