![ZigZag with Labels Indicator for MetaTrader 4 Download - Free - [TradingFinder]](https://cdn.tradingfinder.com/image/105206/11-43-en-zigzag-with-labels-mt4.webp)
![ZigZag with Labels Indicator for MetaTrader 4 Download - Free - [TradingFinder] 0](https://cdn.tradingfinder.com/image/105206/11-43-en-zigzag-with-labels-mt4.webp)
![ZigZag with Labels Indicator for MetaTrader 4 Download - Free - [TradingFinder] 1](https://cdn.tradingfinder.com/image/37255/11-7-en-zigzag-with-labels-mt4-02.avif)
![ZigZag with Labels Indicator for MetaTrader 4 Download - Free - [TradingFinder] 2](https://cdn.tradingfinder.com/image/37256/11-7-en-zigzag-with-labels-mt4-03.avif)
![ZigZag with Labels Indicator for MetaTrader 4 Download - Free - [TradingFinder] 3](https://cdn.tradingfinder.com/image/37264/11-7-en-zigzag-with-labels-mt4-04.avif)
The ZigZag with Labels, Meta Trader4 indicator identifies points on the price chart that have more significant changes than previous waves and connects these points, helping traders recognize trends. This indicator also identifies pivot points where the price chart changes direction.
Pivots, also known as reversal points, occur when supply and demand interact. There are two types of pivots: major pivots (significant price reversals) and minor pivots (smaller swings).
ZigZag Indicator Table
Indicator Categories: | Pivot Points & Fractals MT4 Indicators Levels MT4 Indicators Elliott Wave Tradingview Indicators |
Platforms: | MetaTrader 4 Indicators |
Trading Skills: | Elementary |
Indicator Types: | Lagging MT4 Indicators Reversal MT4 Indicators |
Timeframe: | Multi-Timeframe MT4 Indicators |
Trading Style: | Day Trading MT4 Indicators Fast Scalper MT4 Indicators Scalper MT4 Indicators Swing Trading MT4 Indicators |
Trading Instruments: | Share Stocks MT4 Indicators Indices Market MT4 Indicators Commodity Market MT4 Indicators Stock Market MT4 Indicators Cryptocurrency MT4 Indicators Forex MT4 Indicators |
Overview of the ZigZag Indicator
Understanding and identifying pivot points on a price chart is essential for all trading strategies. This indicator helps traders recognize the primary market trend, classic patterns, support and resistance levels, Elliott Waves, and ranging zones.
Major and Minor Pivots
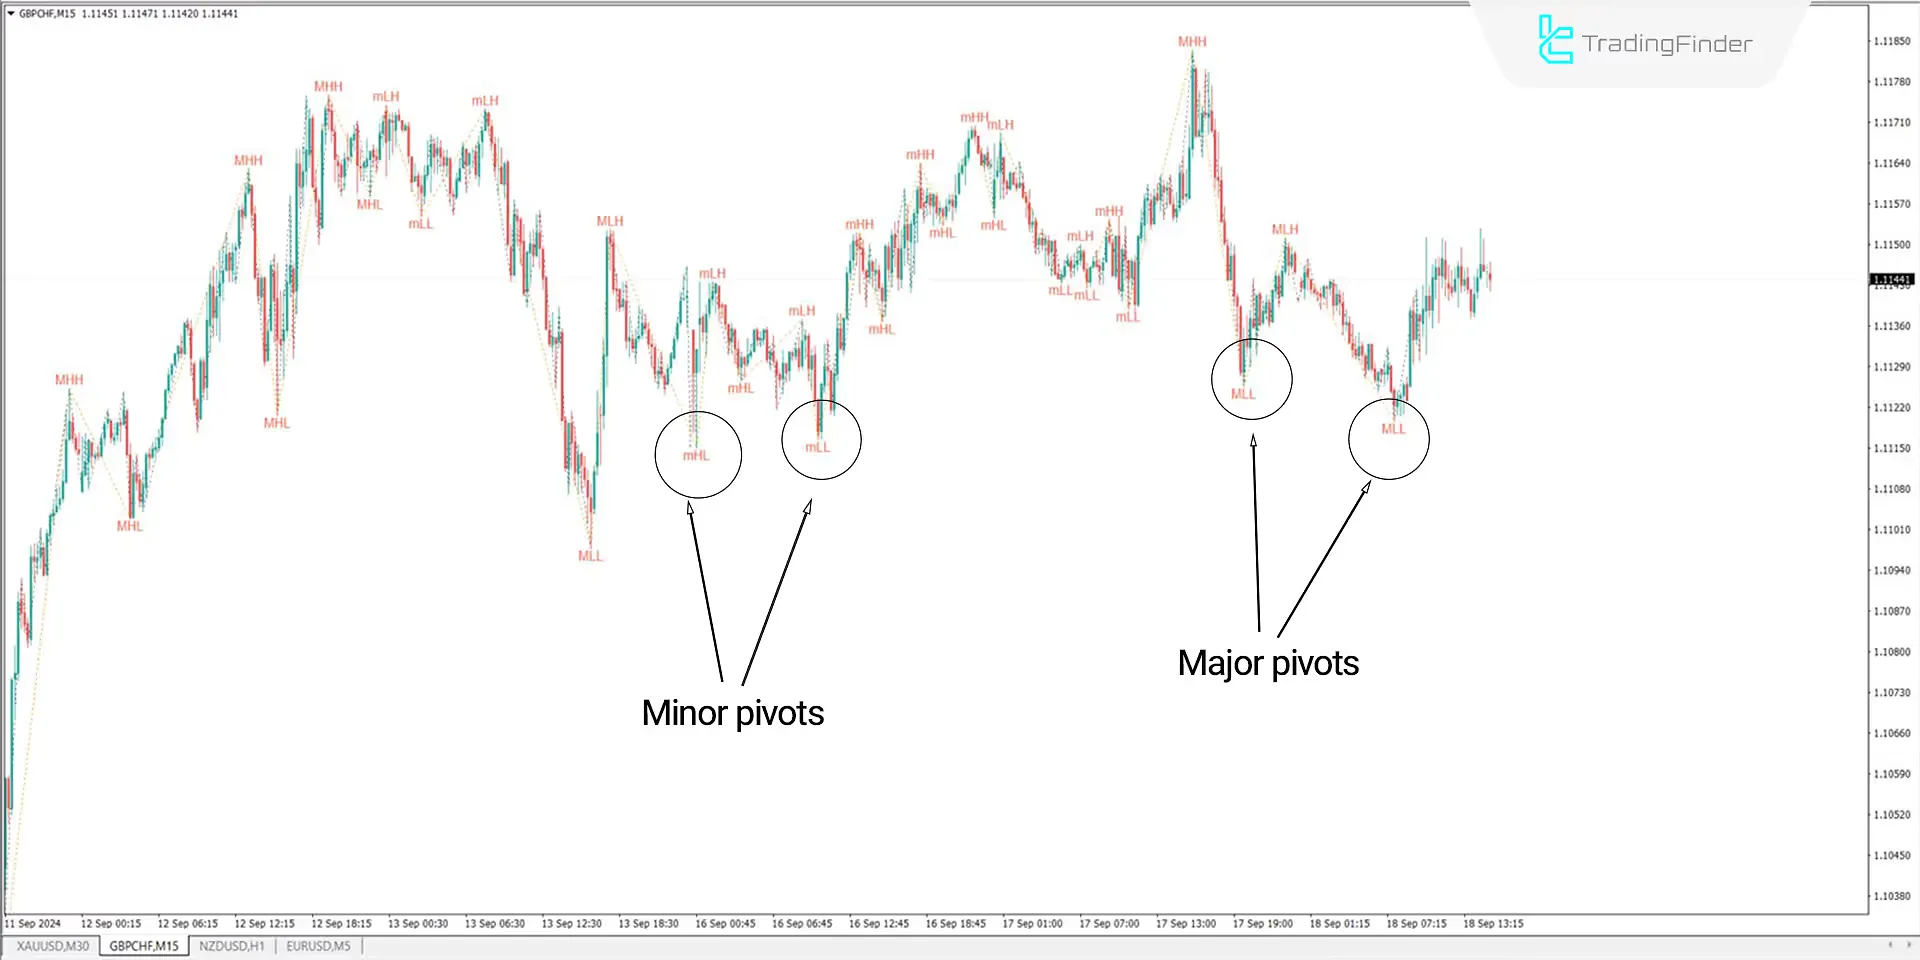
In the 15-minute GBP/CHF chart below, the indicator shows major pivots (M) and minor pivots (m), helping traders identify the primary market trend by recognizing key highs and lows.
Recognizing Classic Patterns
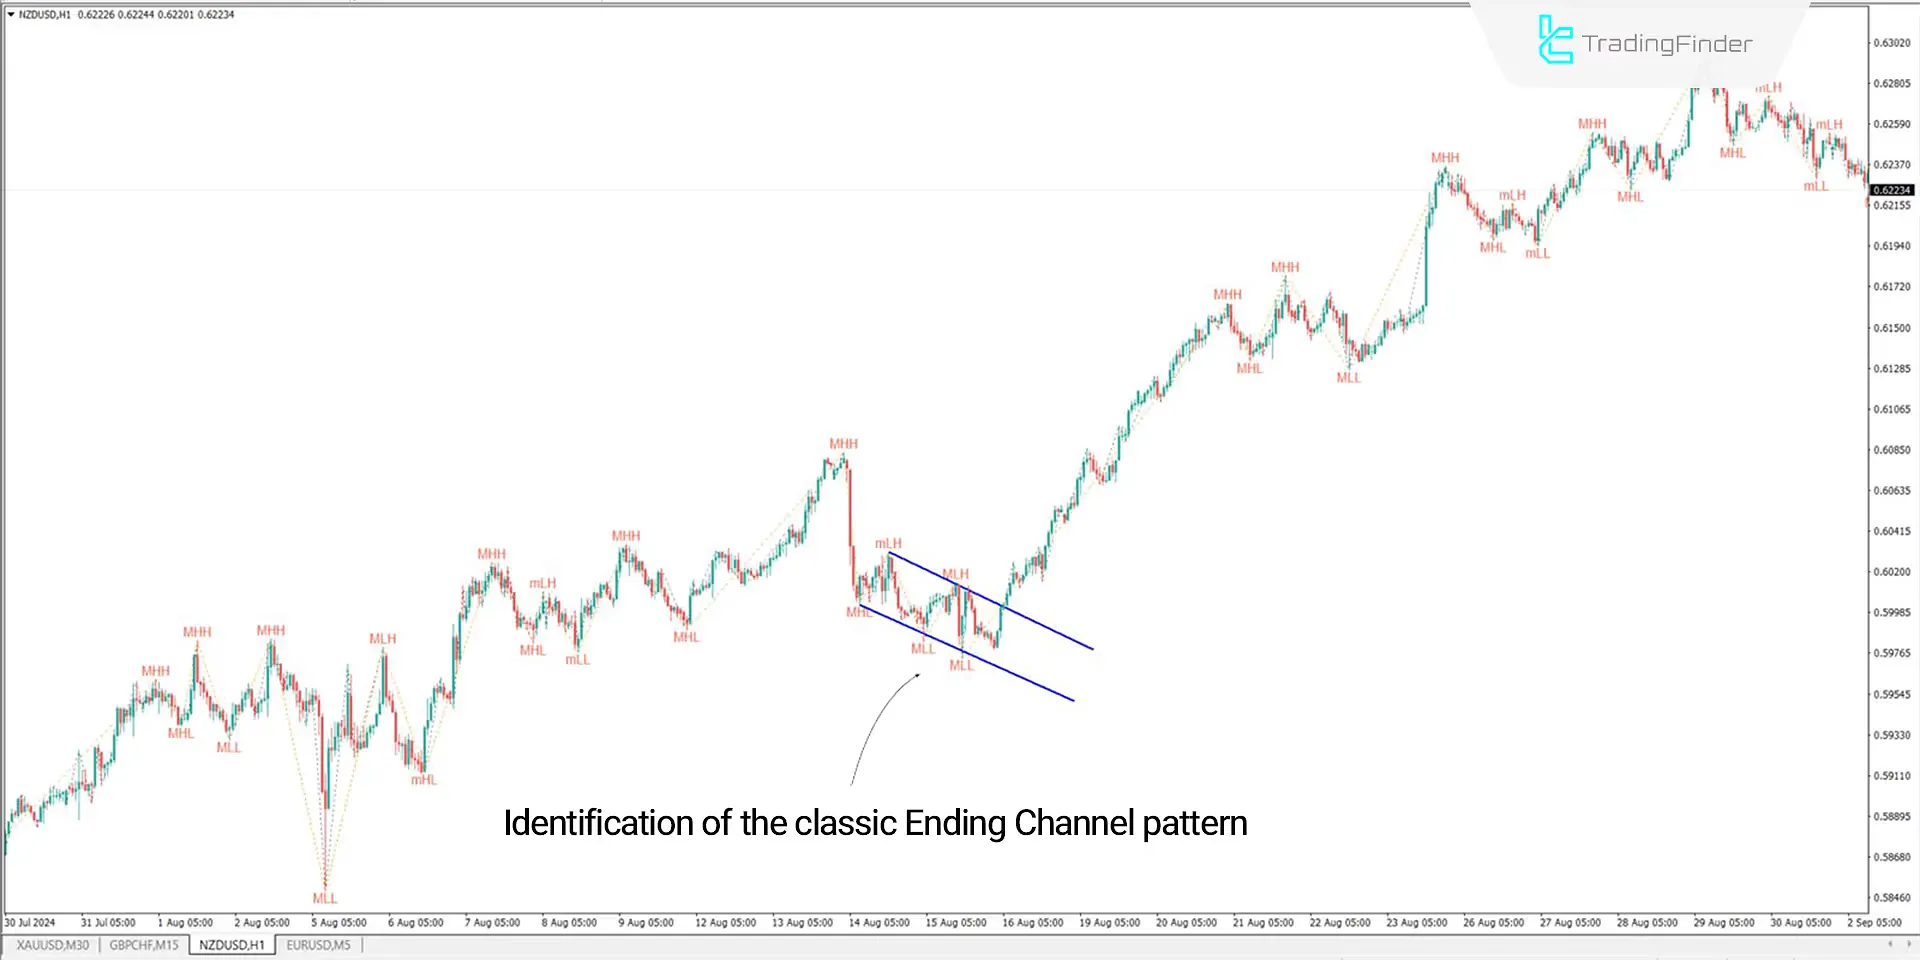
The 1-hour NZD/USD chart below, the ZigZag indicator helps identify classic technical patterns such as head and shoulders, double tops and bottoms, and the ending channel pattern. Traders can recognize an ending channel in the chart using the highs and lows detected by the indicator.
Support and Resistance Levels
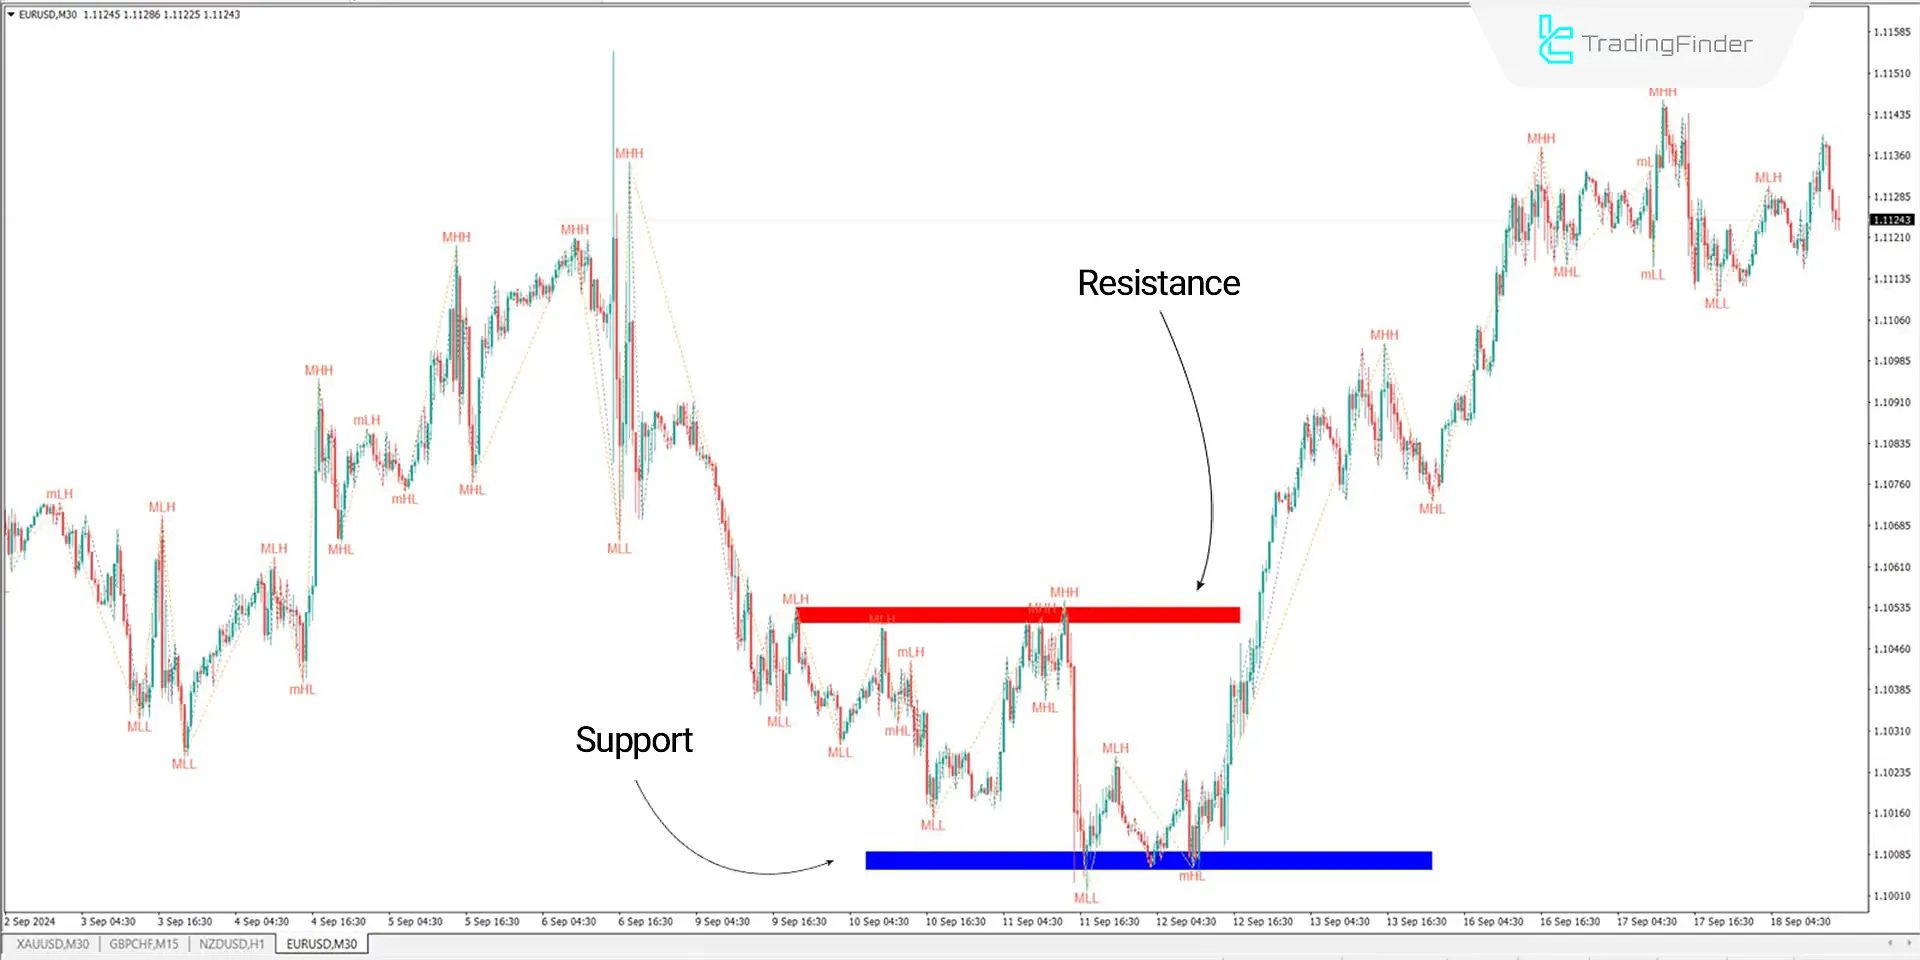
One of the easiest ways to identify support and resistance levels is by detecting pivot points on the chart. In the 30-minute EUR/USD chart below, the major pivots identified by the ZigZag indicator help traders find the price chart's primary support and resistance levels.
Elliott Waves
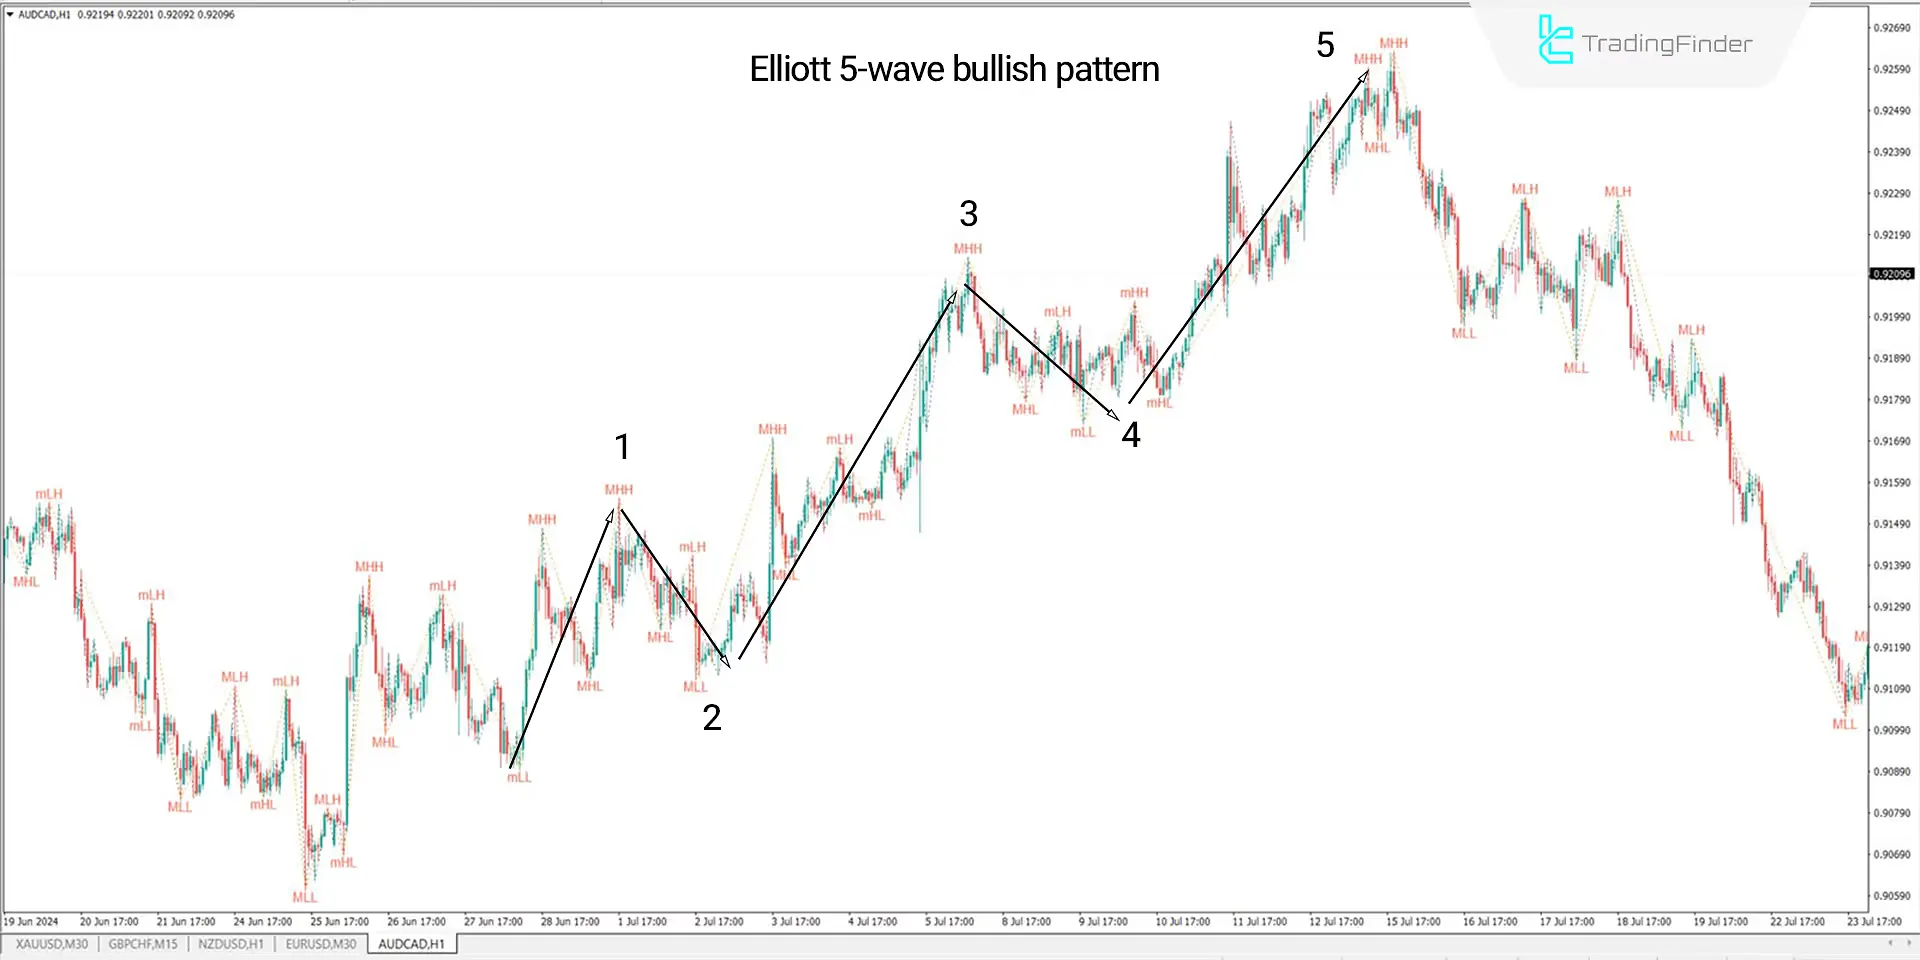
In the 1-hour AUD/CAD chart below, the ZigZag indicator helps recognize Elliott Waves, a key part of technical analysis. In this example, the indicator detects the major highs and lows, identifying the 5-wave bullish pattern.
Indicator Settings
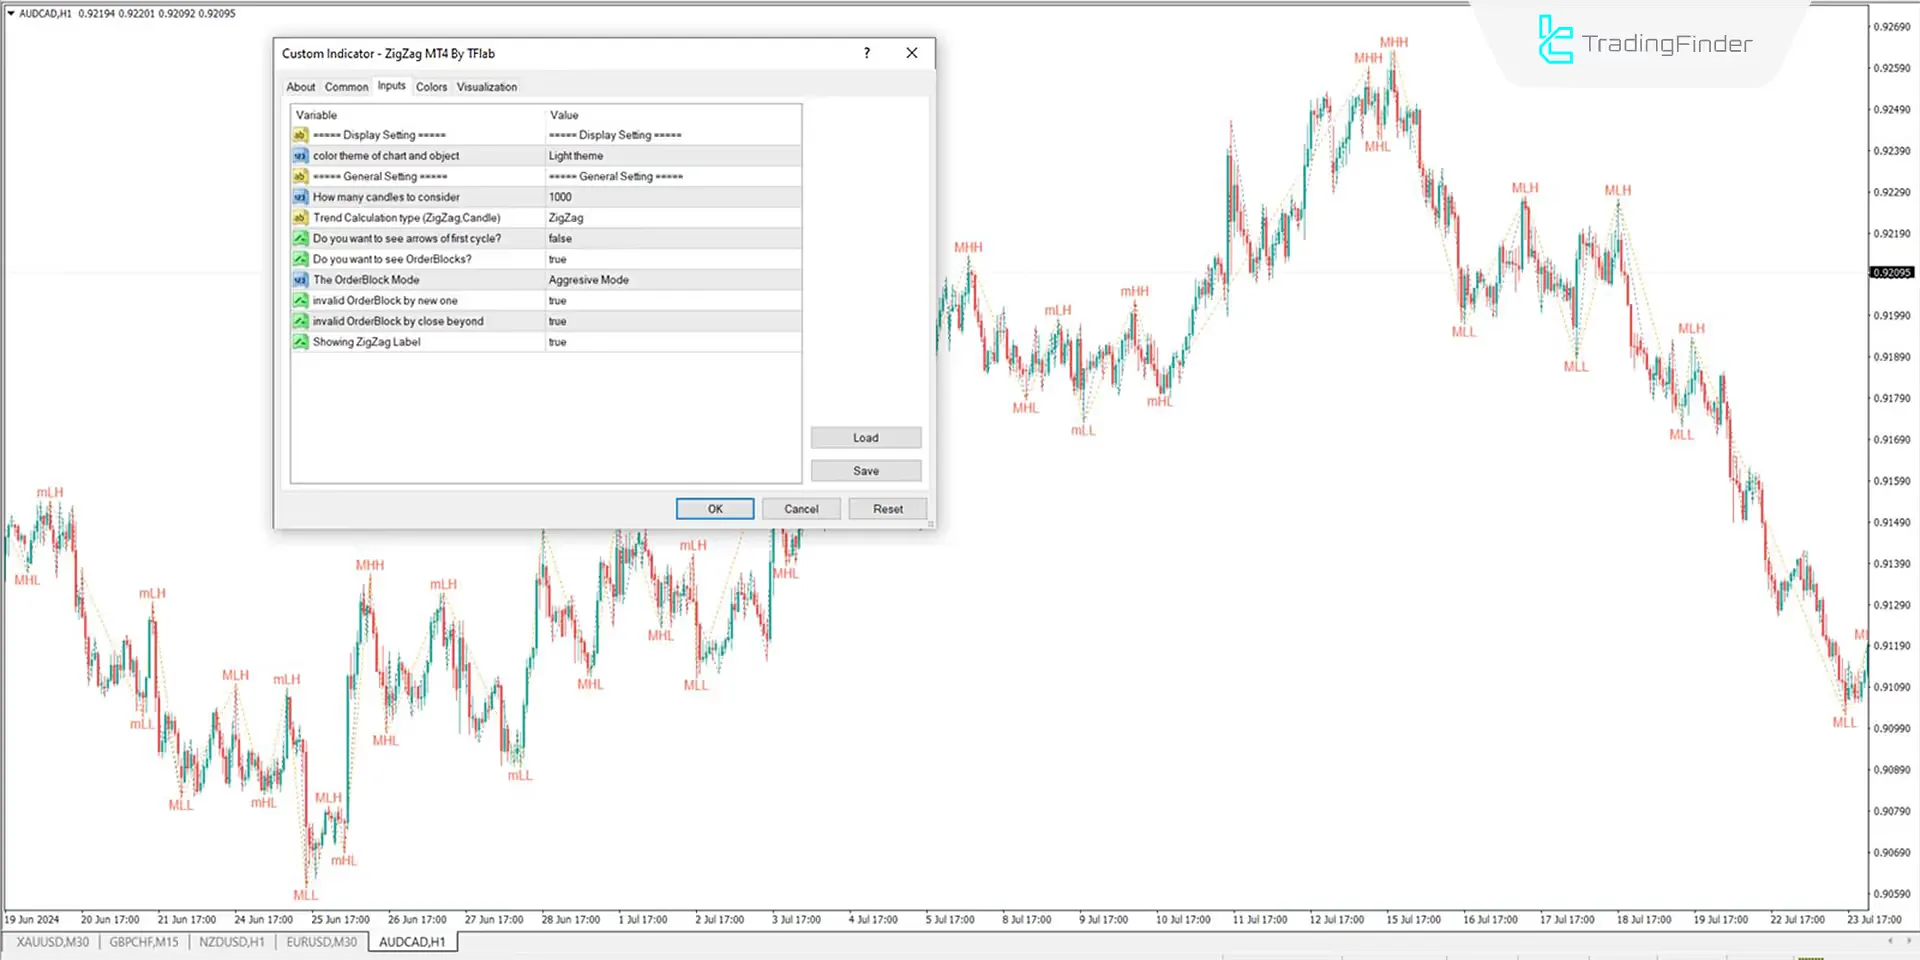
Display Setting
- Color theme of chart and object: Set the background theme to your preference.
General Setting
- How many candles to consider: The indicator uses 1000 candles for calculations.
- Trend Calculation type (ZigZag Candle): Trend calculations based on ZigZag candles.
- Do you want to see the arrows for the first cycle: Set to false if you don't want to display arrows.
- Do you want to see OrderBlocks: Set to true to display Order Blocks.
- The OrderBlock Mode: Set to Aggressive
- Invalid OrderBlock by new one: Create new Order Blocks.
- Invalid OrderBlock by close beyond Set to accurate to close beyond the Order Block.
- Showing ZigZag Label: Set to true to display the ZigZag label.
Conclusion
The ZigZag Indicator is valuable for detecting major and minor chart reversals. It can also help traders and analysts identify classic patterns and chart formations. The MT4 level indicator is easy to use, and traders of all skill levels can apply it in any market.
ZigZag with Labels indicator MT4 PDF
ZigZag with Labels indicator MT4 PDF
Click to download ZigZag with Labels indicator MT4 PDFWhat are the uses of the ZigZag Indicator?
The ZigZag indicator identifies highs and lows on the price chart, helping traders better recognize trends, patterns, and essential levels.
Which trading styles is the ZigZag Indicator suitable for?
This indicator is suitable for all trading strategies and helps traders understand chart reversals better.


