![Zone Indicator for MetaTrader 4 Download - Free - [Trading Finder]](https://cdn.tradingfinder.com/image/108327/11-31-en-zone-mt4.webp)
![Zone Indicator for MetaTrader 4 Download - Free - [Trading Finder] 0](https://cdn.tradingfinder.com/image/108327/11-31-en-zone-mt4.webp)
![Zone Indicator for MetaTrader 4 Download - Free - [Trading Finder] 1](https://cdn.tradingfinder.com/image/38500/11-31-en-zone-mt4-02.avif)
![Zone Indicator for MetaTrader 4 Download - Free - [Trading Finder] 2](https://cdn.tradingfinder.com/image/38501/11-31-en-zone-mt4-03.avif)
![Zone Indicator for MetaTrader 4 Download - Free - [Trading Finder] 3](https://cdn.tradingfinder.com/image/38502/11-31-en-zone-mt4-04.avif)
The Zone Indicator is one of the Technical analysis powerful tools in MetaTrader 4 that helps traders identify critical Support and Resistance levels based on past Price Action behavior. The MT4 Lenel indicator marks resistance zones with red boxes and support zones with green boxes.
These levels can be useful in identifying key reversal points for optimal Entry-Exit positions and setting Take-Profit and Stop-Loss levels. This indicator is particularly useful in all markets, especially those with high volatility, where price movements are fast and unpredictable.
Zone Indicator Table
Indicator Categories: | Price Action MT4 Indicators Supply & Demand MT4 Indicators Levels MT4 Indicators |
Platforms: | MetaTrader 4 Indicators |
Trading Skills: | Elementary |
Indicator Types: | Breakout MT4 Indicators Reversal MT4 Indicators |
Timeframe: | Multi-Timeframe MT4 Indicators |
Trading Style: | Day Trading MT4 Indicators Fast Scalper MT4 Indicators Scalper MT4 Indicators Swing Trading MT4 Indicators |
Trading Instruments: | Share Stocks MT4 Indicators Forward Market MT4 Indicators Indices Market MT4 Indicators Commodity Market MT4 Indicators Stock Market MT4 Indicators Cryptocurrency MT4 Indicators Forex MT4 Indicators |
Buy Conditions with the Indicator (Support Level)
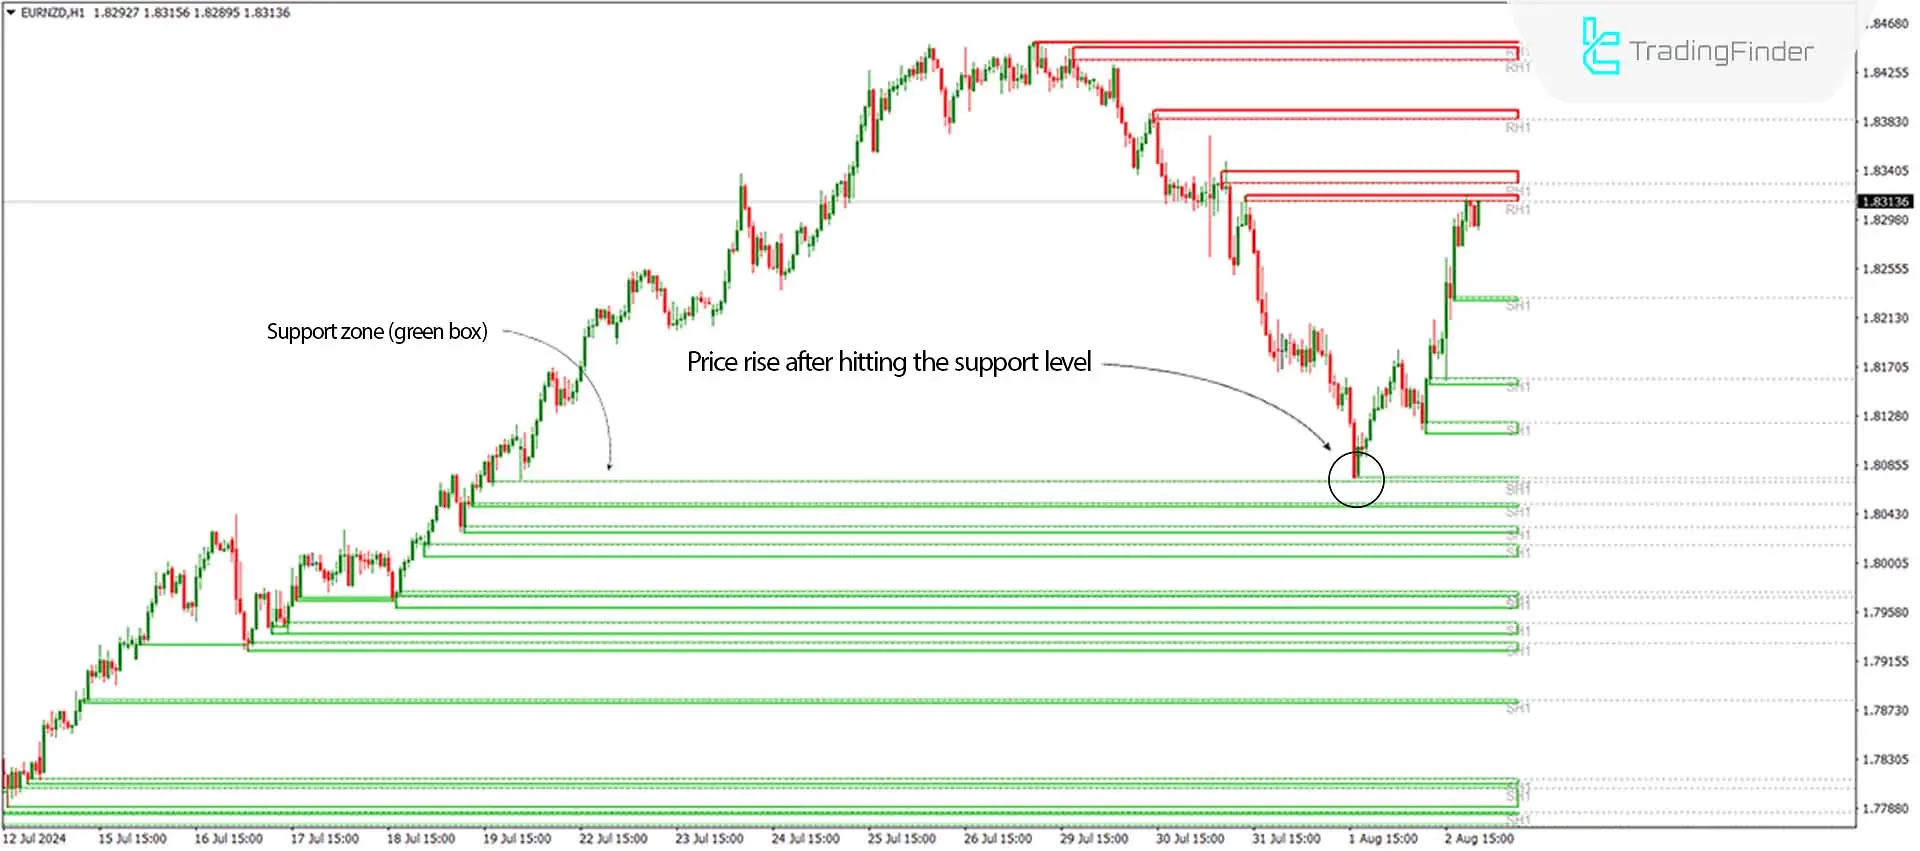
The image below shows the EUR/NZD currency pair chart in the 1-hour timeframe. After a downward trend, on August 1st, the price reached the green box (SH1) drawn by the indicator at 1.8085. This zone acted as support, and after hitting it, the price bounced back up.
Traders could look for reversal confirmations, such as candlestick or classic reversal patterns, to enter buy positions in the marked area.

Sell Conditions with the Indicator (Resistance Level)
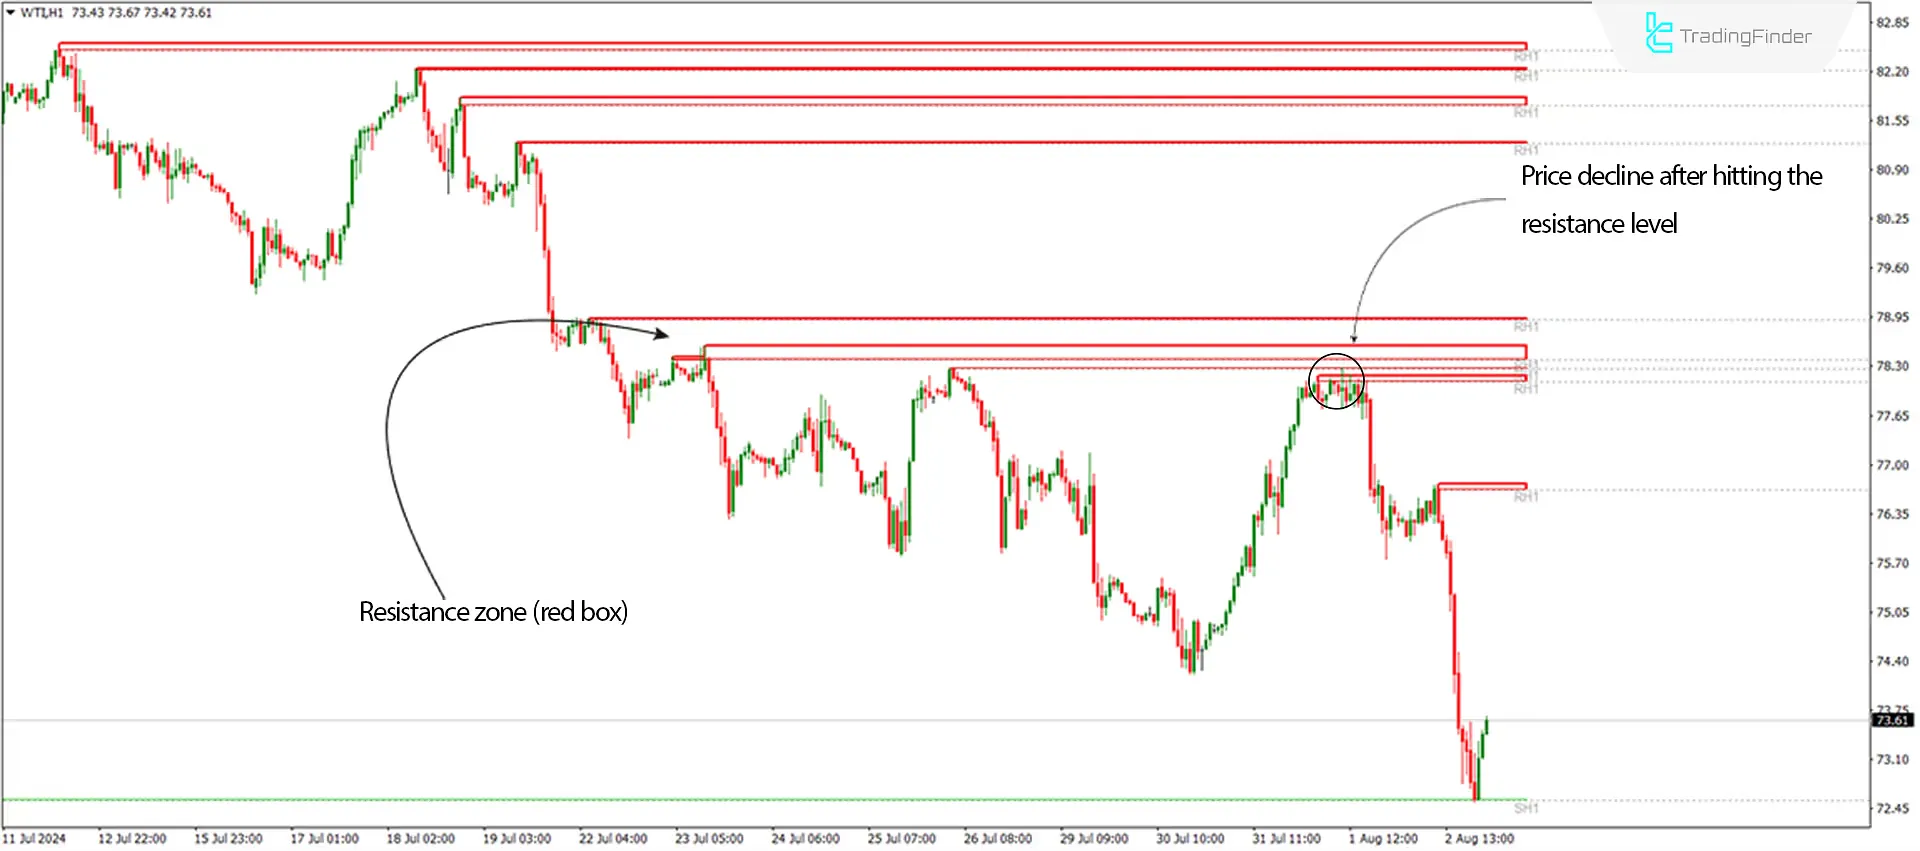
The image below shows the WTI oil price chart in the 1-hour timeframe. On August 1st, after an upward move, the price reached the red box (RH1) drawn by the indicator at $78.30.
This zone acted as resistance, and after hitting it, the price dropped. Traders could look for reversal confirmations like candlesticks or classic reversal patterns to enter sell positions in the marked area.

Zone Indicator Settings

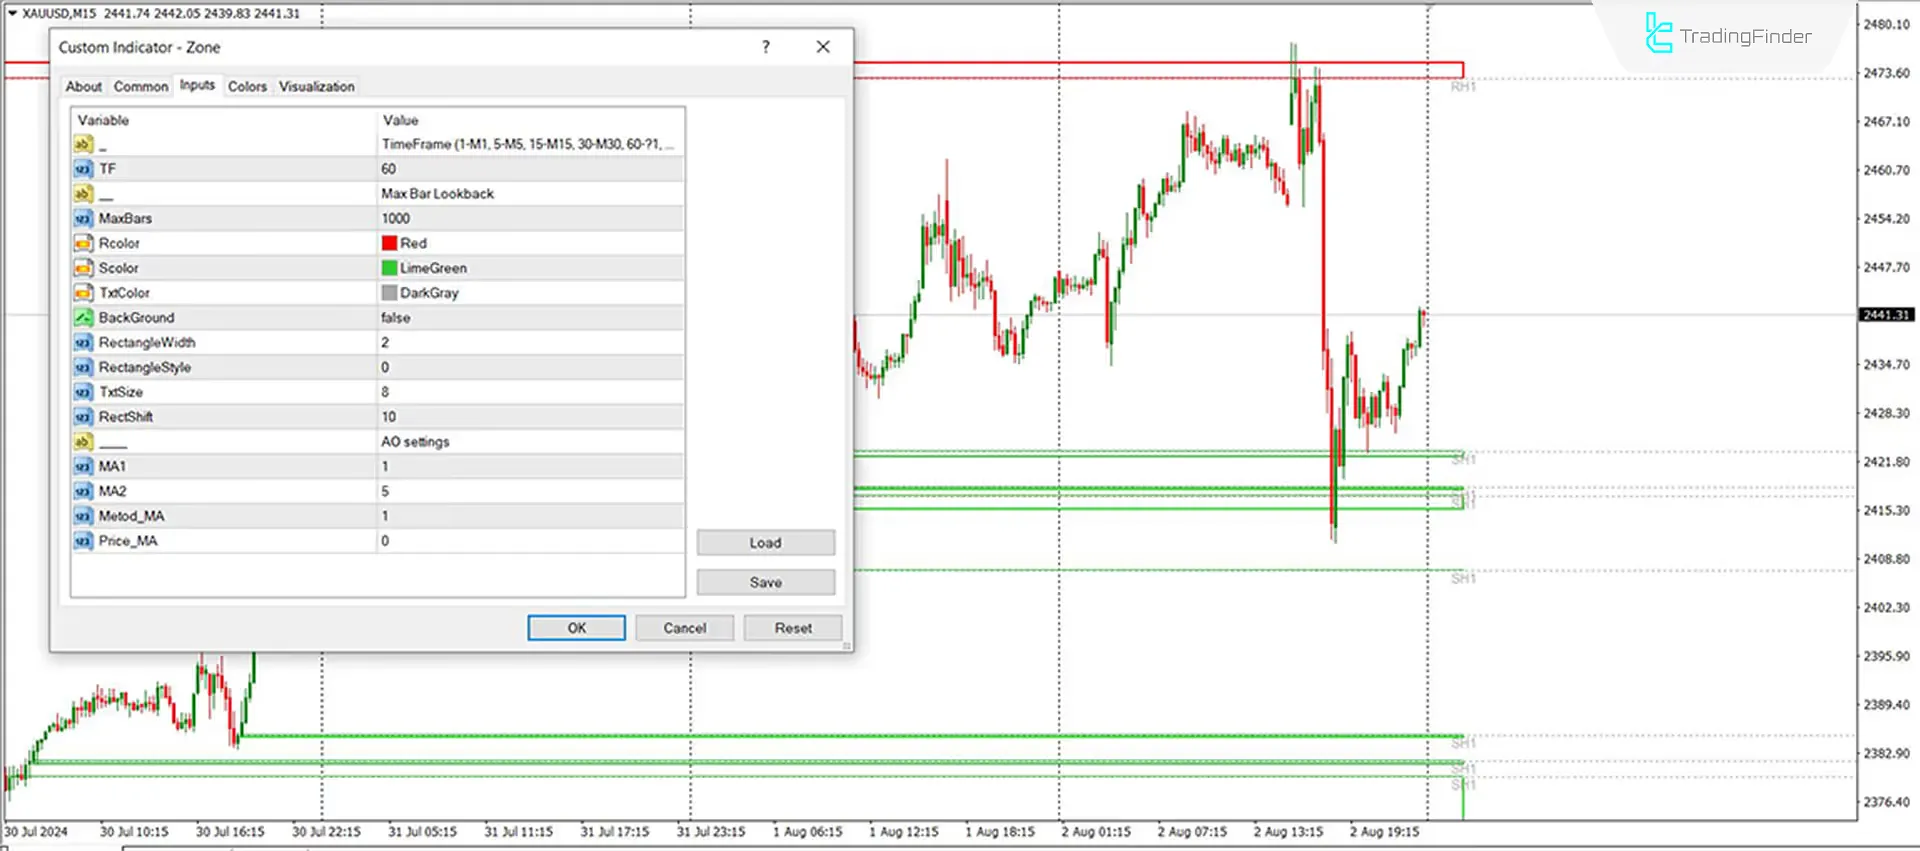
- Timeframe: The default timeframe setting is 60, which means 1 hour.
- Max Bar Lookback: The maximum number of bars for calculation is 1000.
- Rcolor The color of the resistance box is red.
- Color: The color of the support box is green.
- TxtColor: The text color is set to gray.
- Background Set to false for hollow boxes.
- RectangleWidth: The width of the boxes is set to 2.
- RectangleStyle The box line style is set to 0.
- TxtSize Text size is set to 8.
- RectShift The box shift size to the right of the chart is set to 10.
- AO settings Oscillator settings
- MA1 The first moving average is set to 1.
- MA2 The second moving average is set to 5.
- The Metod_MA Moving average method is set to Exponential (1).
- Price MA Calculations are based on closing price (Close).
Conclusion
The Zone Indicator is an essential technical analysis tool. It automatically marks Support and Resistance levels on the chart without needing to be manually analyzed. Traders can use this MetaTrader4 indicator alongside other technical indicators like Moving Averages, RSI, Bollinger Bands, and Fundamental Analysis to confirm signals and improve trading accuracy.
Zone MT4 PDF
Zone MT4 PDF
Click to download Zone MT4 PDFIs the Zone Indicator applicable to all markets?
Since every price chart has support and resistance levels, this indicator can be used in various markets, including Forex, Stocks, and Commodities.
Does the Zone Indicator give buy and sell signals on its own?
Yes, but using it alongside other technical and fundamental analysis tools is recommended to increase prediction accuracy.


