![ZP Day Trading Indicator in MT4 Download - Free - [TradingFinder]](https://cdn.tradingfinder.com/image/180416/13-52-en-zp-day-trading-mt4-1.webp)
![ZP Day Trading Indicator in MT4 Download - Free - [TradingFinder] 0](https://cdn.tradingfinder.com/image/180416/13-52-en-zp-day-trading-mt4-1.webp)
![ZP Day Trading Indicator in MT4 Download - Free - [TradingFinder] 1](https://cdn.tradingfinder.com/image/180418/13-52-en-zp-day-trading-mt4-2.webp)
![ZP Day Trading Indicator in MT4 Download - Free - [TradingFinder] 2](https://cdn.tradingfinder.com/image/180417/13-52-en-zp-day-trading-mt4-3.webp)
![ZP Day Trading Indicator in MT4 Download - Free - [TradingFinder] 3](https://cdn.tradingfinder.com/image/180419/13-52-en-zp-day-trading-mt4-4.webp)
The ZP Day Trading Indicator identifies price range zones and displays them using colored boxes on the chart. Price fluctuations within a defined area, between a support and resistance zone, form the trading range zone.
This indicator is developed based on the Price Action trading style and, besides marking the zones, provides entry signals for trades.
ZP Day Trading Indicator Specifications
The table below provides an overview of the main specifications of the indicator:
Indicator Categories: | Price Action MT4 Indicators Signal & Forecast MT4 Indicators Trading Assist MT4 Indicators |
Platforms: | MetaTrader 4 Indicators |
Trading Skills: | Elementary |
Indicator Types: | Range MT4 Indicators Breakout MT4 Indicators Reversal MT4 Indicators |
Timeframe: | Multi-Timeframe MT4 Indicators |
Trading Style: | Day Trading MT4 Indicators Scalper MT4 Indicators Swing Trading MT4 Indicators |
Trading Instruments: | Share Stocks MT4 Indicators Indices Market MT4 Indicators Commodity Market MT4 Indicators Stock Market MT4 Indicators Cryptocurrency MT4 Indicators Forex MT4 Indicators |
Overview of the Indicator
Trading Range zones represent price consolidation areas where there is balance between buyers and sellers. Therefore, the price breaks through and exits these zones with strength and momentum. This indicator detects price breakouts from marked zones and uses arrow indicators to signal trade entries.
Buy Signal in an Uptrend
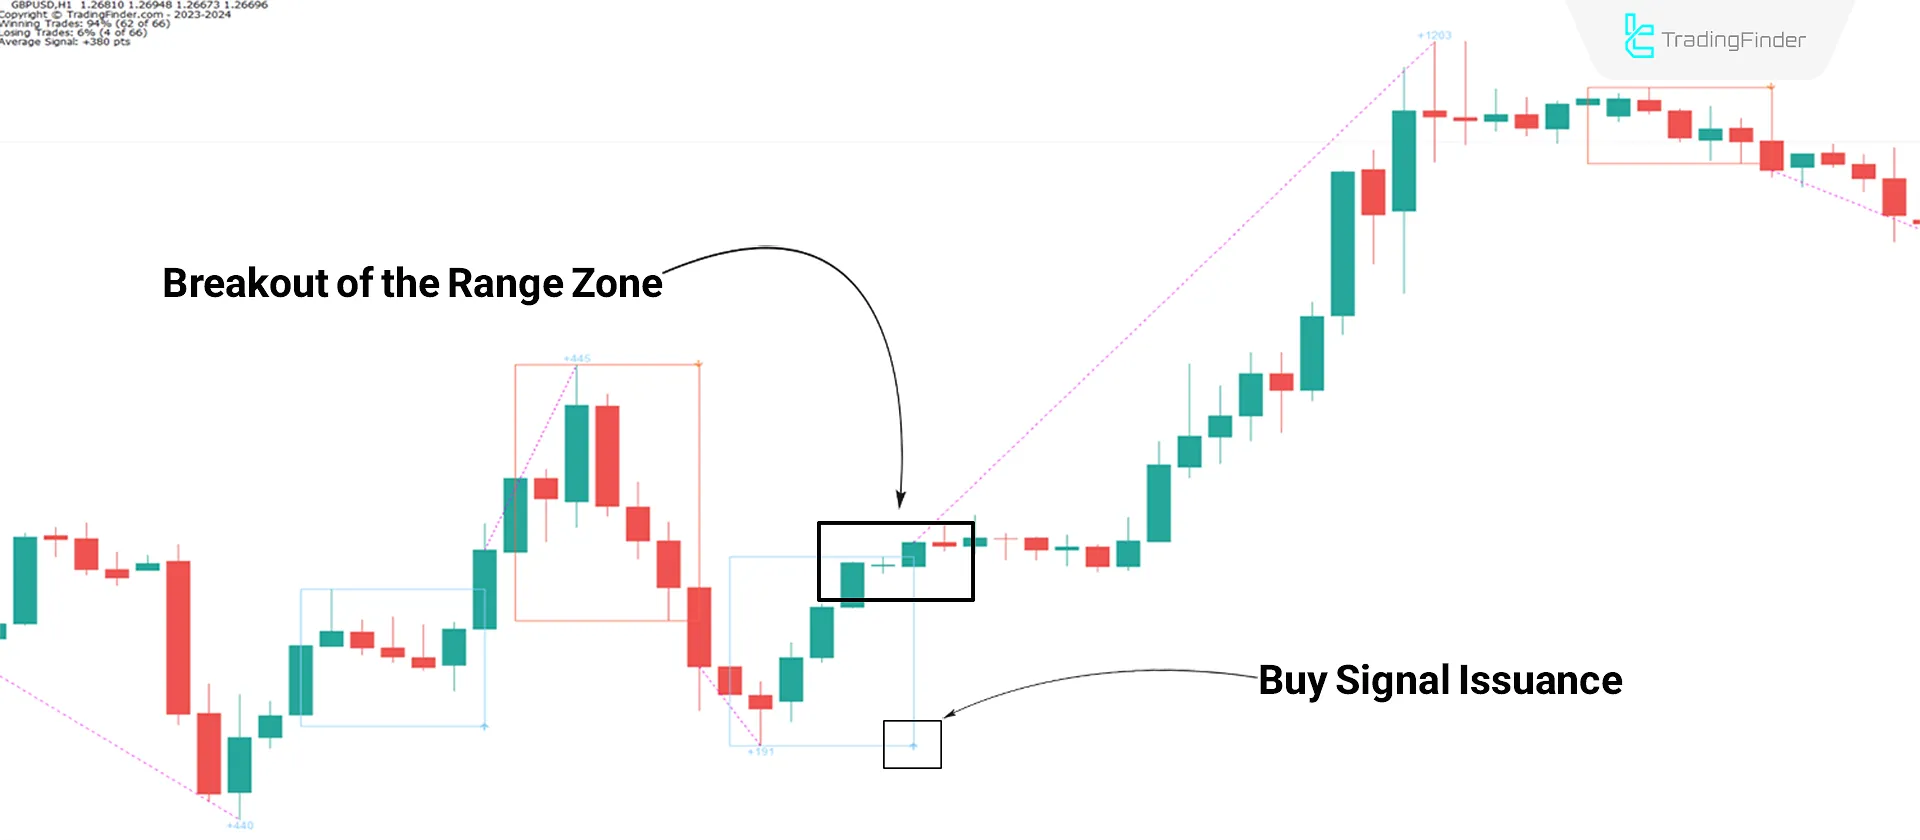
When the price breaks above the range zone, the indicator highlights the area with a blue box and generates a buy signal with a light blue arrow.
The chart of the GBP/USD currency pair on a 1-hour timeframe demonstrates the indicator's functionality during an uptrend.

Sell Signal in a Downtrend
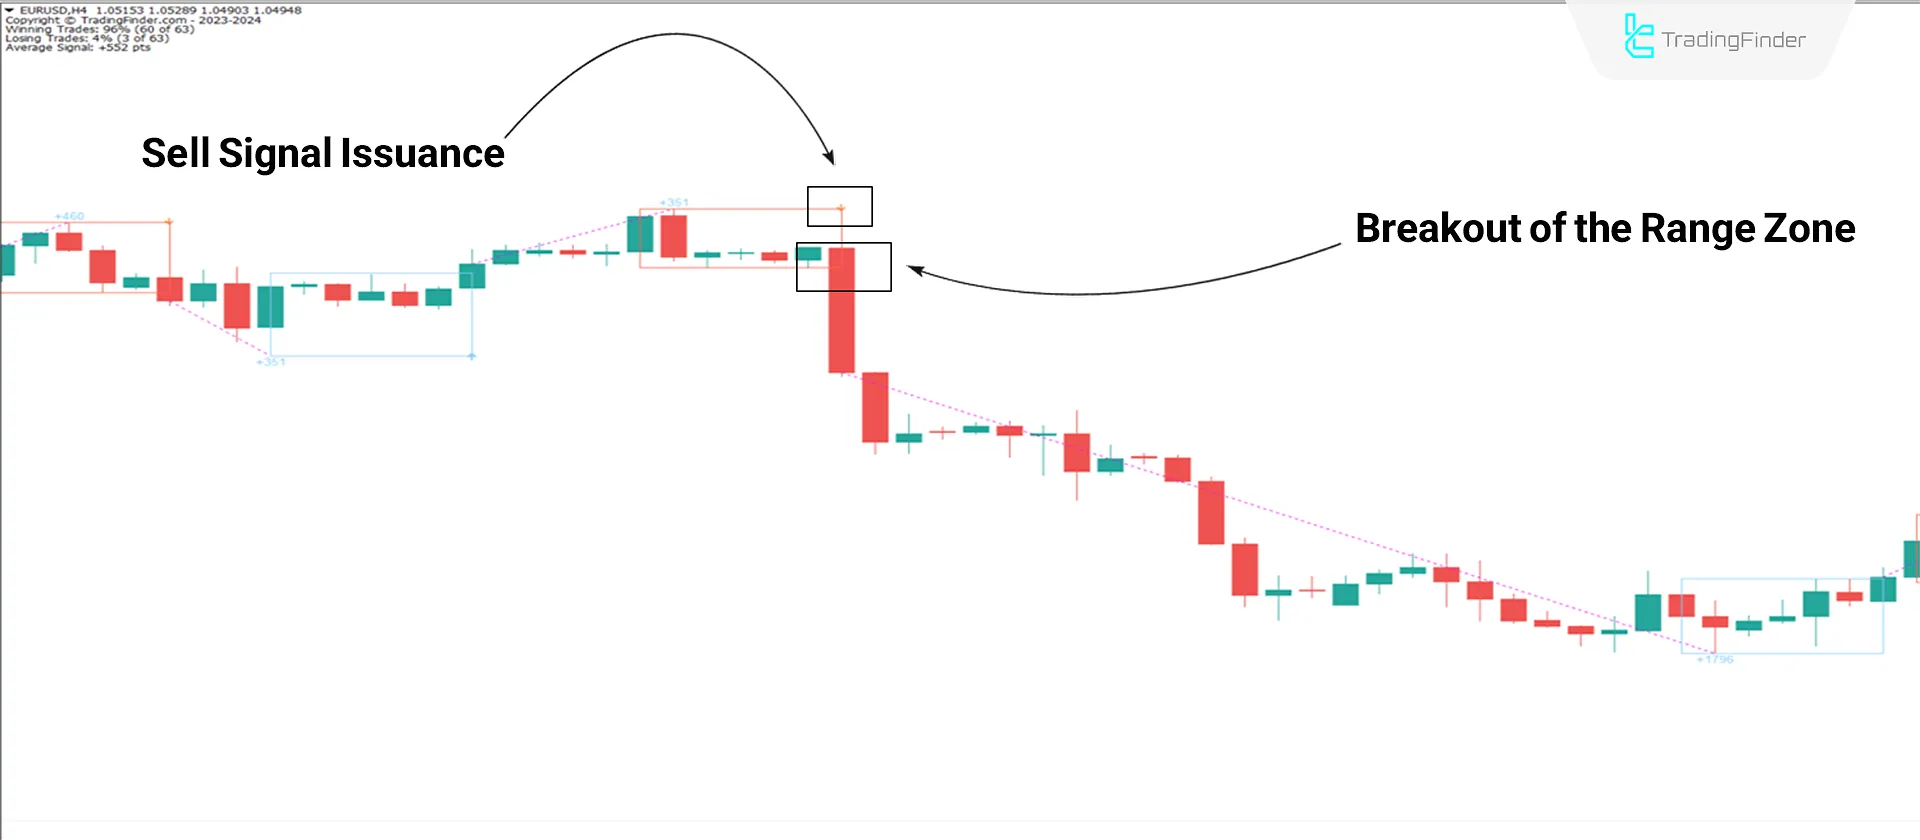
Based on the price chart analysis of the EUR/USD currency pair on a 4-hour timeframe, when the price breaks below the range zone, the indicator marks the area with a red box and issues a sell signal using a red arrow.

ZP Day Trading Indicator Settings
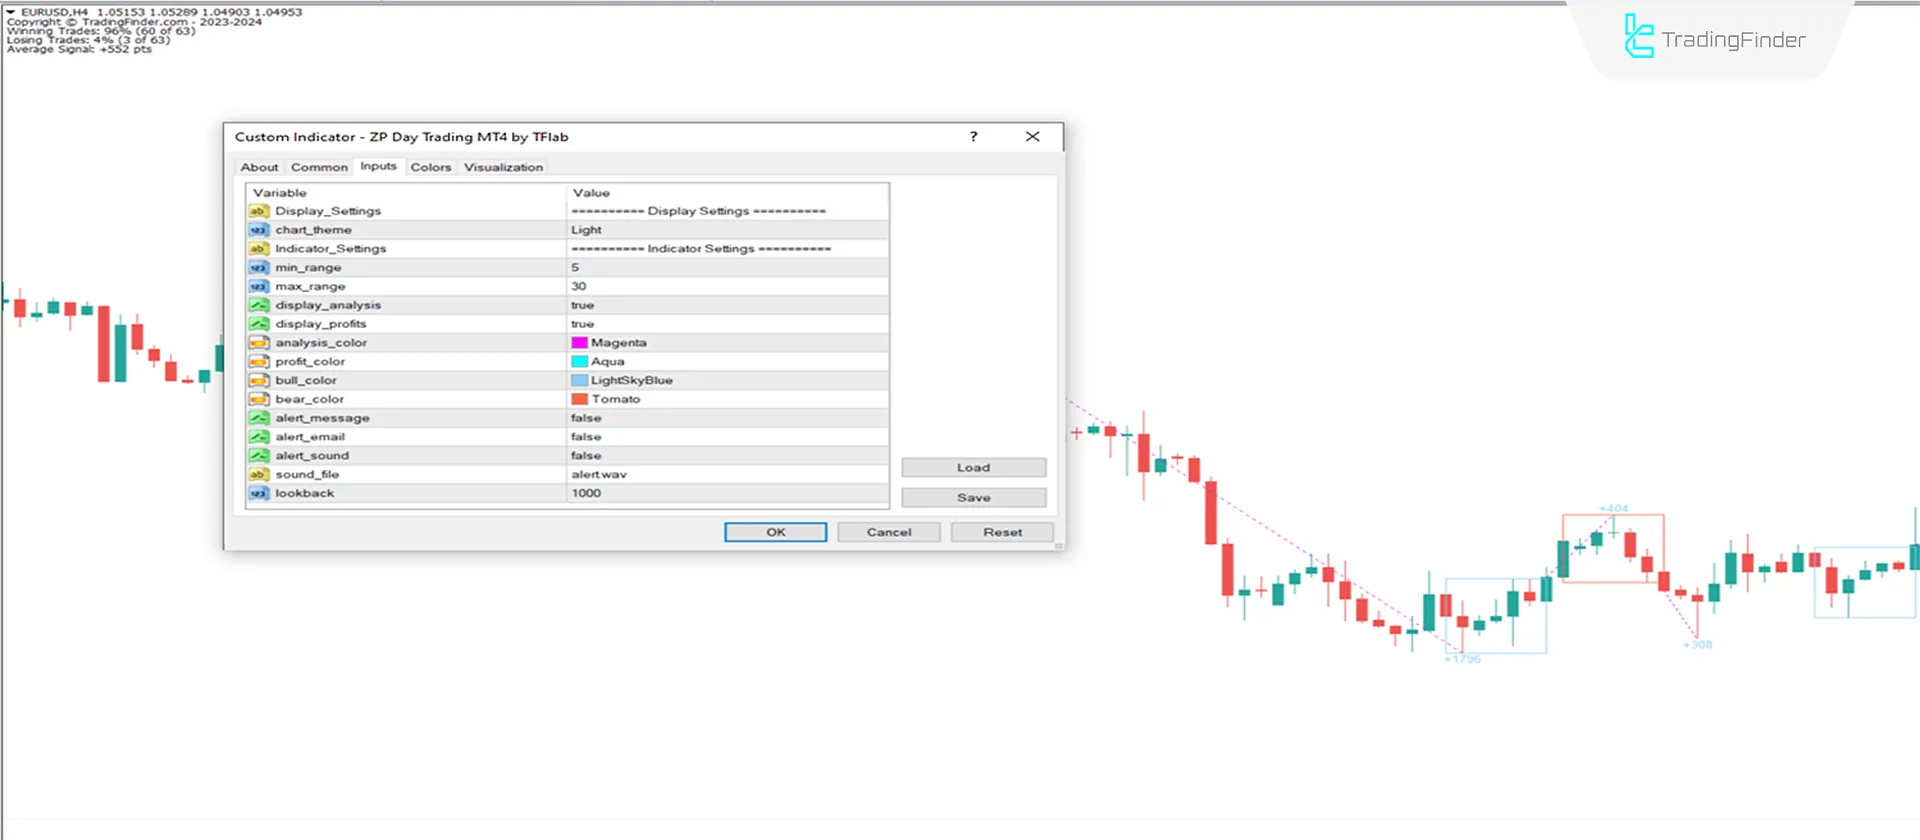
This section includes options for modifying the display parameters of the tool:

- Chart theme: Indicator theme;
- Min range: Minimum range for data analysis; default value 5
- Max range: Maximum range for data analysis; default value 30
- Display analysis: Show analytical information on the chart
- Display profits: Display profit and loss amounts on the chart
- Analysis color: Color for the displayed analytical insights on the chart
- Profits color: Color representing profit
- Bull color: Color for bullish boxes
- Bear color: Color for bearish boxes
- Alert message: Alert with a message
- Alert email: Alert via email
- Alert sound: Sound alert
- Look back: Number of candles analyzed for calculations; default 1000
Conclusion
The ZP Day Trading Indicator identifies accumulation zones and balance areas between buyers and sellers, known as range zones, on the chart and provides signals for trade entries.
This indicator is designed based on the Price Action trading style and can be used across all markets.
ZP Day Trading MT4 PDF
ZP Day Trading MT4 PDF
Click to download ZP Day Trading MT4 PDFDoes using this indicator require specific skill levels?
No, this indicator is suitable for traders of all skill levels.
Can the settings of this indicator be customized?
Yes, the settings of the "ZP" indicator are fully customizable.


