


![1-2-3 Pattern Indicator for MetaTrader 5 Download - Free - [TFlab]](https://cdn.tradingfinder.com/image/273832/4-54-en-1-2-3-pattern-mt5-1.webp)
![1-2-3 Pattern Indicator for MetaTrader 5 Download - Free - [TFlab] 1](https://cdn.tradingfinder.com/image/273833/4-54-en-1-2-3-pattern-mt5-3.webp)
![1-2-3 Pattern Indicator for MetaTrader 5 Download - Free - [TFlab] 2](https://cdn.tradingfinder.com/image/273834/4-54-en-1-2-3-pattern-mt5-2.webp)
![1-2-3 Pattern Indicator for MetaTrader 5 Download - Free - [TFlab] 3](https://cdn.tradingfinder.com/image/273835/4-54-en-1-2-3-pattern-mt5-4.webp)
The 1-2-3 Pattern Indicator is one of the MetaTrader 5 indicators that can be used to identify reversal points.
This tool detects three key pivots and draws ZigZag Lines, clearly displaying price movement trends and generating Fibonacci Levels based on key points.
1-2-3 Pattern Indicator Specifications Table
The table below presents the features of the 1-2-3 Pattern Indicator.
Indicator Categories: | Trading Assist MT5 Indicators Risk Management MT5 Indicators Levels MT5 Indicators |
Platforms: | MetaTrader 5 Indicators |
Trading Skills: | Intermediate |
Indicator Types: | Range MT5 Indicators Reversal MT5 Indicators |
Timeframe: | Multi-Timeframe MT5 Indicators |
Trading Style: | Intraday MT5 Indicators |
Trading Instruments: | Forex MT5 Indicators Crypto MT5 Indicators Stock MT5 Indicators Forward MT5 Indicators |
Indicator at a Glance
The 1-2-3 Pattern Indicator determines entry and exit zones for trades.
Traders can rely on Fibonacci levels to identify the best entry points.
This method determines price targets using Fibonacci points, while the stop-loss is placed near the zero Fibonacci level.
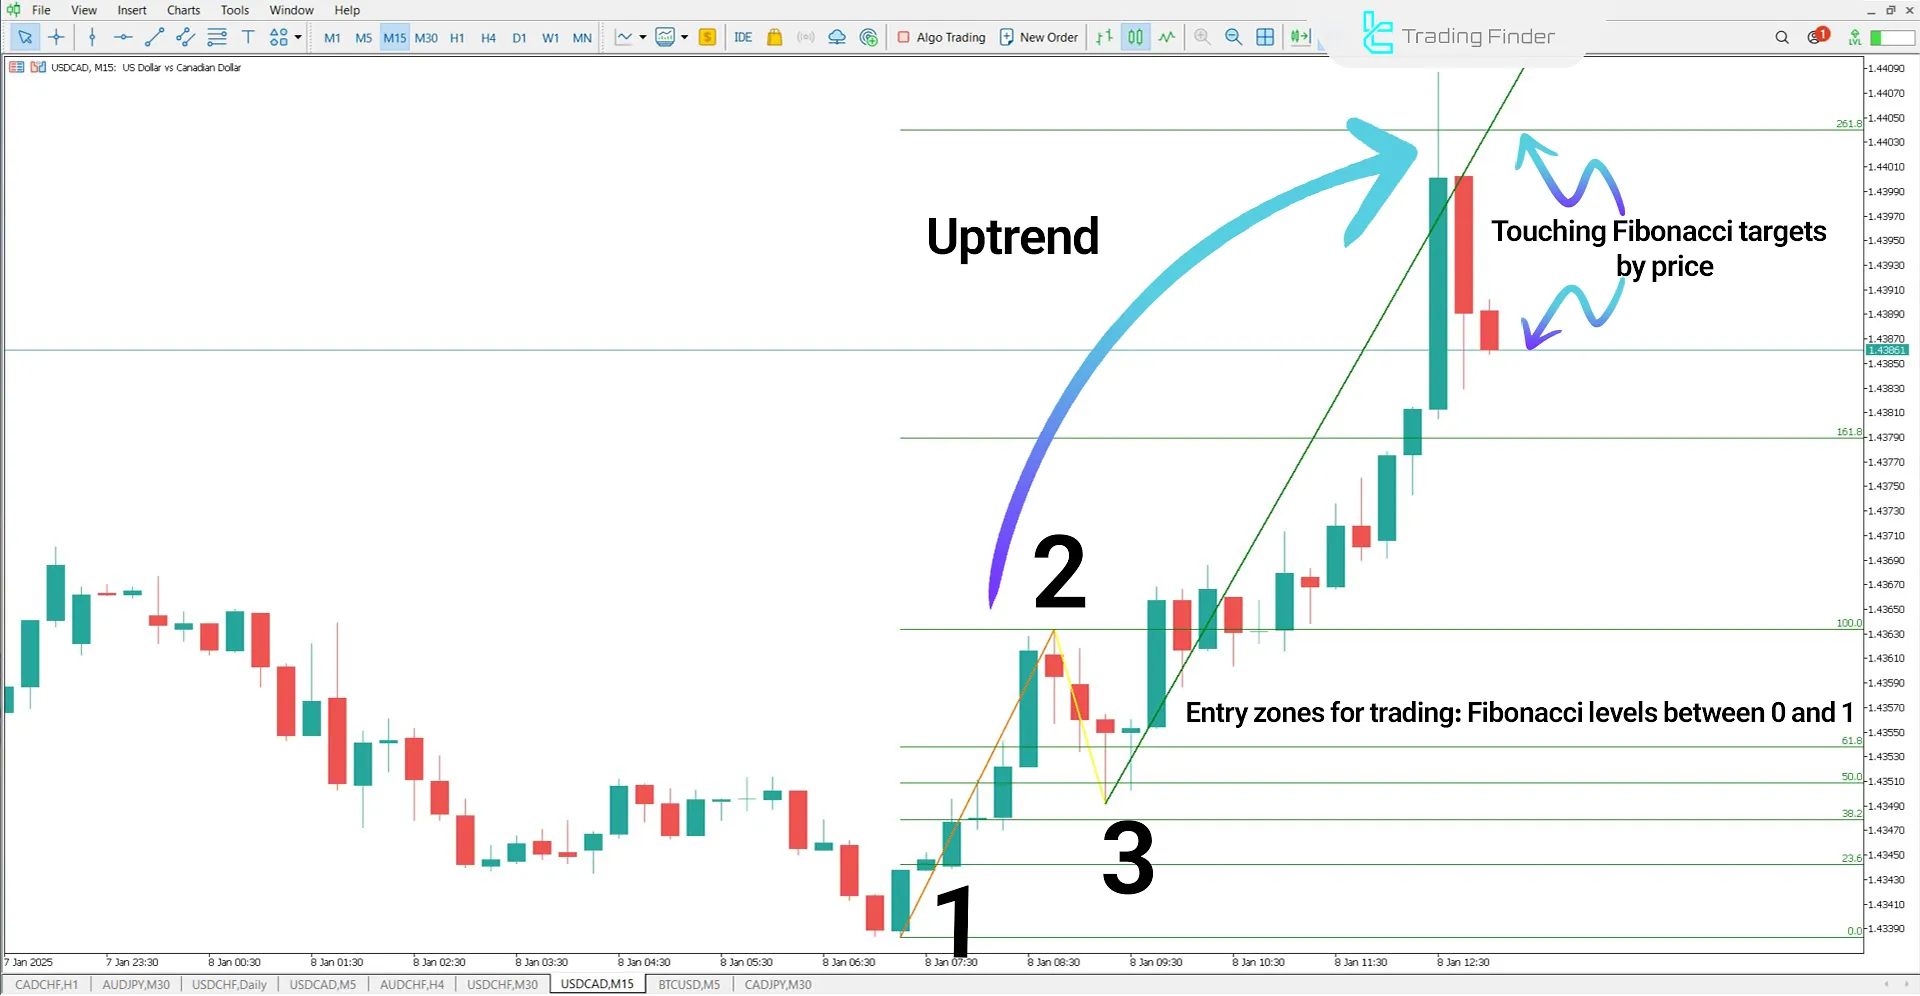
Indicator in an Uptrend
Based on the USD/CAD currency pair chart, two ascending points are automatically plotted on the first two pivots after identifying three main pivots using the indicator.
Traders can enter a buy position between levels 0 and 1, using Fibonacci levels as price targets.
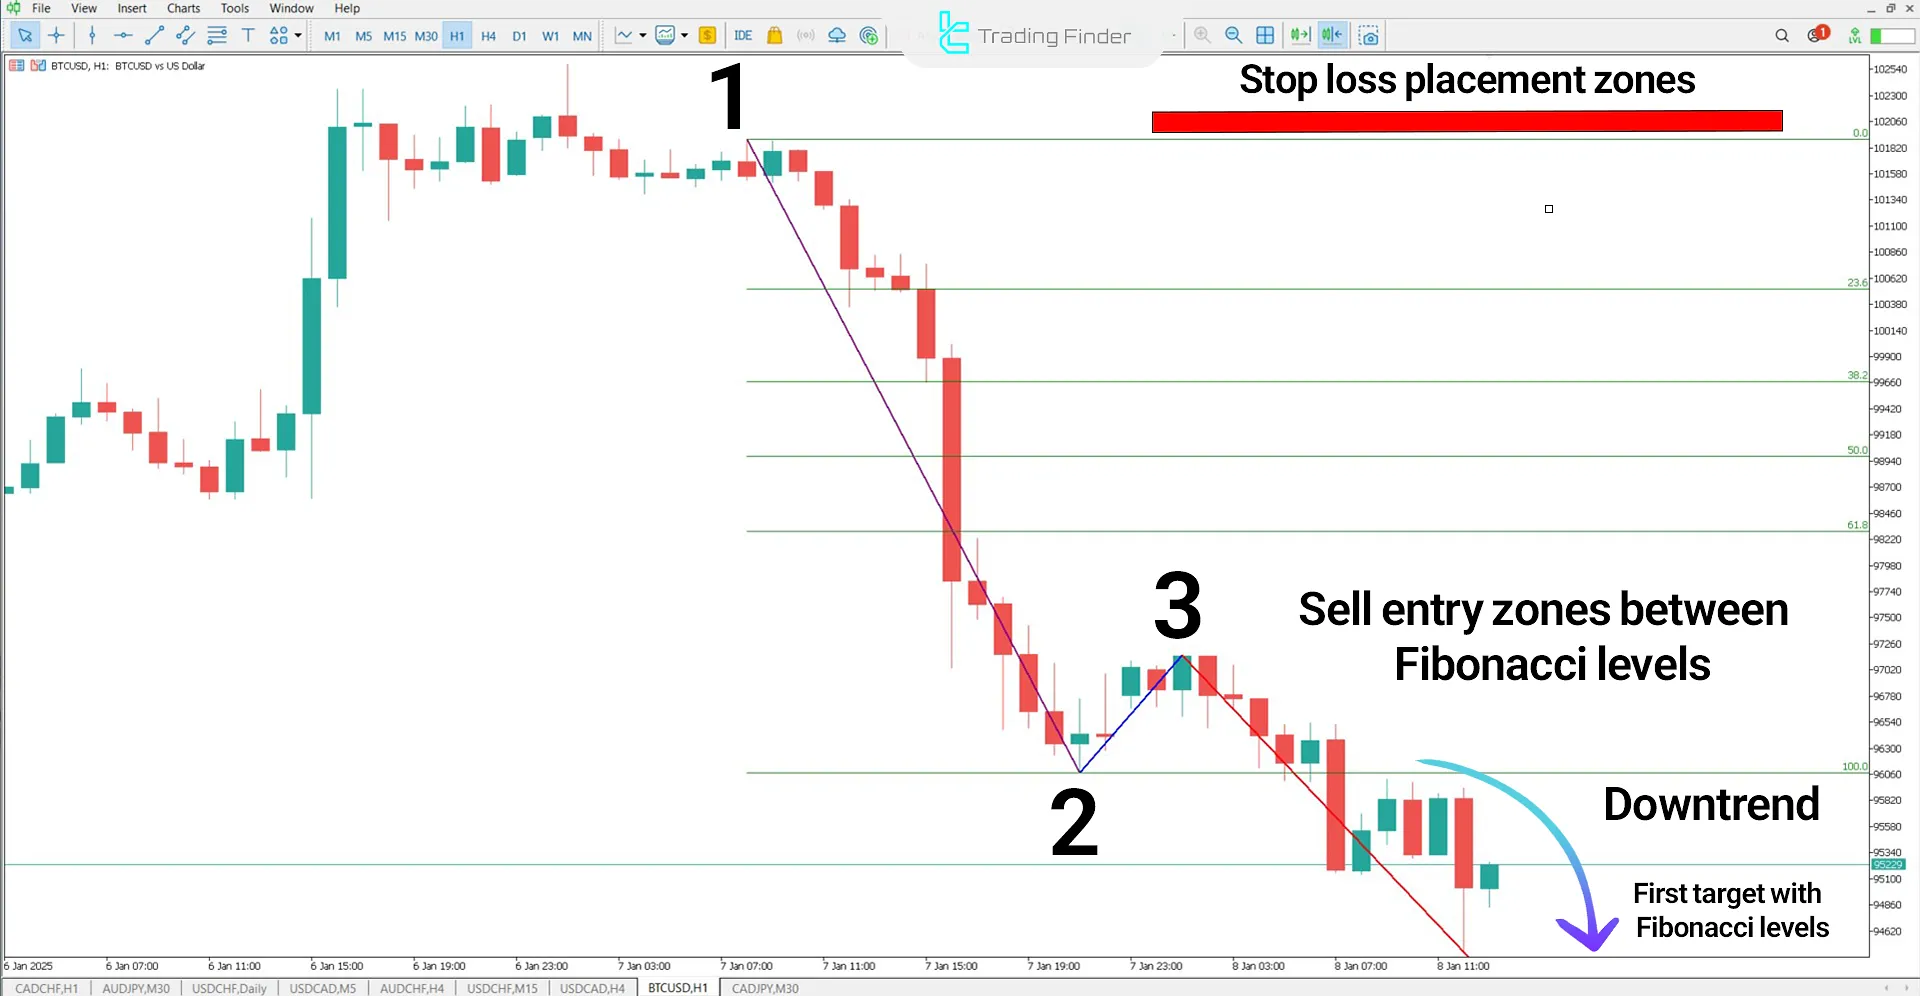
Indicator in a Downtrend
After detecting three main pivots in a downtrend, the Fibonacci indicator draws a descending Fibonacci retracement on the first two points.
Depending on their trading strategy, traders can place stop-loss levels above the zero area and enter sell positions between 0 and 1 Fibonacci level.
Indicator Settings
The settings of the 1-2-3 Pattern Indicator are displayed in the image below:
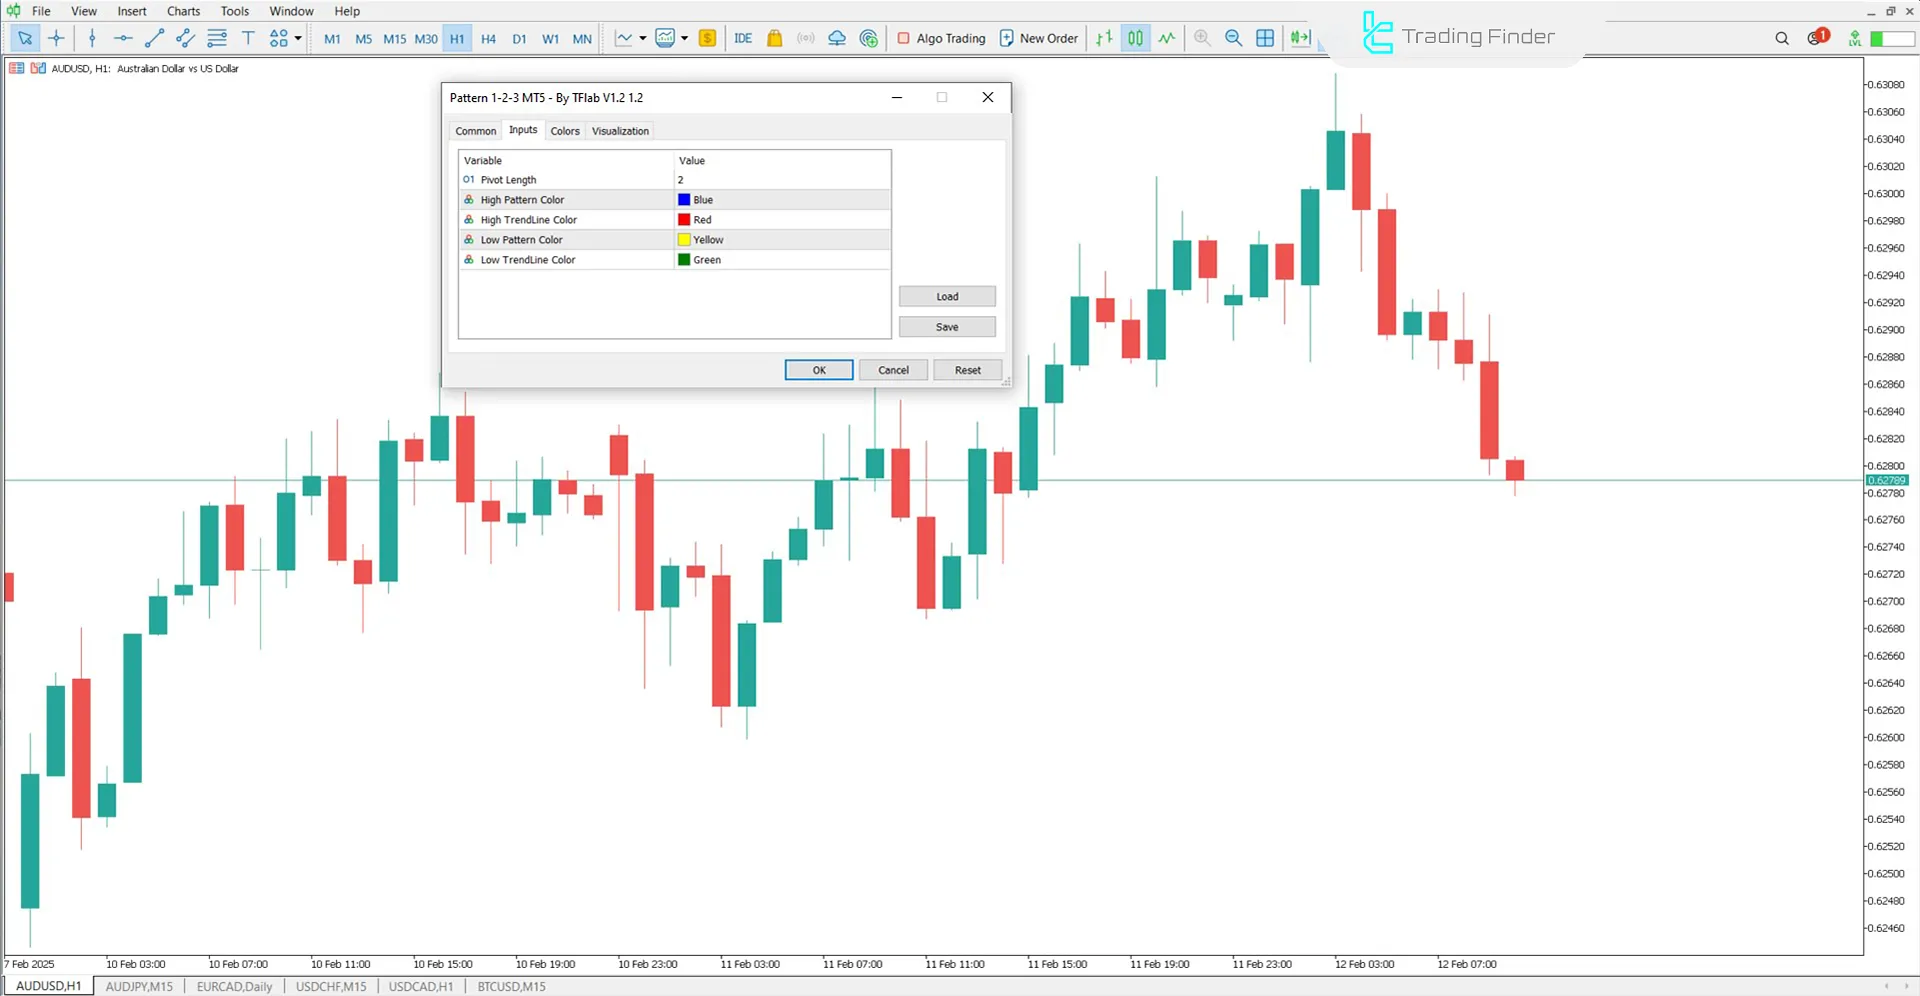
- Pivot Length: Pivot length
- High Pattern Color: High pattern color
- High TrendLine Color: High trendline color
- Low Pattern Color: Low pattern color
- Low TrendLine Color: Low trendline color
Conclusion
This Risk Management MT5 Indicator [1-2-3 Pattern], with its simple yet effective structure, is used for trend reversal detection and is recognized as a suitable tool for traders of all levels.
This indicator enhances analysis accuracy and reduces trade risk by identifying entry and exit points.
1-2-3 Pattern MT5 PDF
1-2-3 Pattern MT5 PDF
Click to download 1-2-3 Pattern MT5 PDFHow is the stop-loss set in the 1-2-3 Pattern Indicator?
In uptrend and downtrend trades, the stop-loss is placed near the zero Fibonacci level to ensure optimal risk management.
How can the 1-2-3 Pattern Indicator be used in an uptrend?
After detecting three key pivots in an uptrend, the indicator plots two ascending points on the first two pivots.


