


On July 2, 2025, in version 2, alert/notification and signal functionality was added to this indicator
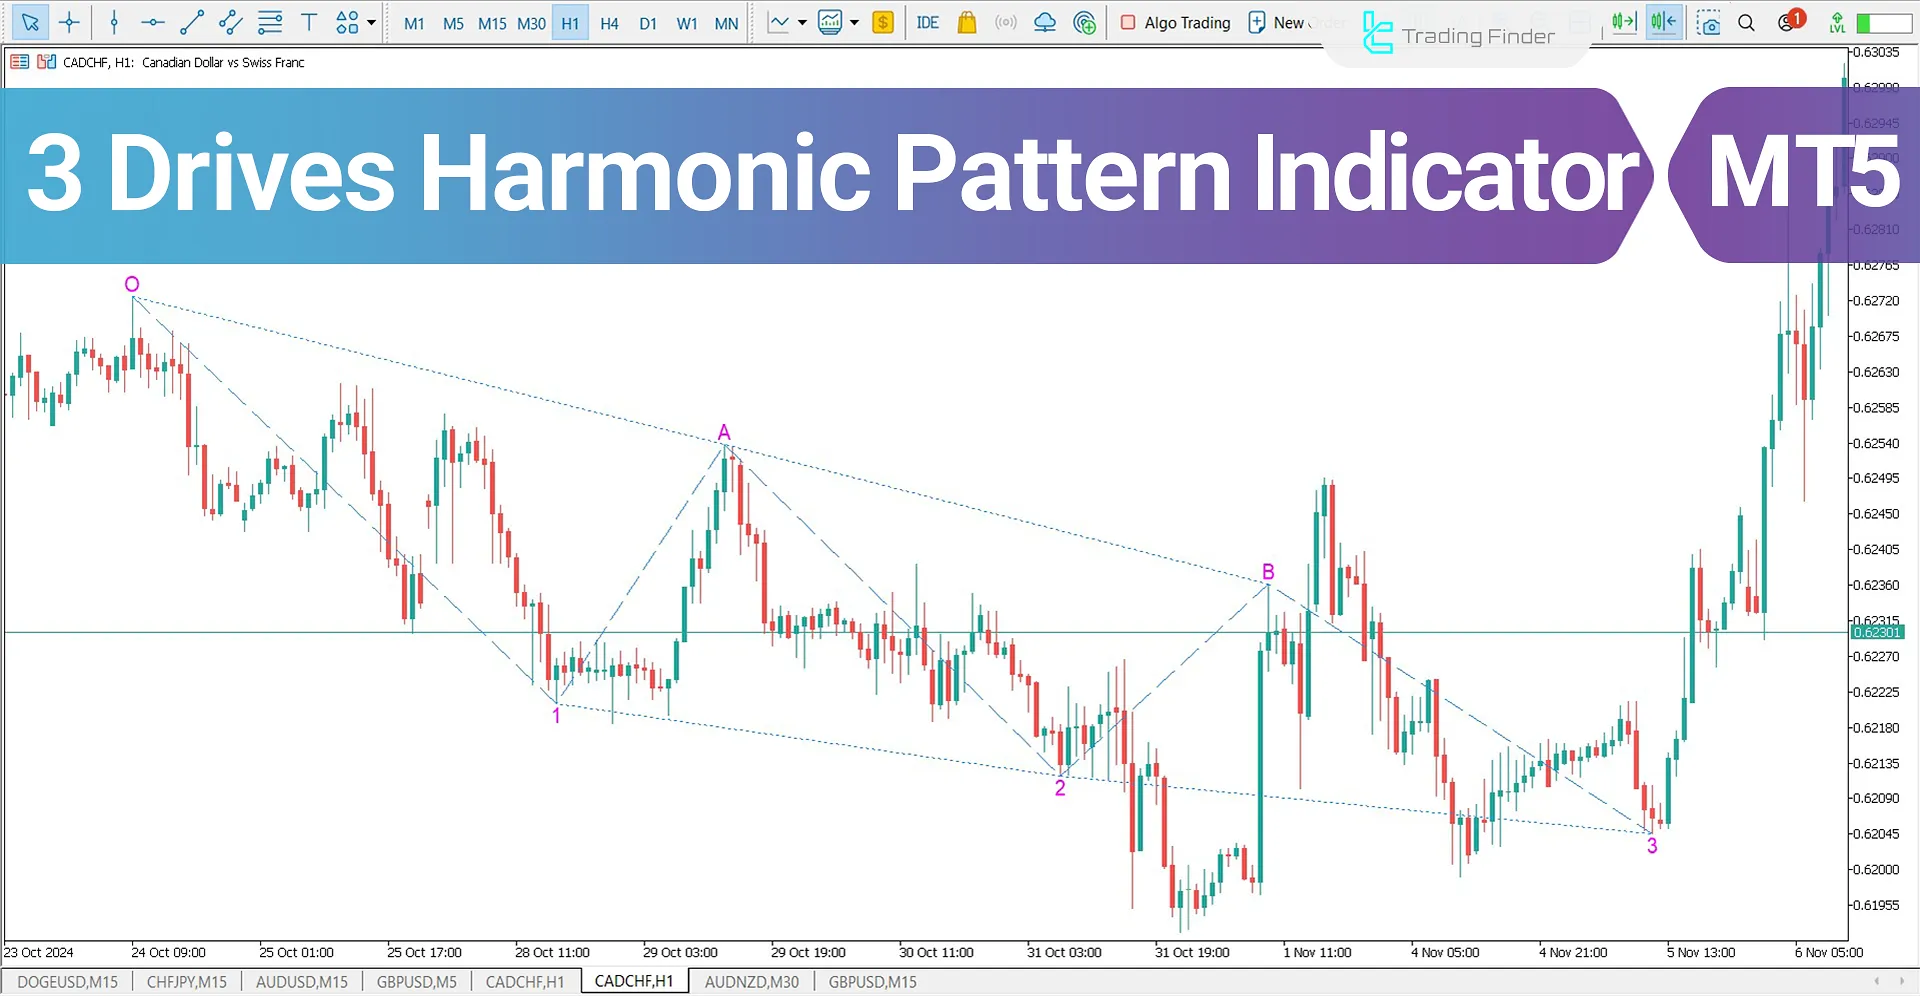
The Three Drives Harmonic Pattern Indicator is a technical analysis tool that shares similarities with the ABCD pattern and falls into the classic chart patterns and indicators category. This trading tool is designed to identify potential reversal zones (PRZ) and is one of the tools available on MetaTrader 5 indicators.
This pattern can form in both bullish and bearish conditions:
- In a bullish trend, The three main price moves are downward, indicating a potential reversal to the upside
- In a bearish trend, The three main price moves are upward, indicating a potential reversal to the downside
Three Drives Harmonic Pattern Indicator Table
The table below includes detailed information about the Three Drives Harmonic Pattern Indicator.
Indicator Categories: | Support & Resistance MT5 Indicators Chart & Classic MT5 Indicators Harmonic MT5 Indicators |
Platforms: | MetaTrader 5 Indicators |
Trading Skills: | Intermediate |
Indicator Types: | Reversal MT5 Indicators |
Timeframe: | Multi-Timeframe MT5 Indicators |
Trading Style: | Intraday MT5 Indicators |
Trading Instruments: | Forex MT5 Indicators Crypto MT5 Indicators Stock MT5 Indicators Forward MT5 Indicators Share Stock MT5 Indicators |
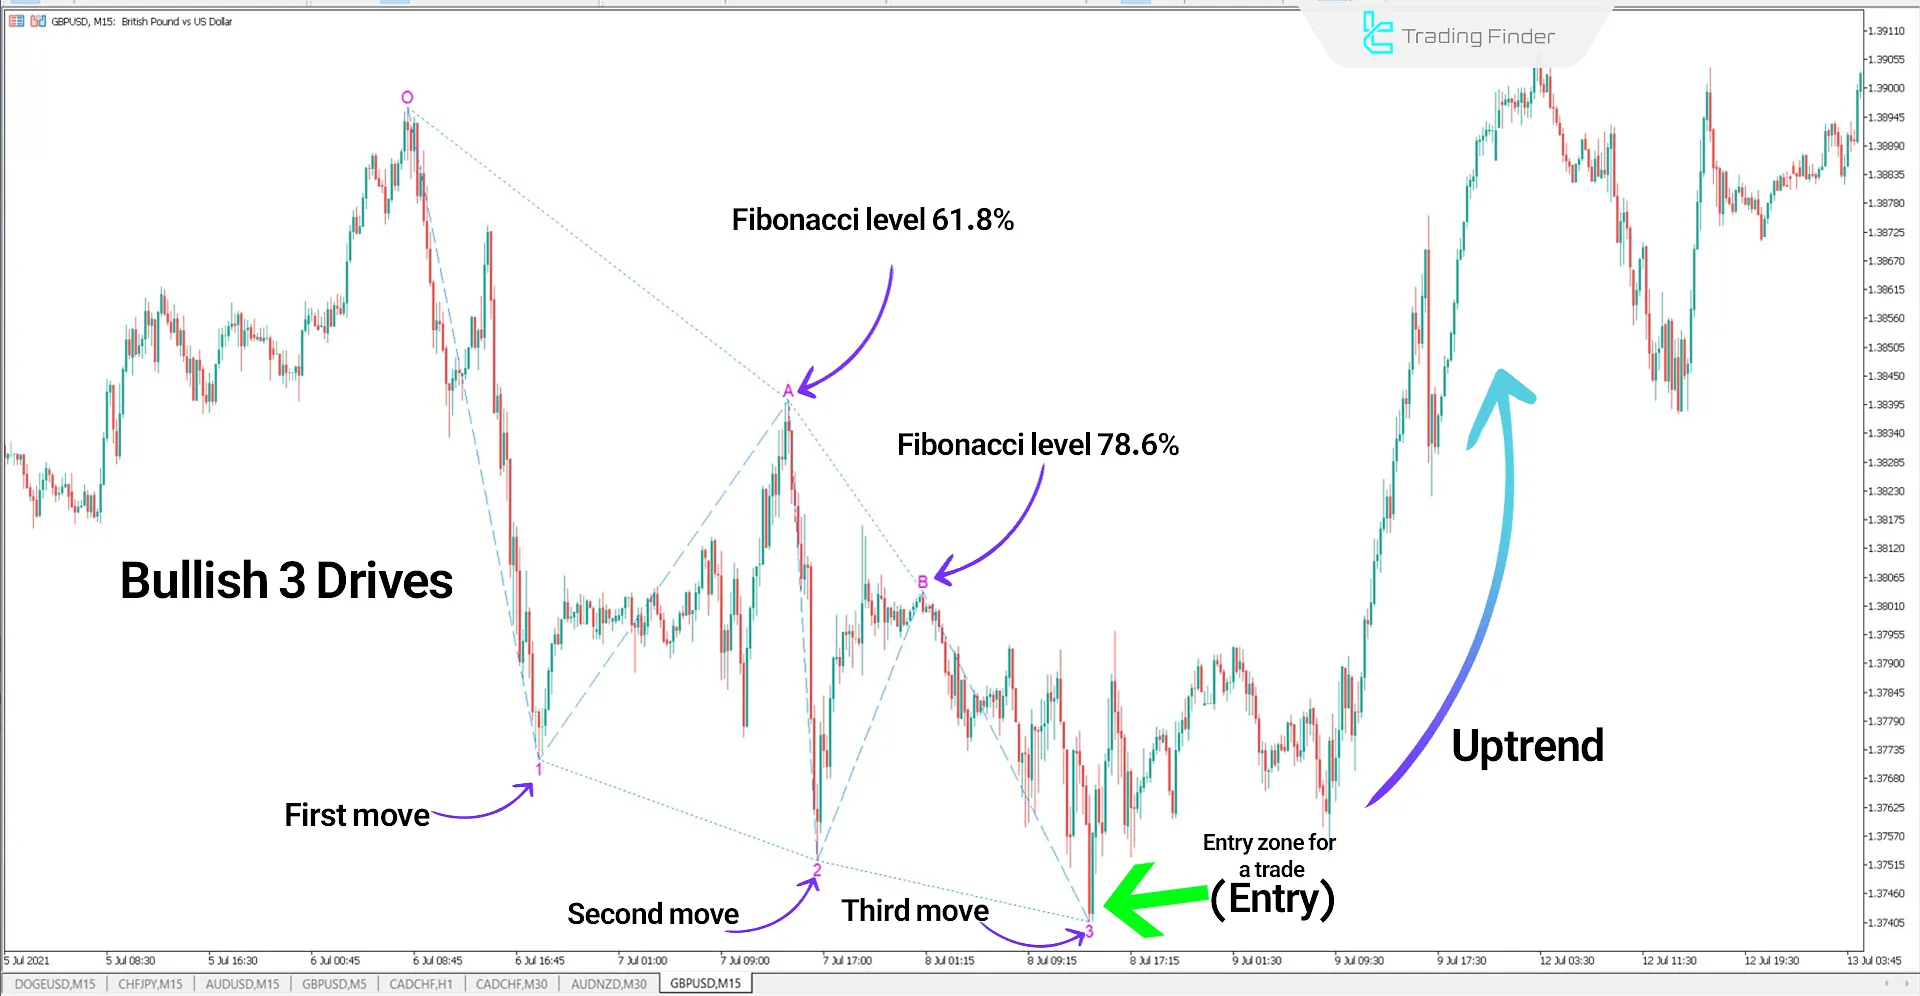
Bullish Trend Analysis
In the GBP/USD currency pair chart, the price initially moves downward and then experiences an upward correction, reaching Point A at the 61.8% Fibonacci level of the initial move. This level acts as a resistance zone, causing the price to decline again.
After the B correction, the price extended to the 127.2% Fibonacci extension level. This level is considered a strong reversal zone (PRZ) and marks the start of a new bullish trend.
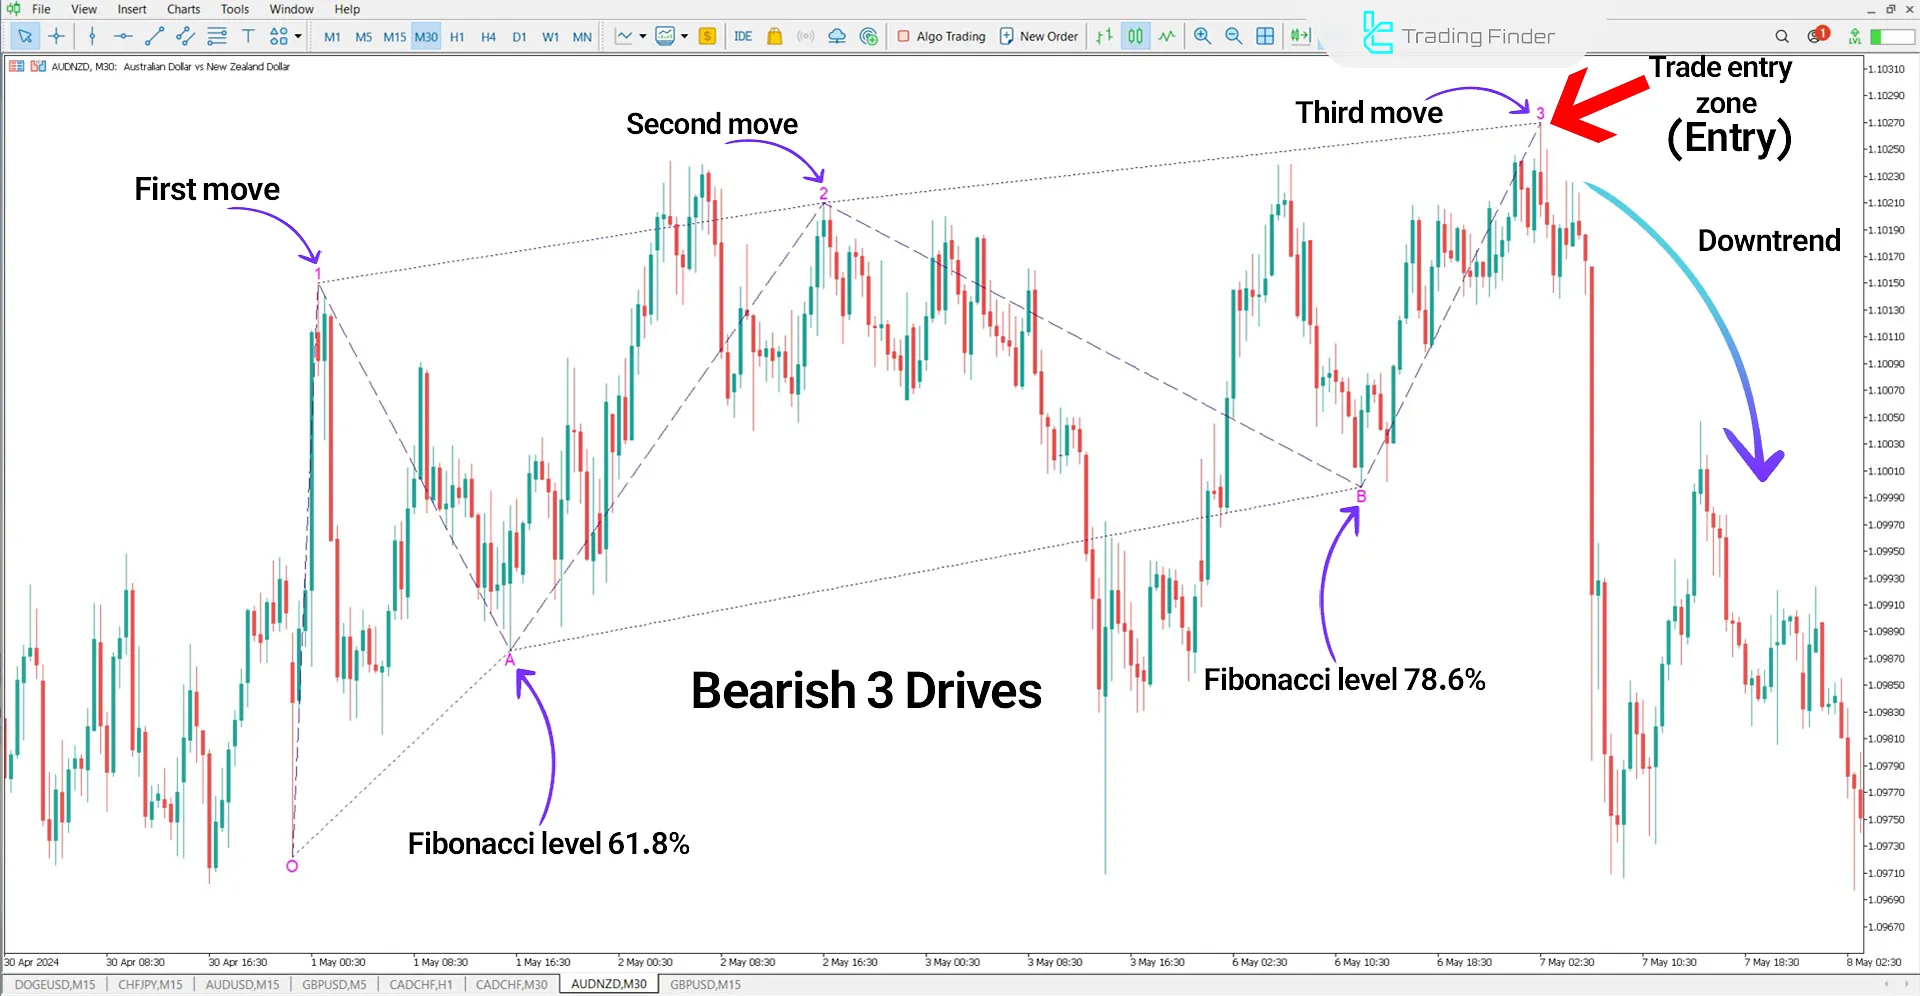
Bearish Trend Analysis
In the USD/JPY currency pair analysis, the price initially makes a strong upward move, then undergoes a downward correction, reaching the 61.8% Fibonacci level at Point A. After this correction, the price moves upward to Point B.
Finally, the price moves strongly downward, falling to the 127.2% Fibonacci extension level of the B correction. At this level, traders enter sell trades.
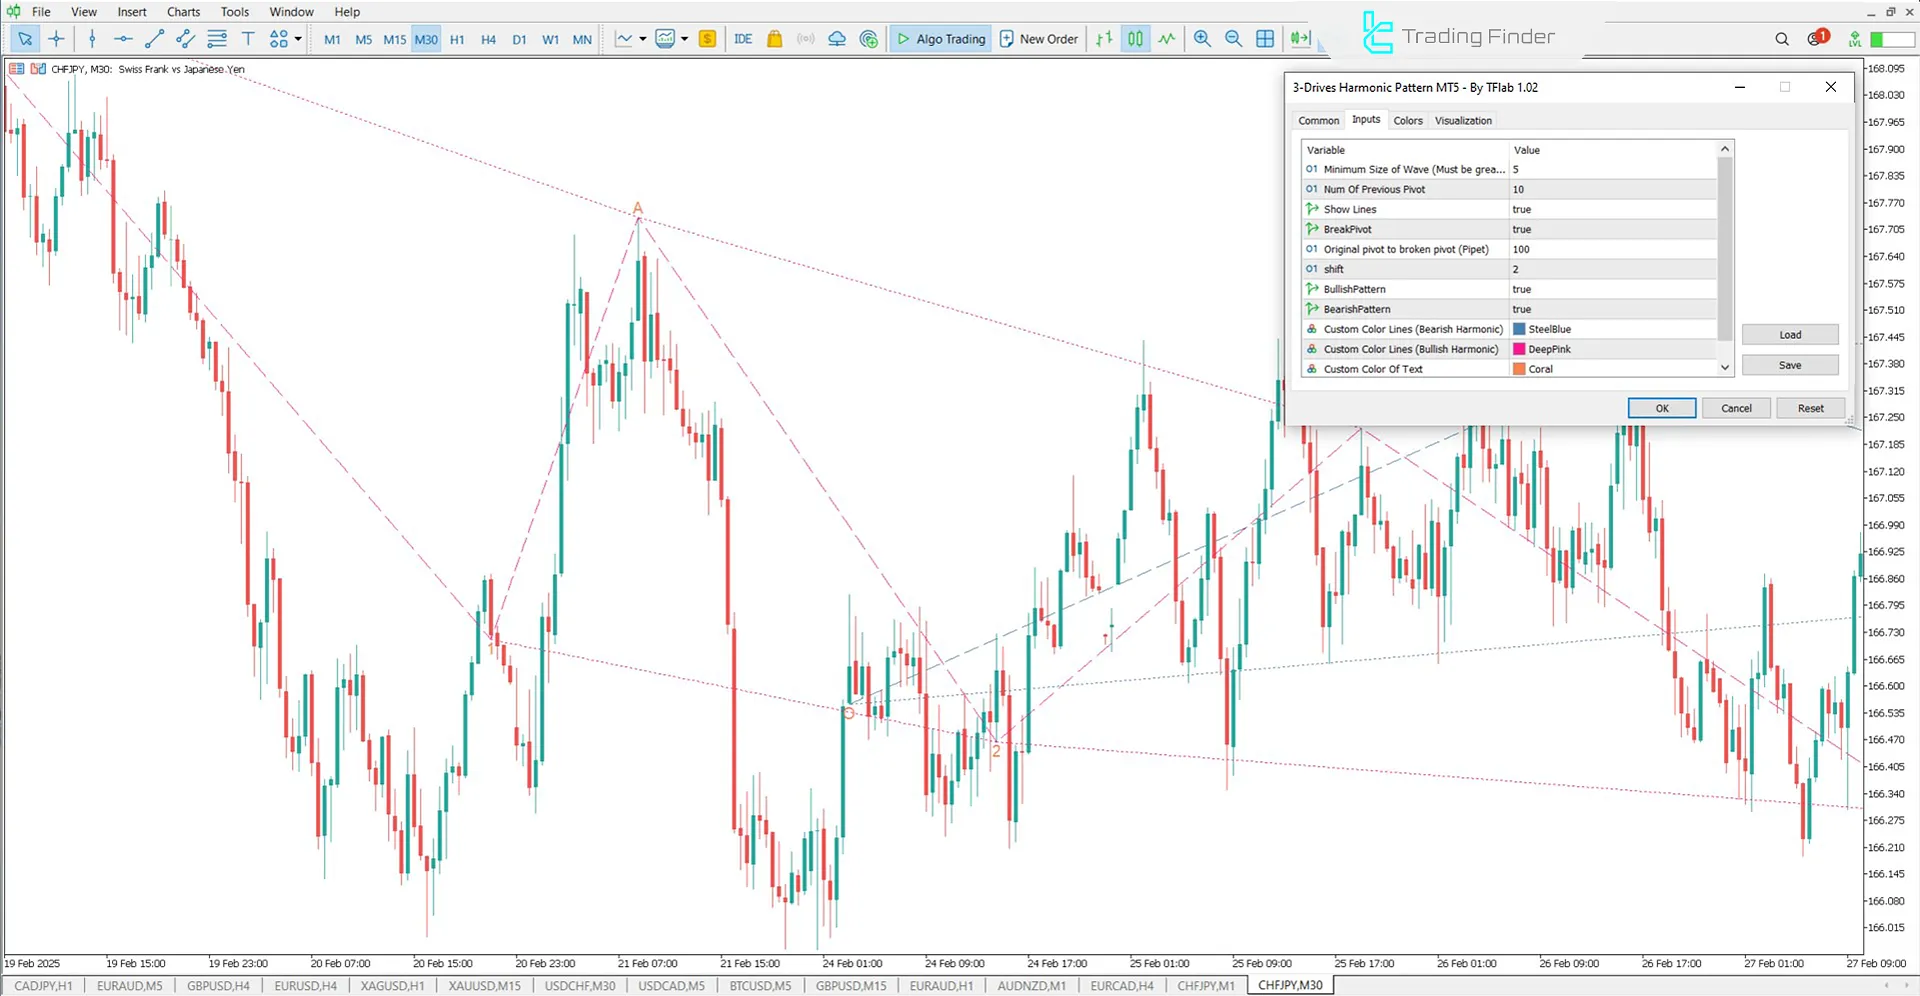
Indicator Settings
The image below displays the full settings of the indicator:
- Minimum Length of Wave (candle): Determines the number of candles required to form a wave
- Num of Previous Candle: Specifies the number of previous candles for analysis
- Show Lines: Displays lines on the chart
- BreakPivot: Enables the display of pivot break analysis
- Original pivot to broken pivot (Pipet): Sets the pivot break distance
- Shift: Adjusts the displacement of lines on the chart
- BullishPattern: Enables the display of bullish patterns
- BearishPattern: Enables the display of bearish patterns
- Style Of Line: Adjusts the type of lines
- Width Of Line: Specifies the thickness of the lines
- Custom Color Lines (Bearish Harmonic): Sets the color for bearish harmonic lines
- Custom Color Lines (Bullish Harmonic): Sets the color for bullish harmonic lines
- Custom Color Of Text: Customizes the text color
Conclusion
The Three Drives Harmonic Pattern Indicator is designed based on Fibonacci ratios. In this Technical analysis tool, price corrections return to the 61.8% or 78.6% levels of the previous move, and each subsequent move typically extends to the 127.2% or 161.8% levels of the prior correction.
When the three main moves and two corrections are completed, the endpoint of the third move is identified as a strong reversal zone (PRZ).
Three Drives Harmonic Pattern MT5 PDF
Three Drives Harmonic Pattern MT5 PDF
Click to download Three Drives Harmonic Pattern MT5 PDFIs this indicator applicable to both bullish and bearish trends?
Yes, this indicator works in both bullish and bearish conditions. In bullish trends, the three main price moves are downward, while in bearish trends, they are upward.
What timeframes are suitable for this indicator?
This indicator is suitable for various timeframes.


