![Absolute Strength Histogram Indicator in MT5 – Free Download [TradingFinder]](https://cdn.tradingfinder.com/image/546375/2-143-en-absolute-strength-histogram-mt5-1.webp)
![Absolute Strength Histogram Indicator in MT5 – Free Download [TradingFinder] 0](https://cdn.tradingfinder.com/image/546375/2-143-en-absolute-strength-histogram-mt5-1.webp)
![Absolute Strength Histogram Indicator in MT5 – Free Download [TradingFinder] 1](https://cdn.tradingfinder.com/image/546374/2-143-en-absolute-strength-histogram-mt5-2.webp)
![Absolute Strength Histogram Indicator in MT5 – Free Download [TradingFinder] 2](https://cdn.tradingfinder.com/image/546376/2-143-en-absolute-strength-histogram-mt5-3.webp)
![Absolute Strength Histogram Indicator in MT5 – Free Download [TradingFinder] 3](https://cdn.tradingfinder.com/image/546378/2-143-en-absolute-strength-histogram-mt5-4.webp)
The Absolute Strength Histogram Indicator is a technical analysis oscillator used to evaluate trend strength and identify buy and sell signals.
This tool is drawn as a histogram in a separate window, and by changing the color of the columns, it displays the strength of buyers or sellers.
Additionally, the crossover of signal lines in the indicator structure identifies momentum changes and the beginning or end of a trend, thereby determining the entry zones for buy and sell trades.
Absolute Strength Histogram Indicator Table
The general specifications of the Absolute Strength Histogram Indicator are presented in the table below:
Indicator Categories: | Oscillators MT5 Indicators Currency Strength MT5 Indicators Momentum Indicators in MT5 |
Platforms: | MetaTrader 5 Indicators |
Trading Skills: | Intermediate |
Indicator Types: | Reversal MT5 Indicators |
Timeframe: | Multi-Timeframe MT5 Indicators |
Trading Style: | Intraday MT5 Indicators |
Trading Instruments: | Forex MT5 Indicators Crypto MT5 Indicators Stock MT5 Indicators Commodity MT5 Indicators Indices MT5 Indicators Share Stock MT5 Indicators |
Absolute Strength Histogram Indicator at a Glance
The Absolute Strength Histogram Indicator is a technical analysis tool that determines bullish or bearish market conditions by measuring trend strength and momentum.
This indicator combines histograms and signal lines and displays the results as follows:
- Blue histogram: When the bullish signal line is above the bearish line, it indicates buyer strength and continuation of the uptrend;
- Pink histogram: When the bearish signal line is above the bullish line, it indicates seller pressure and strengthening of the downtrend.
Indicator in Bullish Trend
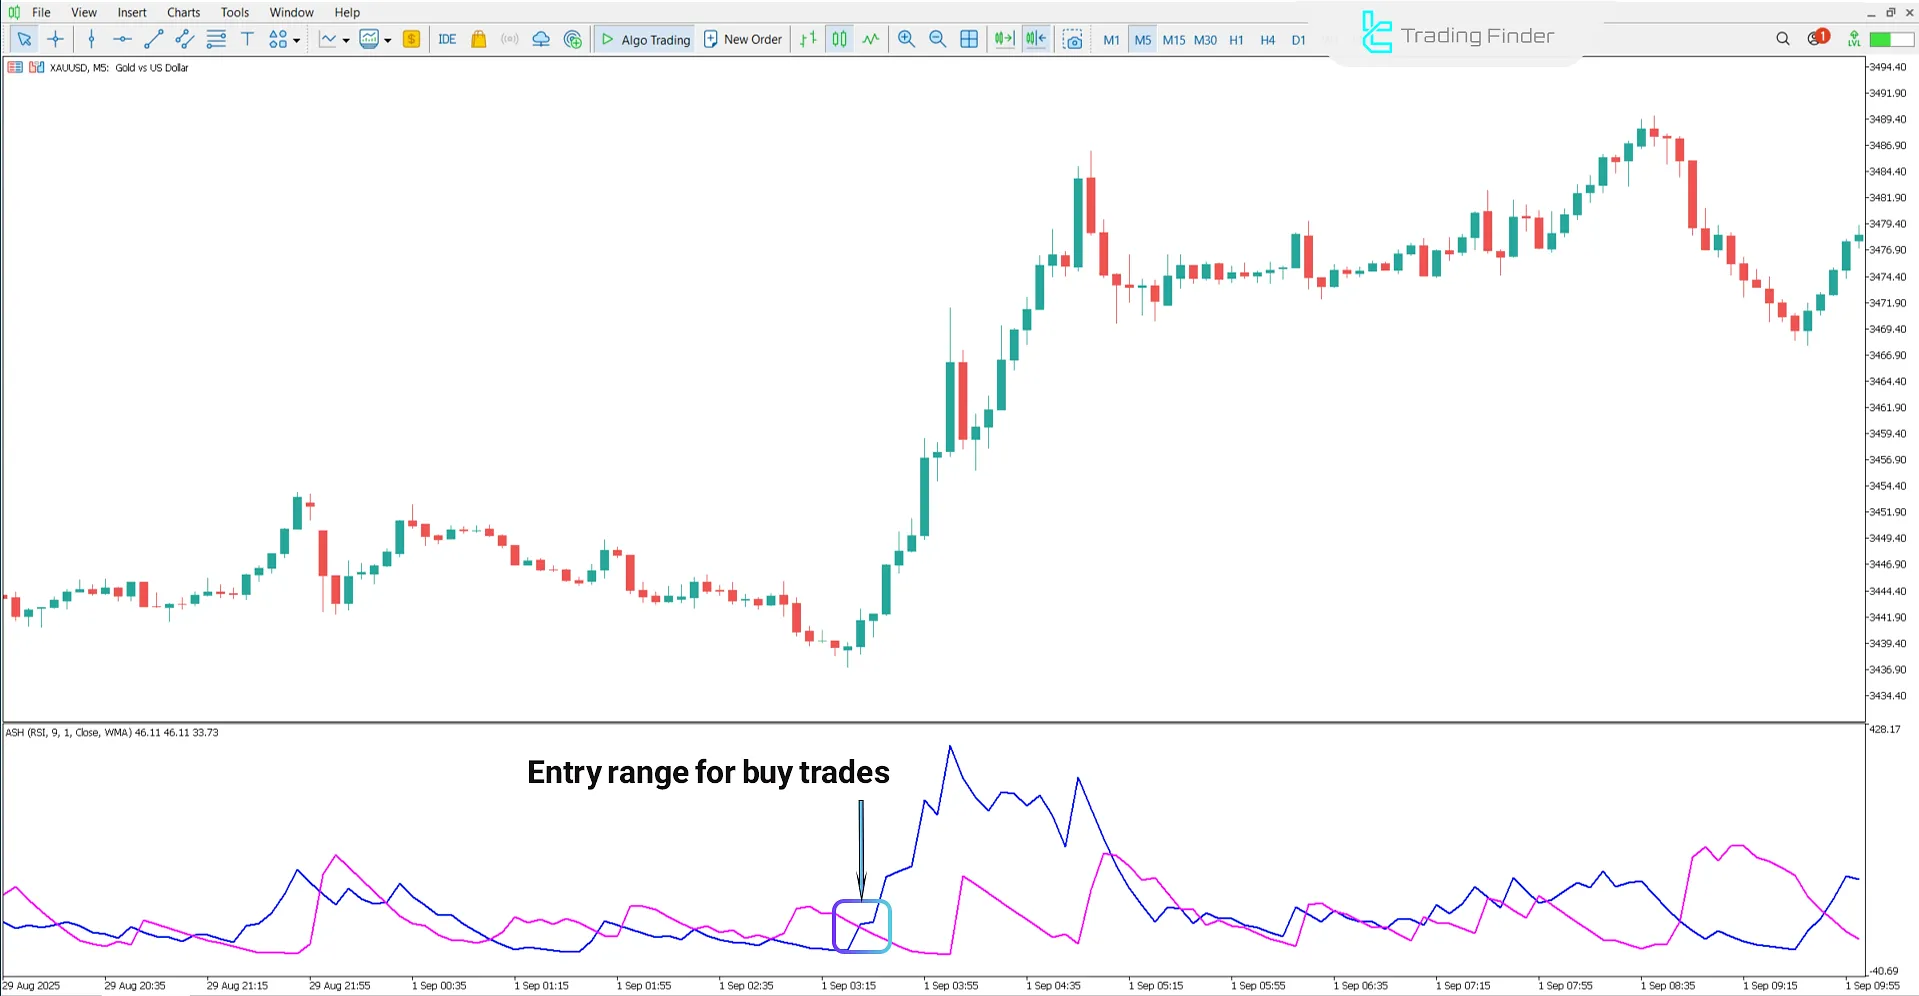
The price chart below shows the global gold ounce index with the symbol (XAU/USD) on the 5-minute timeframe.
In the bullish phase of the market, the indicator provides the following signals:
- Blue histogram: Indicates increased demand and buyer strength;
- Blue signal line above the pink line: Confirms the strength of the uptrend;
- Growth in the blue histogram height: reflects the intensity of buyer momentum.
The combination of these three parameters creates suitable conditions for entering Buy trades.

Indicator in Bearish Trend
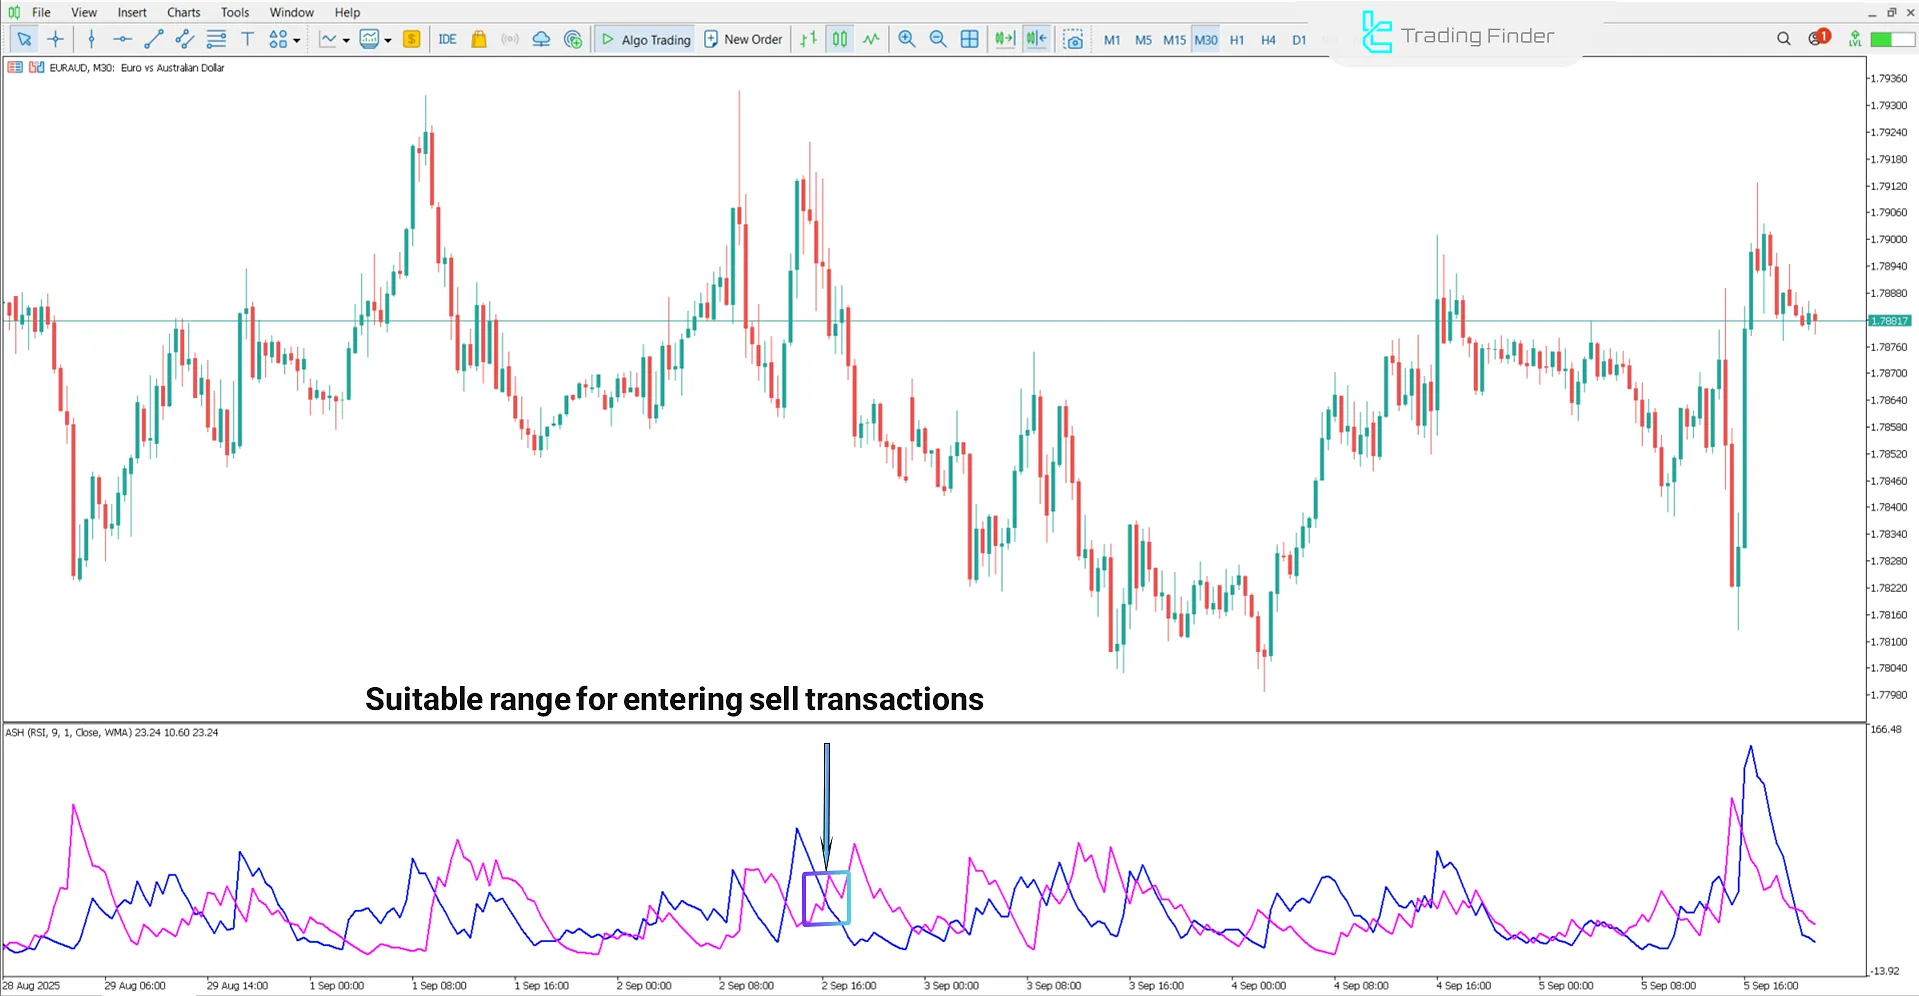
The price chart below shows the Euro against the Australian Dollar pair with symbol (EUR/AUD) on the 30-minute timeframe.
In the bearish trend, the indicator shows seller pressure by changing the histogram color to pink.
At the same time, the blue signal line being above the pink line indicates stronger seller dominance and continuation of the downtrend.

Absolute Strength Histogram Settings
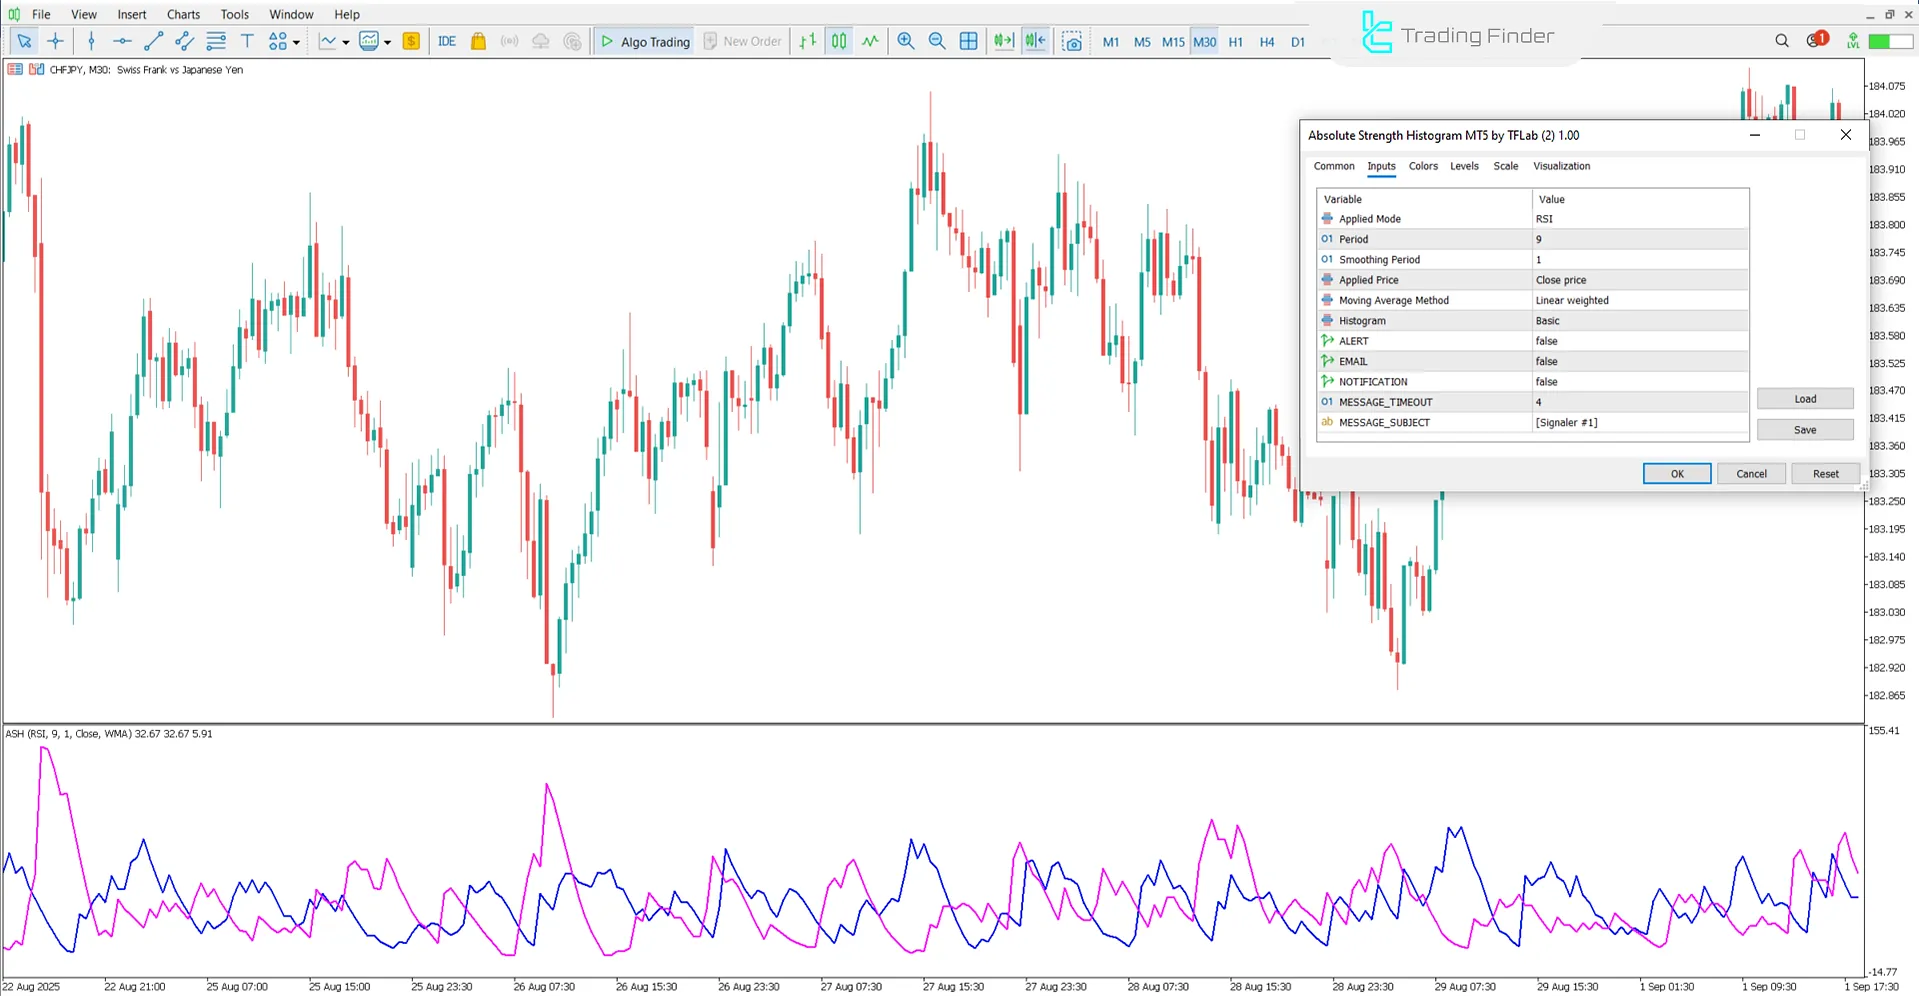
The image below shows the settings section of the Absolute Strength Histogram Indicator:

- Applied Mode: Application of the indicator based on the Relative Strength Index
- Period: Number of candles calculated
- Smoothing Period: Degree of data smoothing
- Applied Price: Closing price of each candle
- Moving Average Method: Linear Weighted Moving Average method
- Histogram: Type of histogram
- Mode_Histo: Histogram display mode
- ALERT: Provide alert
- EMAIL: Send signal to email
- NOTIFICATION: Send notification in the platform
- MESSAGE_TIMEOUT: Message timing
- MESSAGE_SUBJECT: Message subject
Conclusion
The Absolute Strength Histogram Indicator is a suitable technical analysis trading tool that determines market trend strength and direction using histograms and signal lines.
This indicator identifies suitable entry and exit trade zones by analyzing bar color changes and signal line crossovers.
Absolute Strength Histogram Indicator in MT5 PDF
Absolute Strength Histogram Indicator in MT5 PDF
Click to download Absolute Strength Histogram Indicator in MT5 PDFWhat is the role of signal lines in the Absolute Strength Histogram Indicator?
In this trading tool, the two signal lines represent momentum changes, and their crossover indicates the beginning or end of a trend.
What is the difference between the Absolute Strength Histogram Indicator and MACD?
This indicator focuses more on trend strength, while MACD is more concentrated on moving average changes and divergence.


