![Adaptive RSI indicator for MetaTrader 5 Download - Free - [TradingFinder]](https://cdn.tradingfinder.com/image/140752/11-50-en-adaptive-rsi-mt5-01.webp)
![Adaptive RSI indicator for MetaTrader 5 Download - Free - [TradingFinder] 0](https://cdn.tradingfinder.com/image/140752/11-50-en-adaptive-rsi-mt5-01.webp)
![Adaptive RSI indicator for MetaTrader 5 Download - Free - [TradingFinder] 1](https://cdn.tradingfinder.com/image/140737/11-50-en-adaptive-rsi-mt5-02.webp)
![Adaptive RSI indicator for MetaTrader 5 Download - Free - [TradingFinder] 2](https://cdn.tradingfinder.com/image/140749/11-50-en-adaptive-rsi-mt5-03.webp)
![Adaptive RSI indicator for MetaTrader 5 Download - Free - [TradingFinder] 3](https://cdn.tradingfinder.com/image/140748/11-50-en-adaptive-rsi-mt5-04.webp)
The Adaptive RSI indicator is an efficient tool for traders who base their analysis on the RSI indicator. ThisMT5indicator advanced Relative Strength Index (RSI) version is specifically designed for the MetaTrader 5 (MT5) platform.
Utilizing its unique algorithm, the indicator reduces noise and fluctuations in RSI data, providing higher calculation accuracy. This capability allows for more precise identification of overbought and oversold zones. Traders can use this indicator to identify price trends and reversal points, helping them make better trading decisions.
Adaptive RSI Oscillator Table
Indicator Categories: | Oscillators MT5 Indicators Signal & Forecast MT5 Indicators Currency Strength MT5 Indicators Trading Assist MT5 Indicators RSI Indicators for MetaTrader 5 |
Platforms: | MetaTrader 5 Indicators |
Trading Skills: | Elementary |
Indicator Types: | Leading MT5 Indicators Entry & Exit MT5 Indicators |
Timeframe: | Multi-Timeframe MT5 Indicators |
Trading Style: | Scalper MT5 Indicators Day Trading MT5 Indicators |
Trading Instruments: | Forex MT5 Indicators Crypto MT5 Indicators Indices MT5 Indicators |
Indicator Overview
The Adaptive RSI indicator is an advanced oscillator built on the classic RSI, optimized with a unique algorithm. This indicator provides higher accuracy and precise calculations, delivering a more reliable and efficient view of price trends.
Traders can use this tool to identify reversal zones and detect trend changes more precisely.
Uptrend

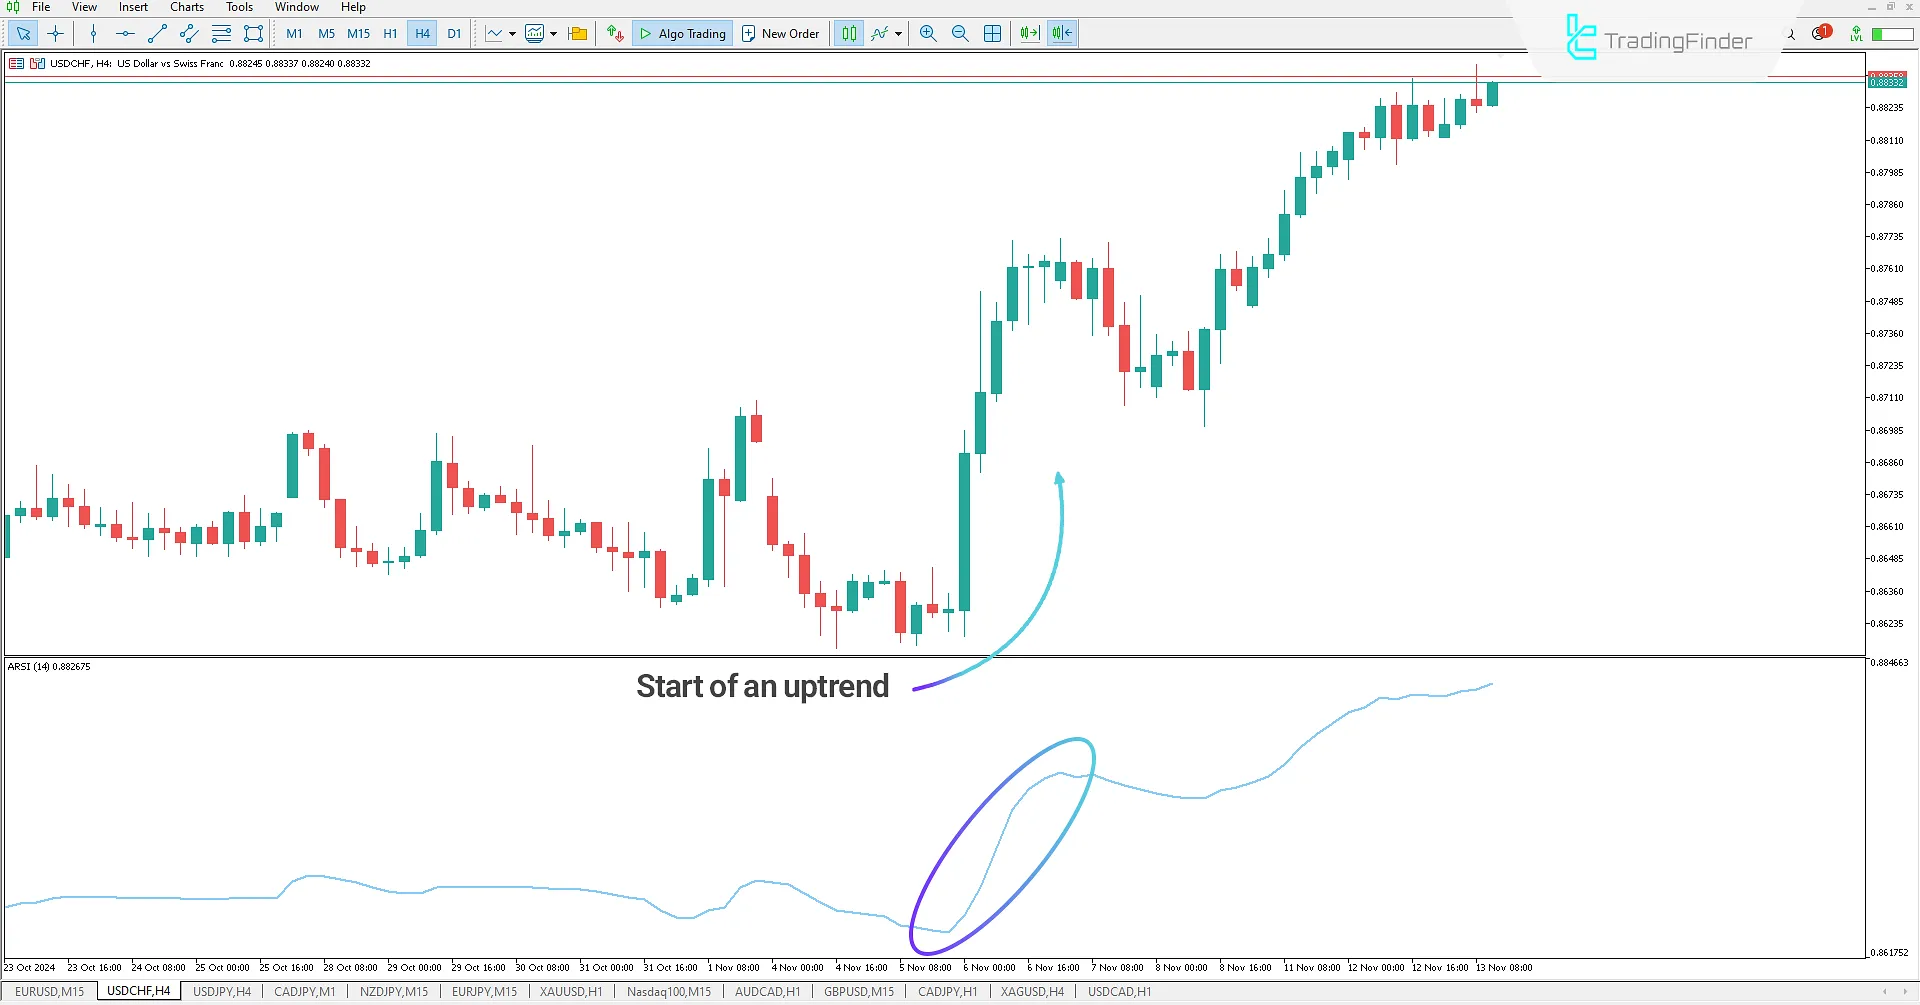
In the USD/CHF 4-hour chart, after a ranging and bearish movement, the price begins its upward trend. The Adaptive RSI indicator, reaching the oversold zone and starting to move upward, signals the start of an uptrend to traders.
Traders can use this indicator to identify when the oscillator reaches the oversold zone, wait for a suitable buying opportunity, and then enter a buy trade.
Downtrend

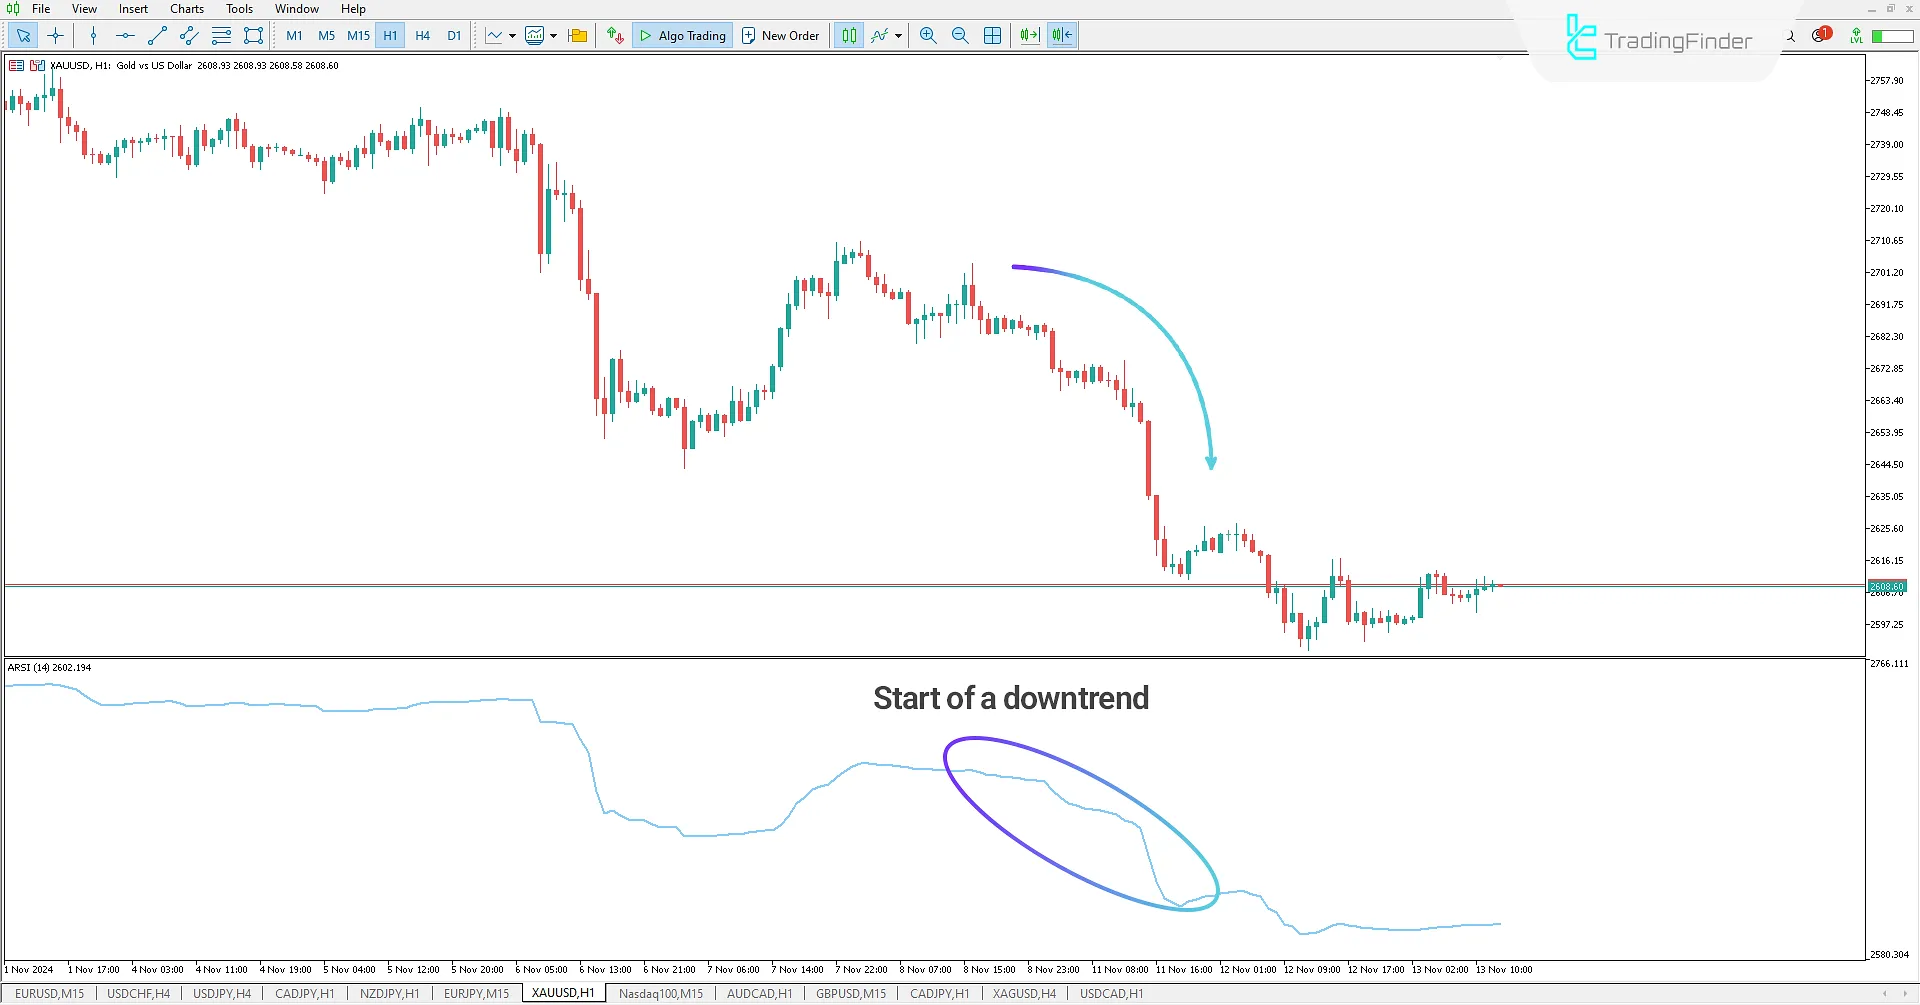
In the XAUUSD 1-hour chart, the Adaptive RSI oscillator exits the overbought zone and enters a downtrend, followed by a price correction. After these downward and upward movements, the oscillator enters another downtrend, signaling the bearish trend to traders.
After analyzing and evaluating the price condition, traders can enter sell trades when identifying suitable trading opportunities.
Adaptive RSI Oscillator Settings

Display_Settings
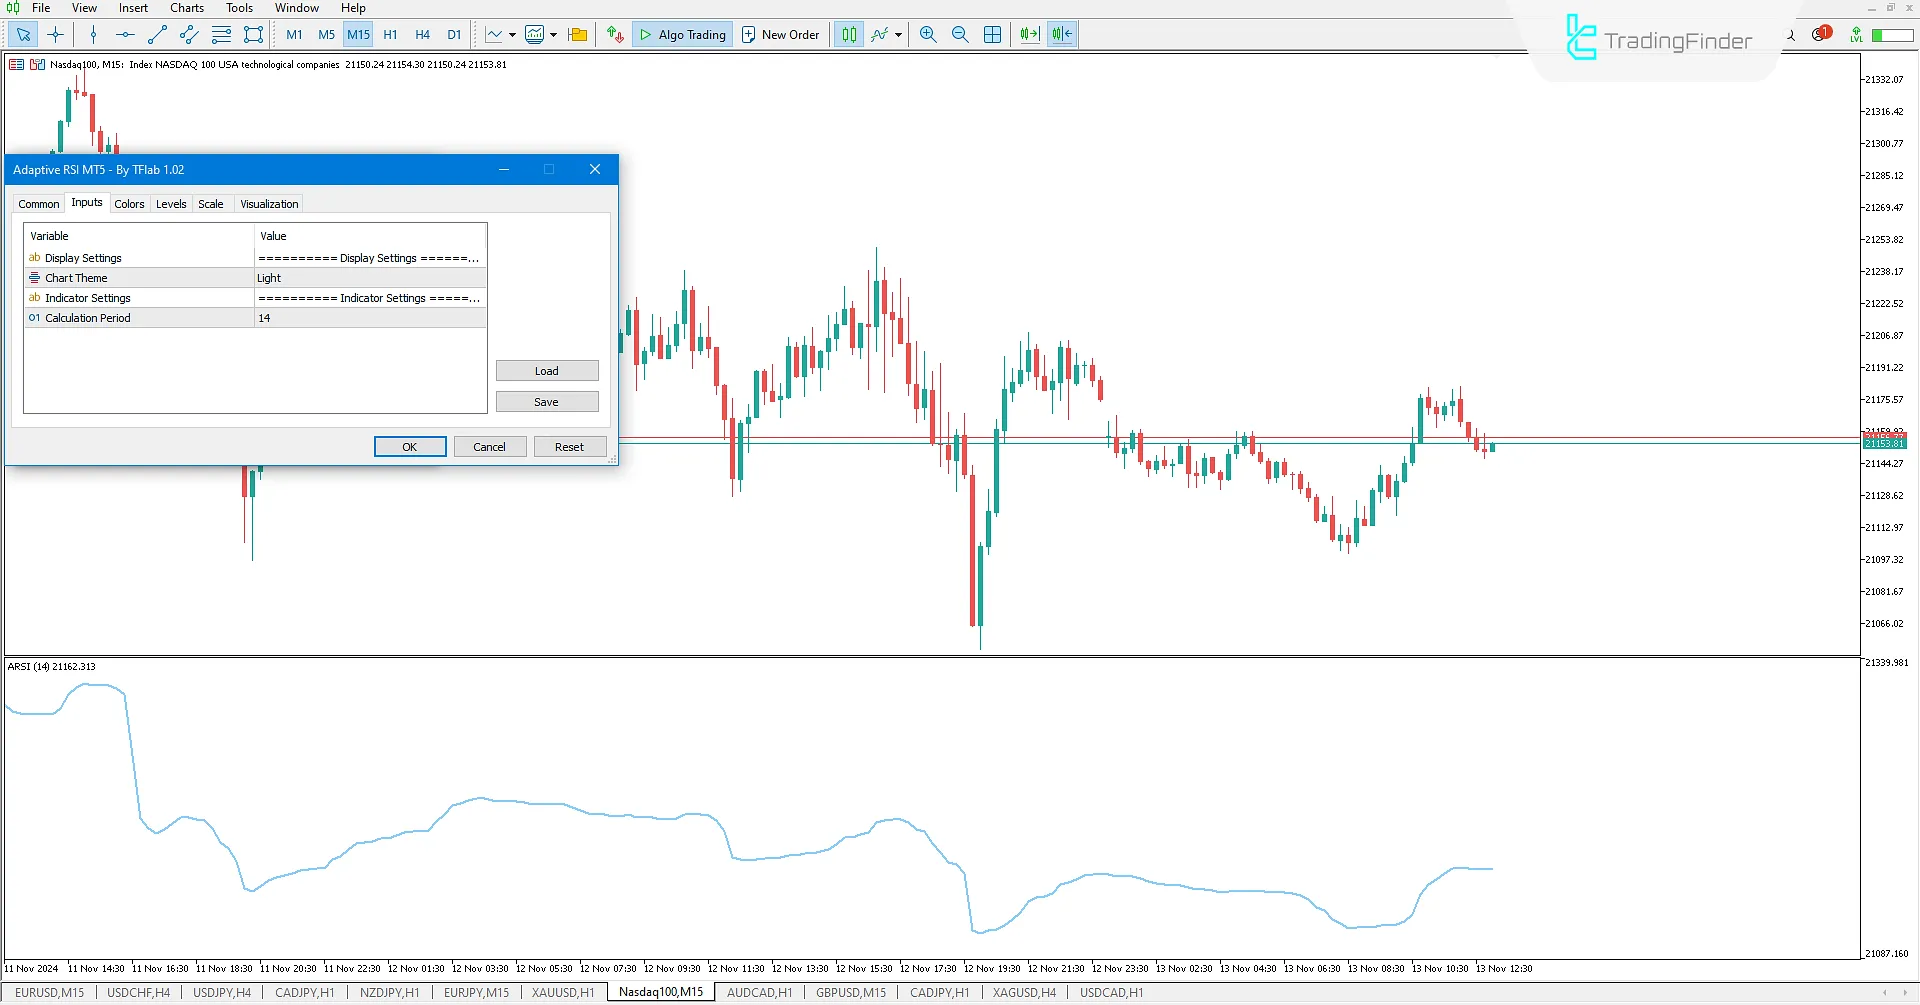
- Chart_theme: Customize the indicator’s theme
Indicator_Settings
- Period: Set RSI period
Conclusion
The Adaptive RSI oscillator is an advanced version of the classic RSI indicator, using a unique algorithm to deliver higher accuracy in RSI calculations without noise, displayed in a lower chart window. This MetaTrader5 Trading Assist indicator reduces unnecessary fluctuations and shows price trends with greater precision.
It also clearly displays overbought and oversold zones to traders. Traders can use this tool to identify price reversal areas and perform more accurate market trend analysis.
Adaptive RSI indicator MT5 PDF
Adaptive RSI indicator MT5 PDF
Click to download Adaptive RSI indicator MT5 PDFDoes using the Adaptive RSI help improve trading strategies?
Absolutely. This indicator provides more accurate signals and reduces noise, helping traders improve their strategy and make better decisions.
What type of traders can benefit from this indicator?
This tool suits all traders looking for more precise analysis and more intelligent decision-making in their trades, especially those working with RSI-based strategies.


