![ADR Bar Indicator in MetaTrader 5 – Free Download [TradingFinder]](https://cdn.tradingfinder.com/image/623382/2-169-en-adr-bar-mt5-1.webp)
![ADR Bar Indicator in MetaTrader 5 – Free Download [TradingFinder] 0](https://cdn.tradingfinder.com/image/623382/2-169-en-adr-bar-mt5-1.webp)
![ADR Bar Indicator in MetaTrader 5 – Free Download [TradingFinder] 1](https://cdn.tradingfinder.com/image/623383/2-169-en-adr-bar-mt5-2.webp)
![ADR Bar Indicator in MetaTrader 5 – Free Download [TradingFinder] 2](https://cdn.tradingfinder.com/image/623371/2-169-en-adr-bar-mt5-3.webp)
The ADR Bar Indicator in technical analysis is used as a specialized tool for measuring the average daily range of price movements in financial markets.
This indicator provides accurate examination of daily movement ranges with two operational modes in the settings section:
- Static Mode: Calculations are based on the opening price of the day, and the 50% and 100% levels are drawn above and below the chart as reference ranges.
- Dynamic Mode: The range is calculated according to the day’s High/Low prices, showing the actual price movement path up to the current moment with higher precision.
ADR Bar Indicator Table
The general specifications of the ADR Bar Indicator are shown in the table below.
Indicator Categories: | Trading Assist MT5 Indicators Levels MT5 Indicators |
Platforms: | MetaTrader 5 Indicators |
Trading Skills: | Intermediate |
Indicator Types: | Reversal MT5 Indicators |
Timeframe: | Multi-Timeframe MT5 Indicators |
Trading Style: | Intraday MT5 Indicators |
Trading Instruments: | Forex MT5 Indicators Crypto MT5 Indicators Stock MT5 Indicators |
ADR Bar Indicator at a Glance
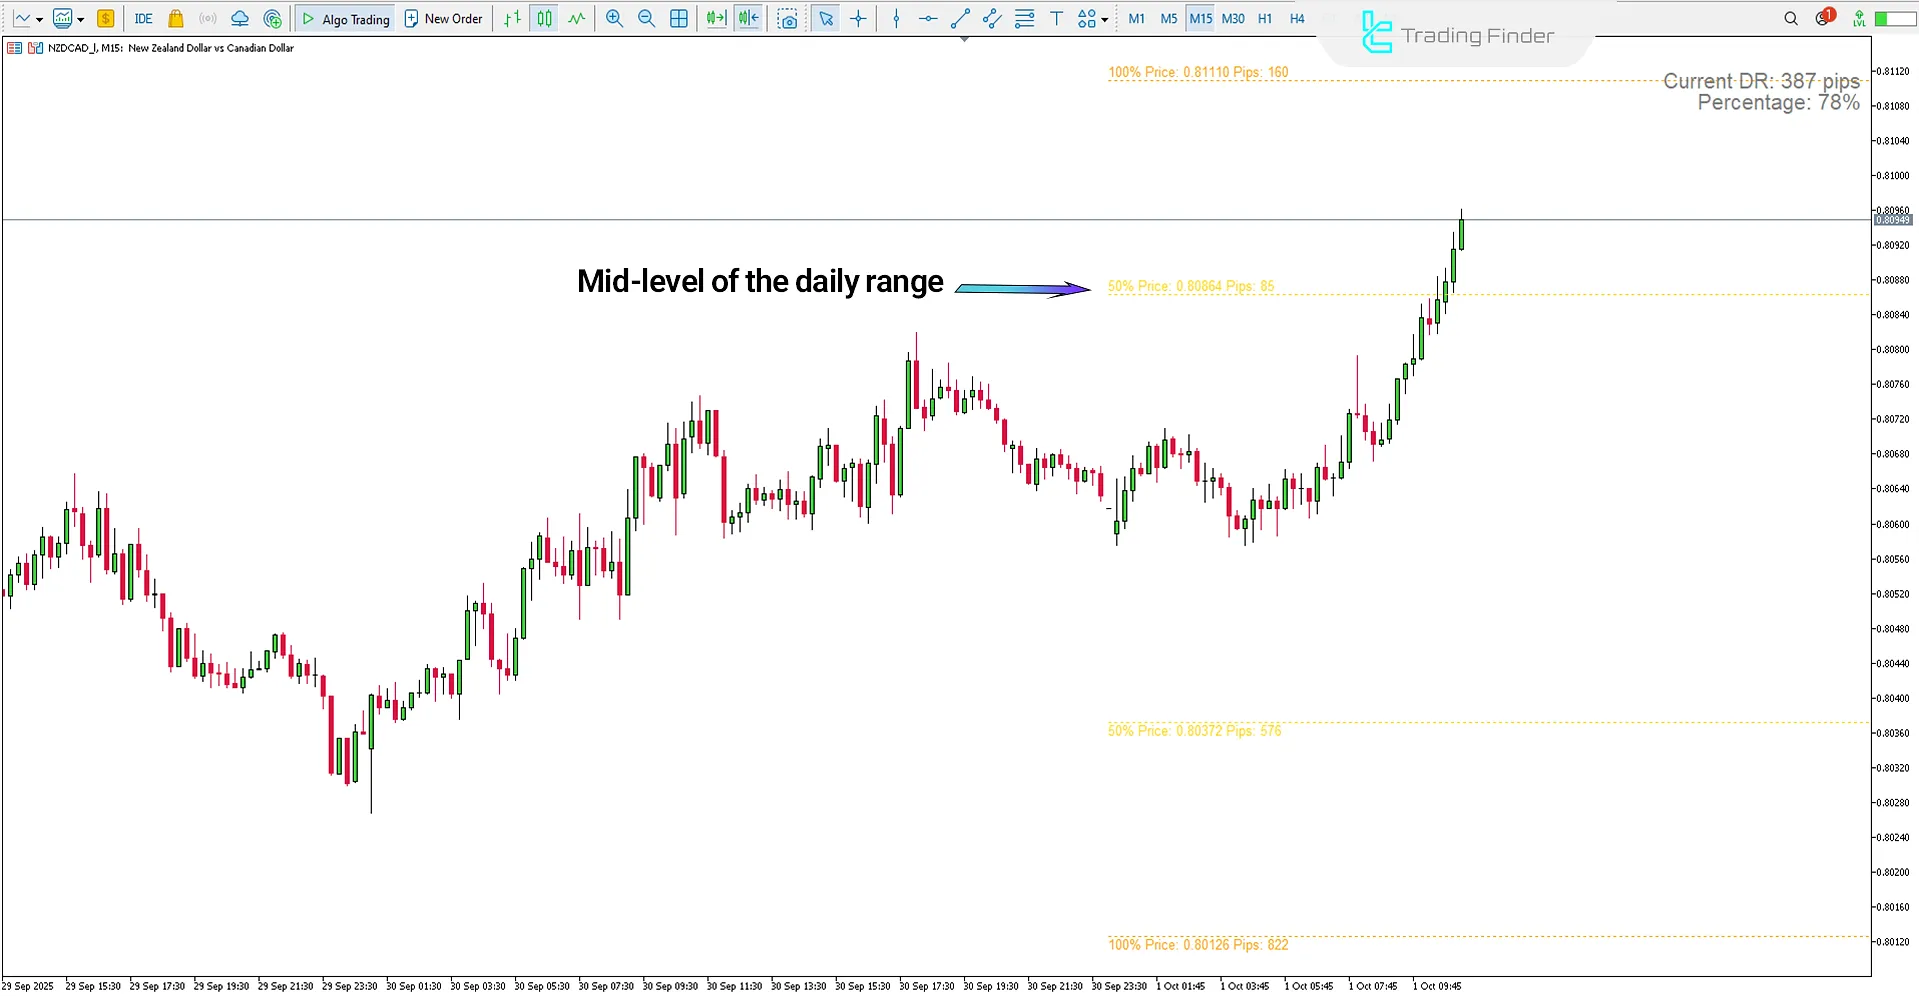
On the right side of the ADR Bar Indicator chart, several horizontal bars and a numeric panel appear, each being a part of its calculation structure.
These components display the daily price movement compared to the average daily range (ADR):
- 50% ADR Bar: Identifies the midpoint of the daily range and shows that the price is halfway through the average daily fluctuation;
- 100% ADR Bar: Defines the final boundary of the daily range, and as the price approaches it, it indicates that most of the daily market capacity has been used;
- Current DR Section: Located at the top-right, displaying the exact daily movement in pips;
- Percentage Section: Shows the percentage of the daily range that the price has covered up to the current chart record.
Chart Analysis with ADR Bar Indicator
The chart below shows the price of the NZD/CAD currency pair on the 15-minute timeframe.
The ADR Bar Indicator calculates the daily movement range relying on previous average fluctuations and precisely draws the reference lines on the chart:
- 50% ADR Line: Marks the midpoint of the daily range, recorded at 0.80864.
- 100% ADR Line: Shows the complete daily average range, located at 0.81110.
- Current DR Value: Seen at the top-right corner, showing that by the time of the chart capture, the price had moved about 387 pips, covering 78% of the daily average.

ADR Bar Indicator Settings
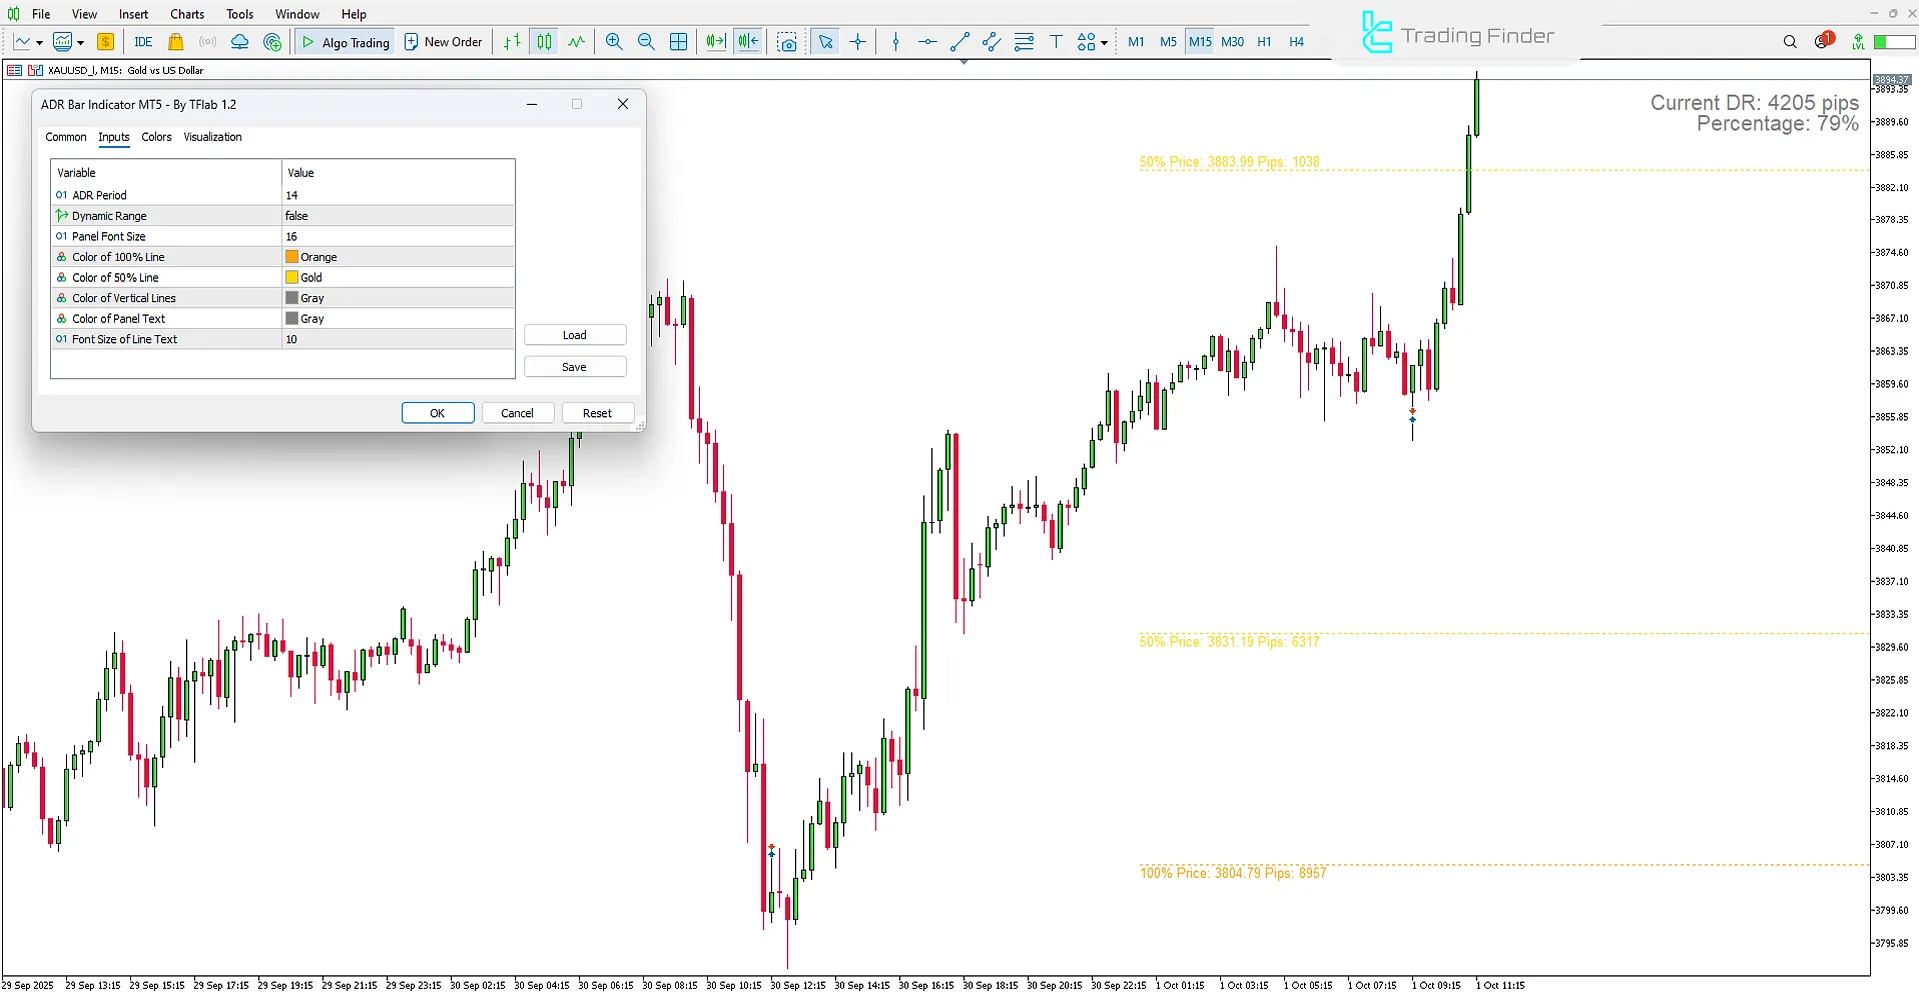
The image below displays the settings panel of the ADR Bar Indicator on the MetaTrader 5 platform:

- ADR Period: ADR calculation period
- Dynamic Range: Show dynamic range
- Panel Font Size: Show panel font size
- Color of 100% Line: Show color of the 100% line
- Color of 50% Line: Dislay color of the 50% line
- Color of Vertical Lines: Display color of vertical lines
- Color of Panel Text: Show color of panel text
- Font Size of Line Text: Show font size of line text
Conclusion
The ADR Bar Indicator functions as a specialized tool for measuring the average daily price range.
This trading tool operates in both Static and Dynamic modes, displaying the traveled and remaining daily range in both numeric and visual form. The 50% and 100% reference lines along with the “Current DR” and “Percentage” values create an accurate framework for evaluating daily market movements.
ADR Bar Indicator in MetaTrader 5 PDF
ADR Bar Indicator in MetaTrader 5 PDF
Click to download ADR Bar Indicator in MetaTrader 5 PDFWhat information does the “Current DR” section in the ADR Bar Indicator provide?
In this trading tool, the “Current DR” section calculates the exact daily movement in pips and displays it in the top-right panel.
What does the 50% line in the ADR Bar Indicator represent?
The 50% line in this indicator identifies the midpoint of the daily range.
Could you modify this indicator to have the option of inputting your preferred percentage for entry and target. For example, 25% of the ADR for certain number of days serves as the entry while 75% serves as target. Thank you for the consideration.
You can use the indicator as it is. Custom indicator development is not part of our services


