![Advanced Currency Strength Indicator for MetaTrader 5 Download - [TradingFinder]](https://cdn.tradingfinder.com/image/522043/2-131-en-advanced-currency-strength-mt5-1.webp)
![Advanced Currency Strength Indicator for MetaTrader 5 Download - [TradingFinder] 0](https://cdn.tradingfinder.com/image/522043/2-131-en-advanced-currency-strength-mt5-1.webp)
![Advanced Currency Strength Indicator for MetaTrader 5 Download - [TradingFinder] 1](https://cdn.tradingfinder.com/image/522045/2-131-en-advanced-currency-strength-mt5-2.webp)
![Advanced Currency Strength Indicator for MetaTrader 5 Download - [TradingFinder] 2](https://cdn.tradingfinder.com/image/522046/2-131-en-advanced-currency-strength-mt5-3.webp)
![Advanced Currency Strength Indicator for MetaTrader 5 Download - [TradingFinder] 3](https://cdn.tradingfinder.com/image/522048/2-131-en-advanced-currency-strength-mt5-4.webp)
The Advanced Currency Strength Indicator is one of the important tools in Forex technical analysis, which simultaneously calculates and displays the relative strength and weakness of currencies compared to each other.
In this oscillator, each currency is represented with a separate line; for instance, the blue line indicates USD while the red line shows EUR.
An upward movement of the lines demonstrates the strengthening of a currency and increased demand pressure, while a downward movement indicates weakening and increased supply pressure.
Advanced Currency Strength Indicator Table
The table below shows the general features of the Advanced Currency Strength Indicator.
Indicator Categories: | Oscillators MT5 Indicators Currency Strength MT5 Indicators Trading Assist MT5 Indicators |
Platforms: | MetaTrader 5 Indicators |
Trading Skills: | Intermediate |
Indicator Types: | Breakout MT5 Indicators Reversal MT5 Indicators |
Timeframe: | Multi-Timeframe MT5 Indicators |
Trading Style: | Intraday MT5 Indicators |
Trading Instruments: | Forex MT5 Indicators |
Advanced Currency Strength at a Glance
The Advanced Currency Strength Indicator analyzes multiple currency pairs simultaneously and displays the relative strength of each currency in the form of colored lines within the oscillator window.
Upward lines indicate rising demand and buying pressure. Downward lines indicate currency weakness and selling pressure.
Crossovers of the lines signify a shift in the balance of power between currencies, often considered a sign of the beginning of a new trend.
Indicator in Bullish Trend
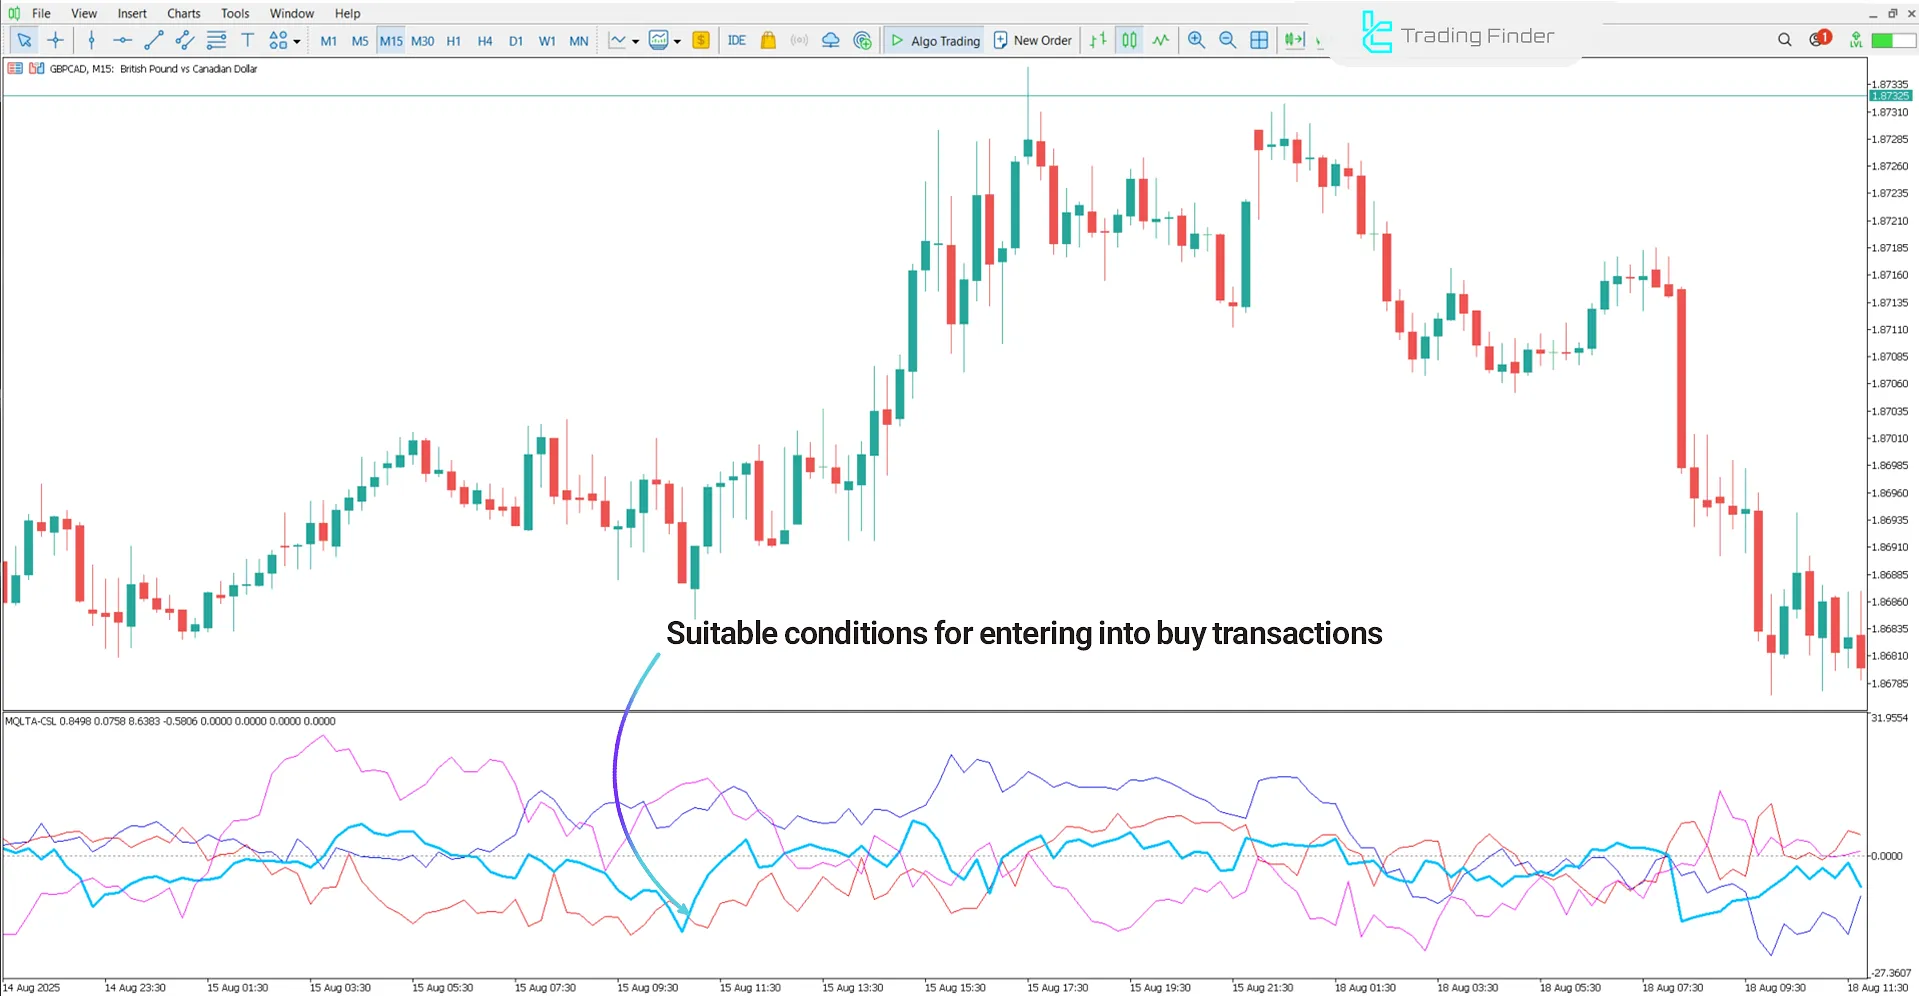
The chart below shows the GBP/CAD pair on a 15-minute timeframe. As the British Pound strengthens against the Canadian Dollar, the GBP line rises above the CAD line, forming an upward trend.
This reflects increased demand for GBP and simultaneous weakness in CAD, highlighting strong buyer presence in the market and providing a suitable entry zone for buy trades.

Indicator in Bearish Trend
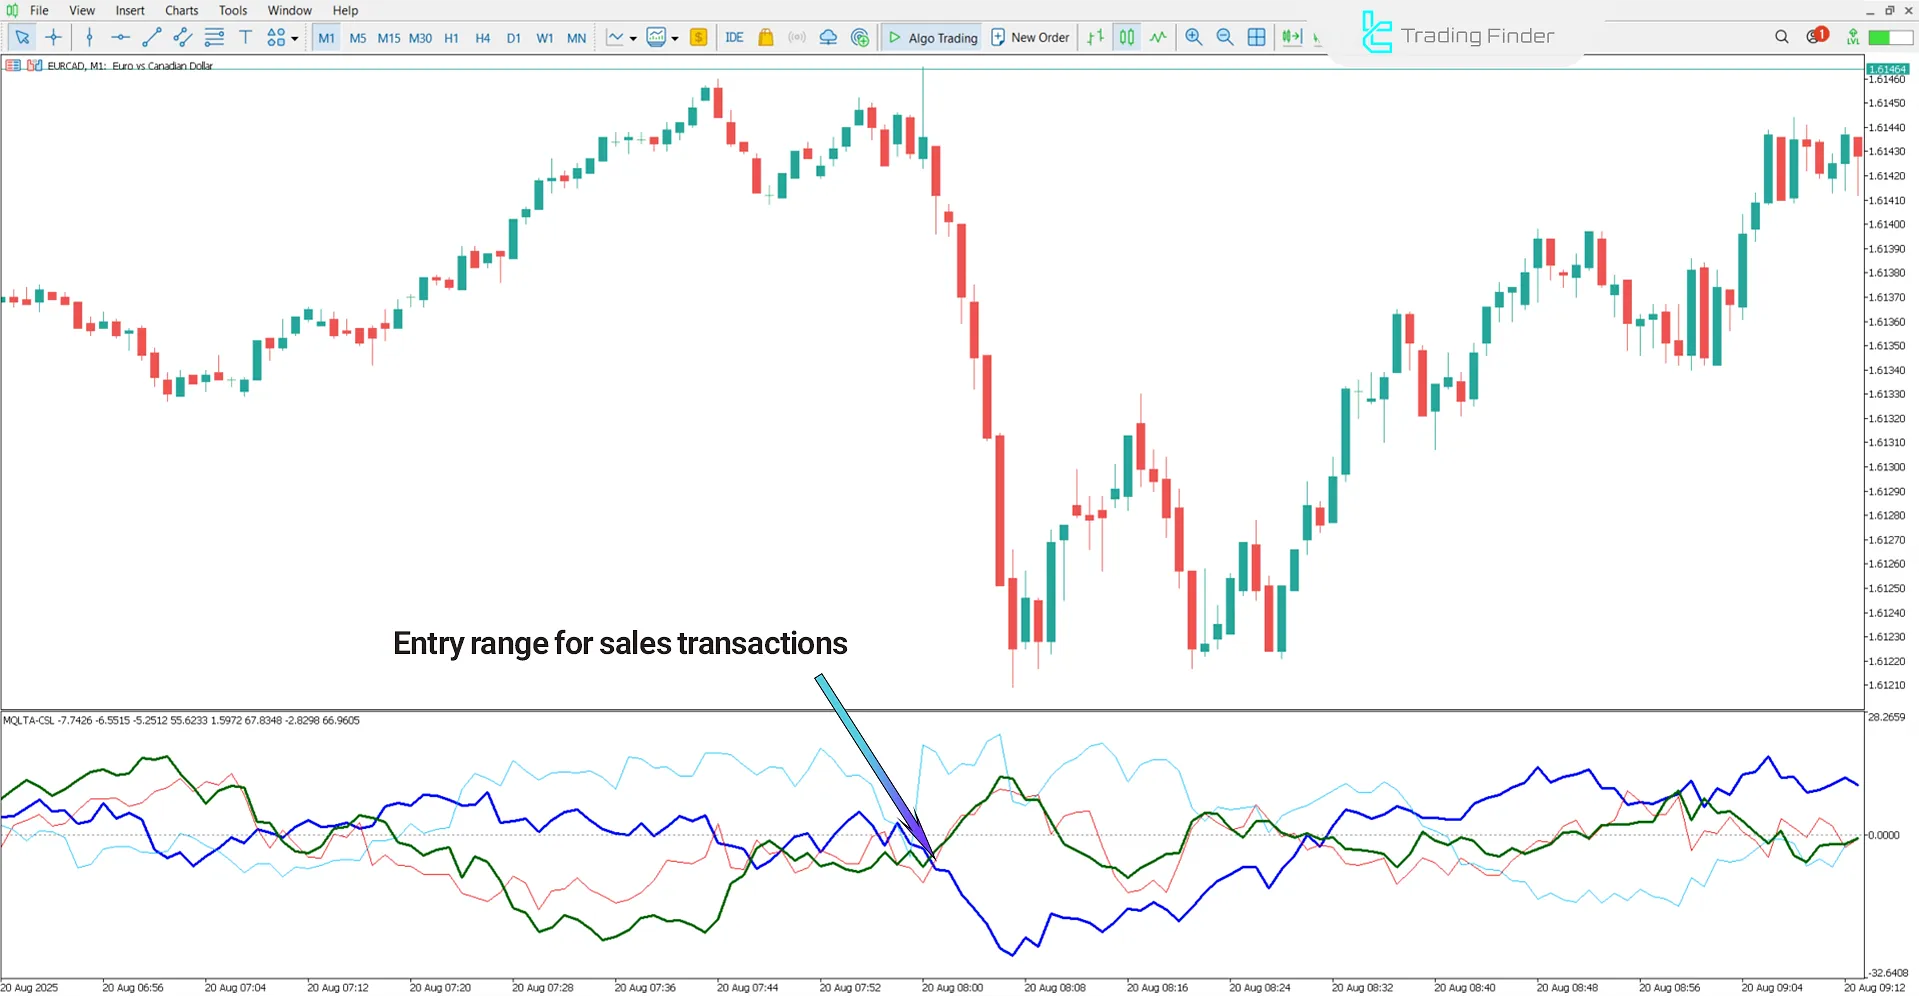
The chart below displays EUR/CAD on a 1-minute timeframe. If the Euro weakens against the Canadian Dollar, the indicator shows the EUR line below the CAD line, marking the start of a downtrend.
This situation indicates selling pressure on EUR and relative strengthening of CAD, reflecting market supply dominance. In such a case, a sell signal is generated, with increased probability of further price decline.

Advanced Currency Strength Settings
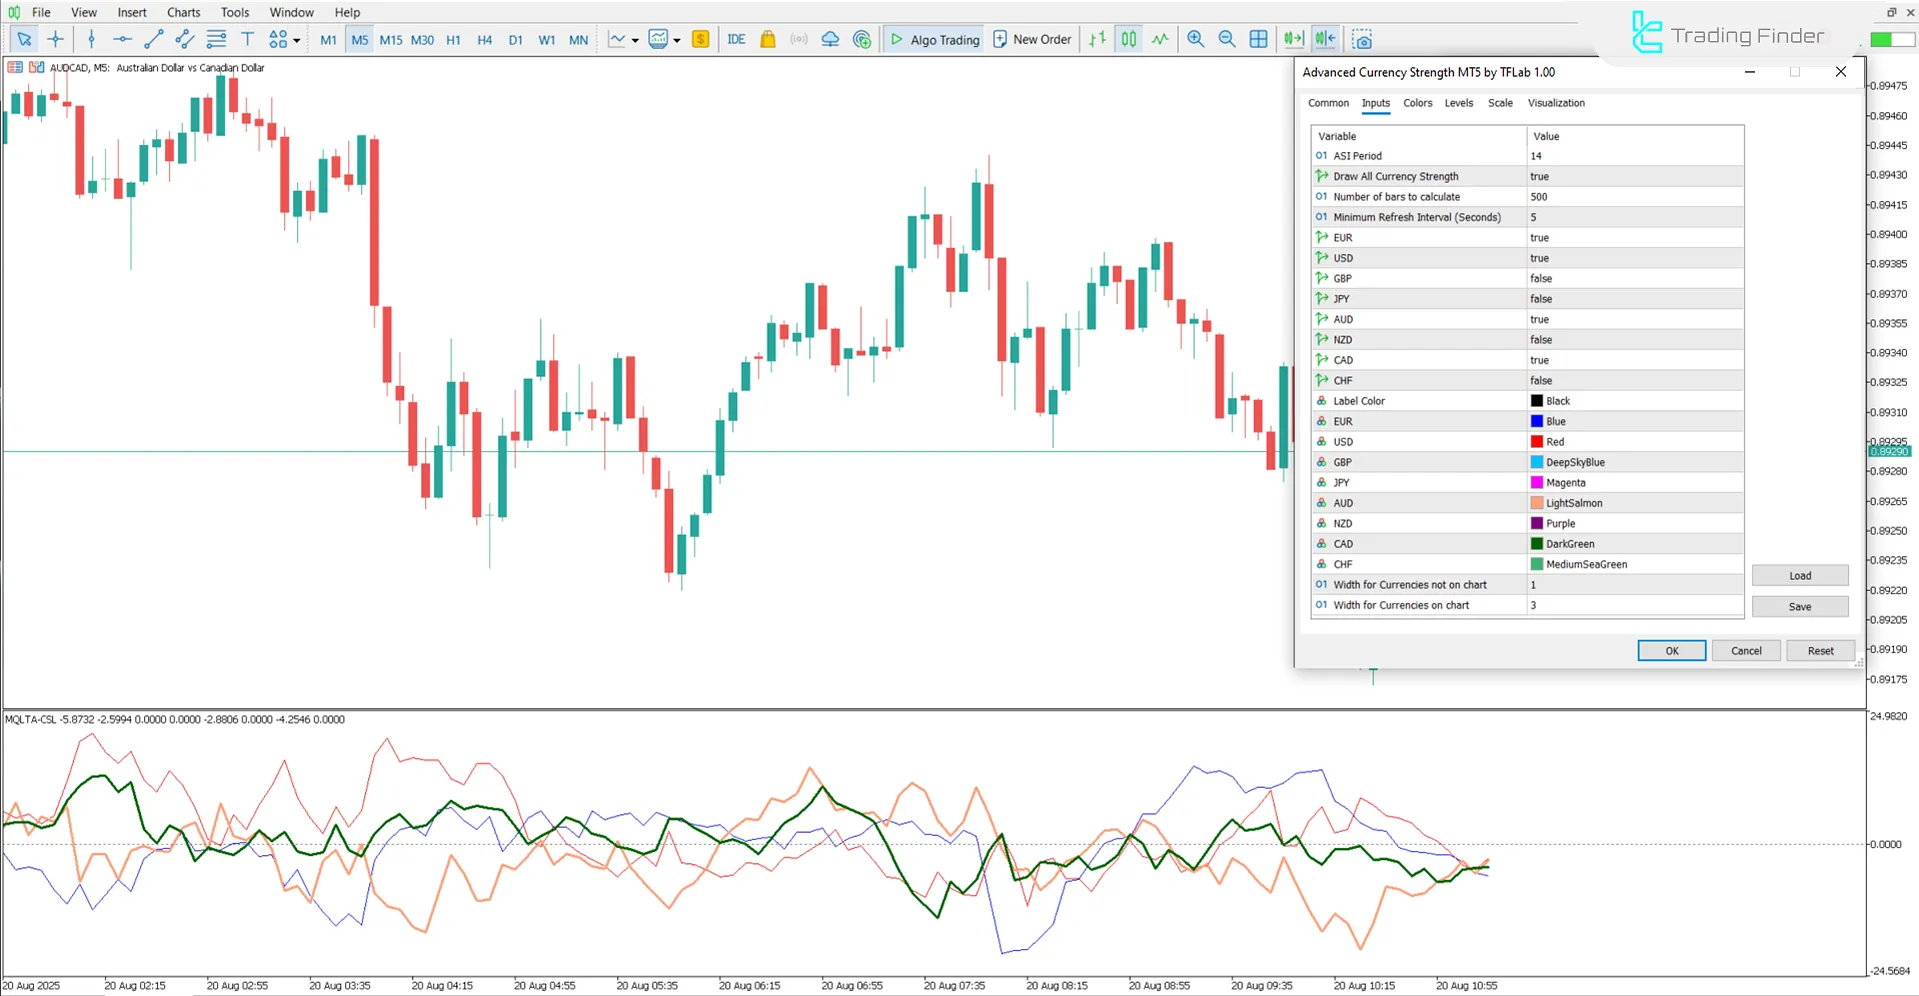
The image below shows the settings of the Advanced Currency Strength Indicator in MetaTrader 5:

- RSIPeriod: Relative Strength Index period
- DrawAllCurrencies: Show all currencies
- MaxBars: Maximum number of candles
- MinimumRefreshInterval: Minimum refresh interval
- UseEUR: Enable Euro
- UseUSD: Enable US Dollar
- UseGBP: Enable British Pound
- UseJPY: Enable Japanese Yen
- UseAUD: Enable Australian Dollar
- UseNZD: Enable New Zealand Dollar
- UseCAD: Enable Canadian Dollar
- UseCHF: Enable Swiss Franc
- LabelColor: Label color
- EURColor: Euro color
- USDColor: US Dollar color
- GBPColor: British Pound color
- JPYColor: Japanese Yen color
- AUDColor: Australian Dollar color
- NZDColor: New Zealand Dollar color
- CADColor: Canadian Dollar color
- CHFColor: Swiss Franc color
- NormalWidth: Standard line thickness
- SelectedWidth: Selected line thickness
Conclusion
The Advanced Currency Strength Indicator is a highly practical Forex tool that graphically displays the relative strength and weakness of currencies using colored lines.
This trading tool, Rising lines indicate increasing demand and buying pressure, Falling lines indicate weakening currencies and selling pressure.
Advanced Currency Strength Indicator for MT5 PDF
Advanced Currency Strength Indicator for MT5 PDF
Click to download Advanced Currency Strength Indicator for MT5 PDFWhat is the Advanced Currency Strength Indicator?
It is a trading tool that compares multiple currency pairs simultaneously and displays their relative strength and weakness using colored lines.
Is the Advanced Currency Strength Indicator suitable for beginners?
Yes. Due to its simple and visual representation, it can be used by both beginners and professional traders.


