![ADX Color Indicator for MetaTrader 5 – Download - [TradingFinder]](https://cdn.tradingfinder.com/image/428977/2-88-en-adx-color-mt5-1.webp)
![ADX Color Indicator for MetaTrader 5 – Download - [TradingFinder] 0](https://cdn.tradingfinder.com/image/428977/2-88-en-adx-color-mt5-1.webp)
![ADX Color Indicator for MetaTrader 5 – Download - [TradingFinder] 1](https://cdn.tradingfinder.com/image/428975/2-88-en-adx-color-mt5-2.webp)
![ADX Color Indicator for MetaTrader 5 – Download - [TradingFinder] 2](https://cdn.tradingfinder.com/image/428978/2-88-en-adx-color-mt5-3.webp)
![ADX Color Indicator for MetaTrader 5 – Download - [TradingFinder] 3](https://cdn.tradingfinder.com/image/428976/2-88-en-adx-color-mt5-4.webp)
The ADX Color Indicator is an advanced version of the traditional ADX indicator in technical analysis, used to measure the strength of trends in financial markets, such as Forex.
This indicator uses colored bars to represent the direction, strength of the trend, and suitable zones for trade entries and exits.
ADX Color Indicator Table
The general specifications of the ADX Color indicator are presented in the table below:
Indicator Categories: | Oscillators MT5 Indicators Currency Strength MT5 Indicators Trading Assist MT5 Indicators |
Platforms: | MetaTrader 5 Indicators |
Trading Skills: | Elementary |
Indicator Types: | Reversal MT5 Indicators |
Timeframe: | Multi-Timeframe MT5 Indicators |
Trading Style: | Intraday MT5 Indicators |
Trading Instruments: | Forex MT5 Indicators Crypto MT5 Indicators Stock MT5 Indicators Commodity MT5 Indicators Indices MT5 Indicators Share Stock MT5 Indicators |
Indicator at a Glance
The ADX Color indicator, by measuring trend strength (regardless of its direction), displays market data in the form of histograms with various colors, where each color represents a specific market condition:
- Green: Indicates bullish trend strength
- Red: Indicates bearish trend strength
- Gray: Indicates sideways or neutral market conditions
Uptrend Conditions
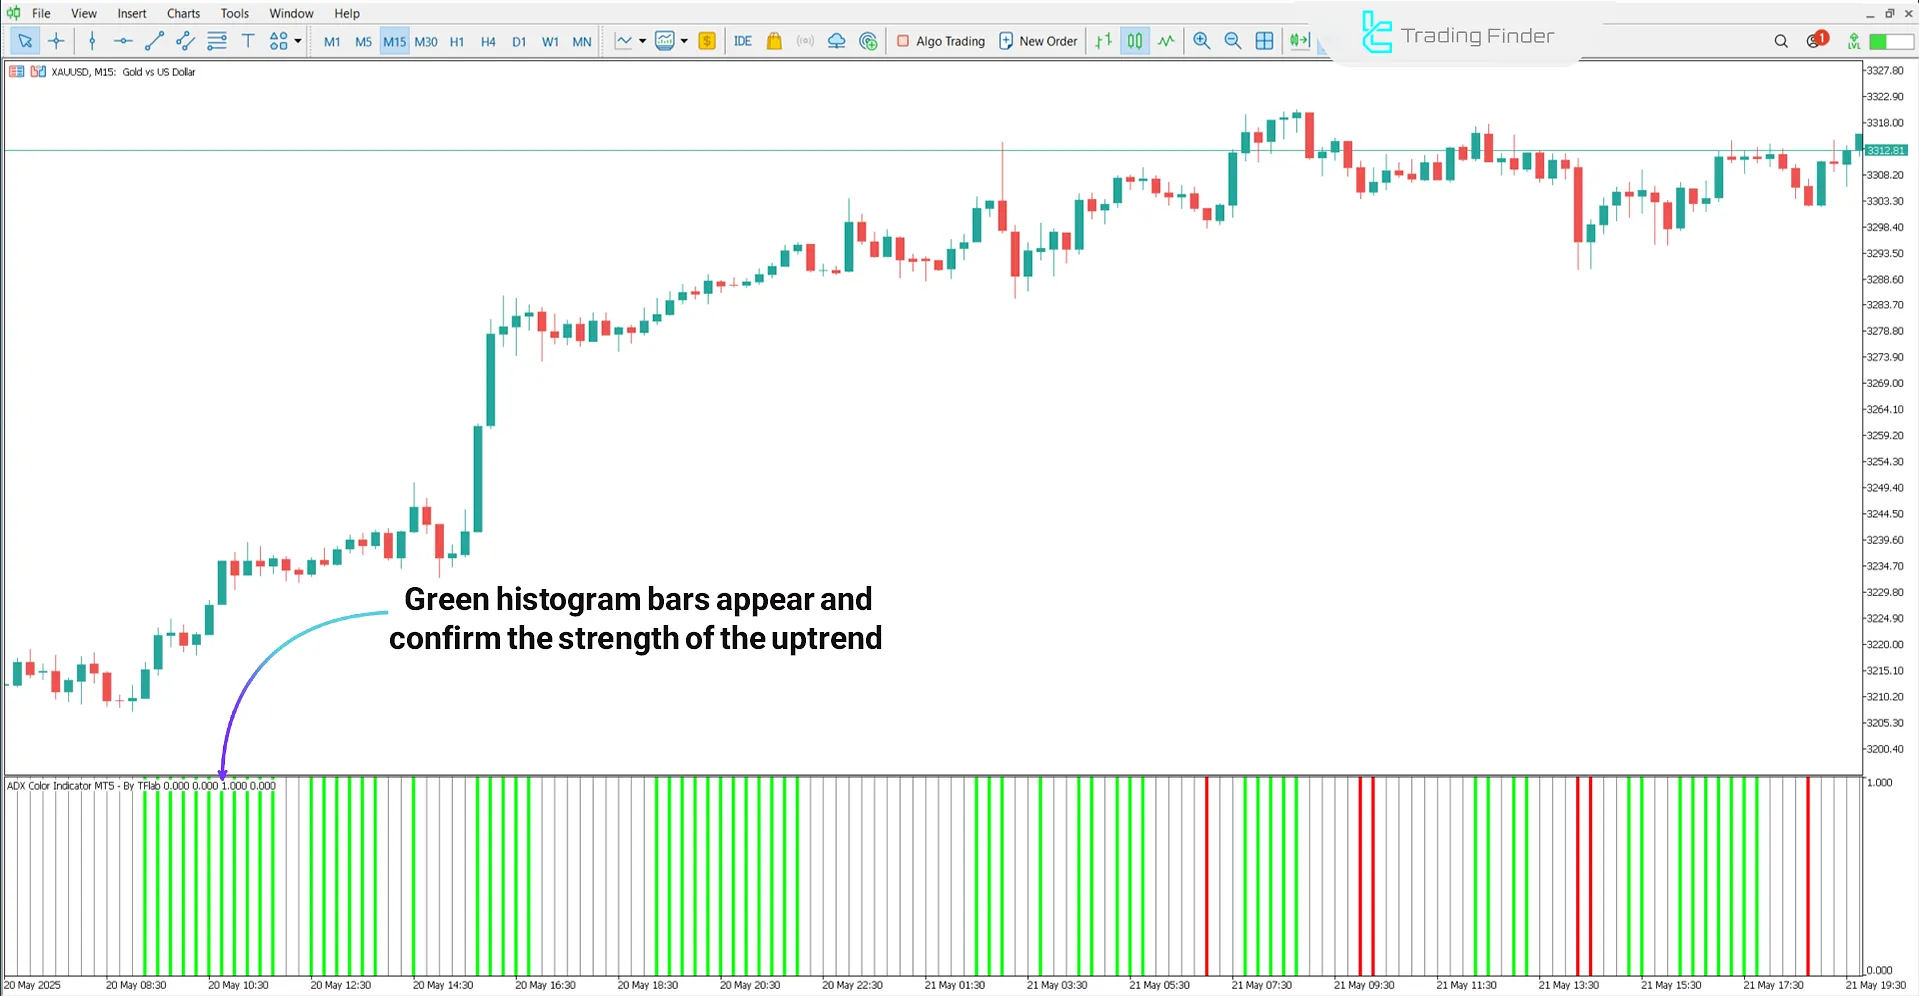
The image below shows the XAU/USD (Gold) chart in a 15-minute timeframe.
The appearance of green bars in the histogram, along with their increasing length, signals bullish trend strength and suggests entry points for Buy trades.

Downtrend Conditions
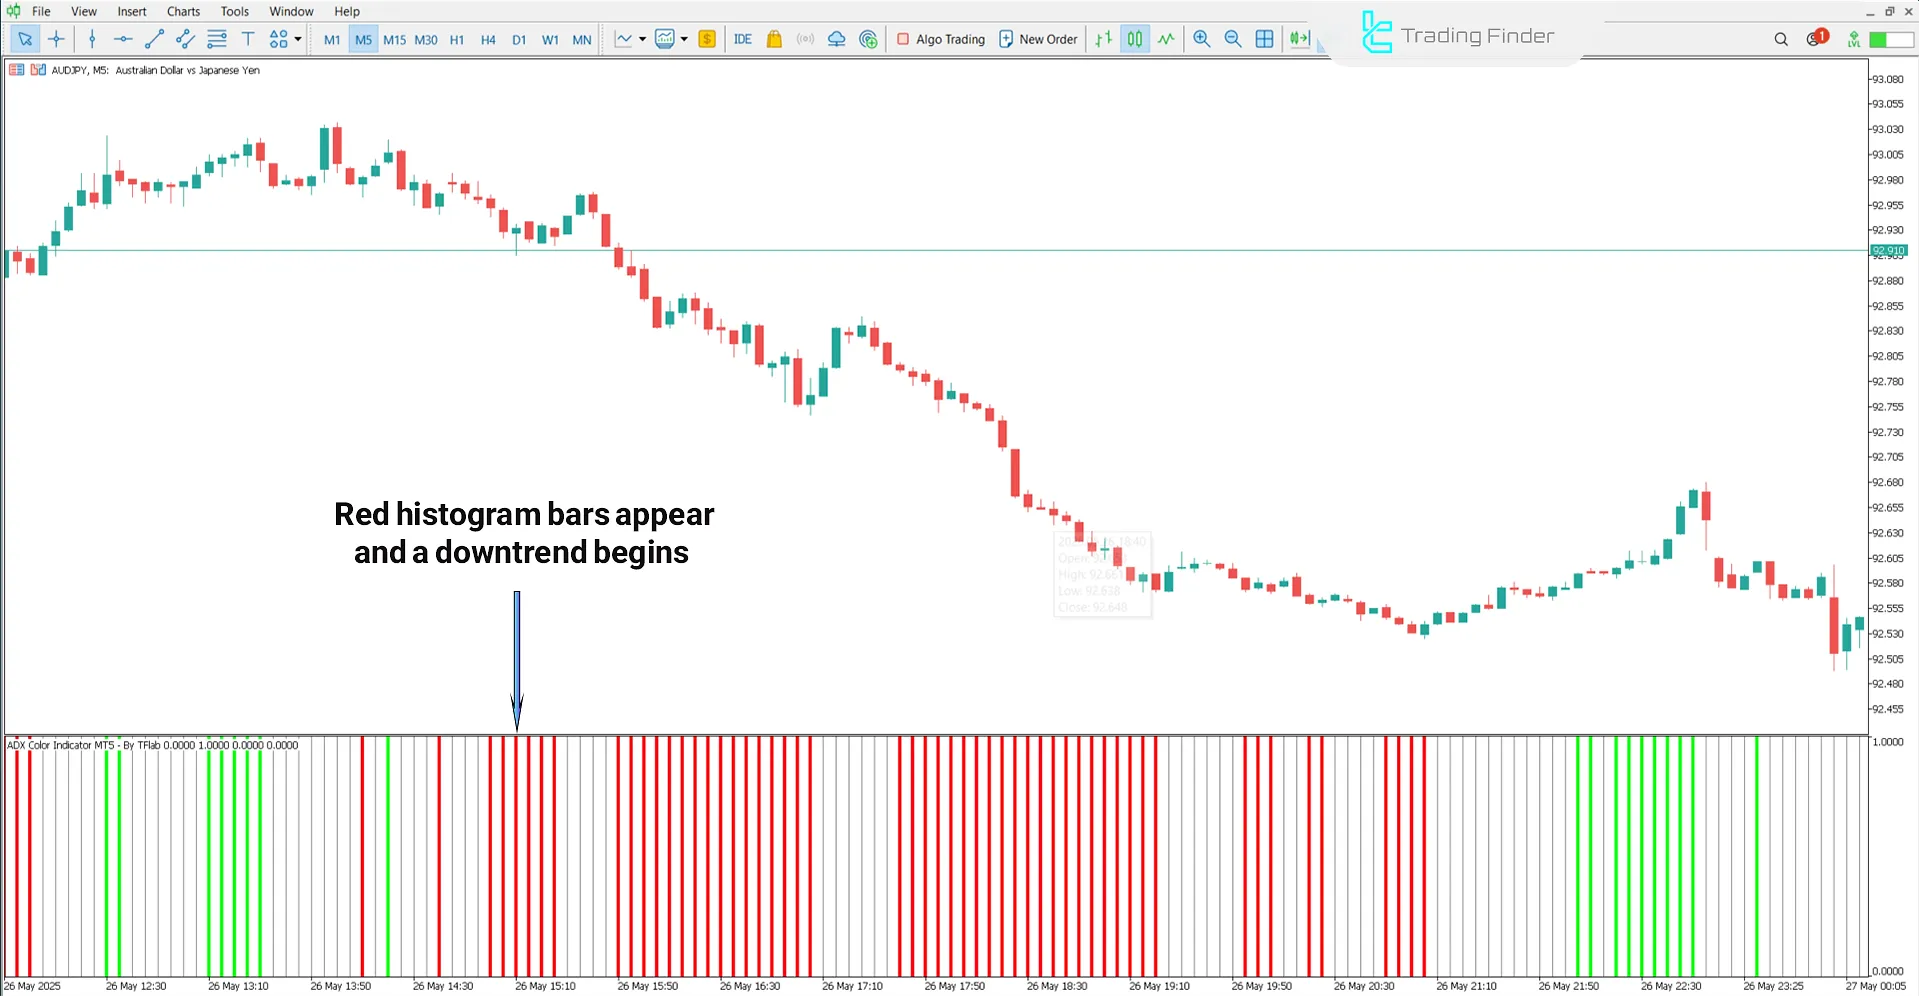
The image below displays the AUD/JPY (Australian Dollar vs. Japanese Yen) index in a 5-minute timeframe. The increasing height of red bars in the histogram indicates selling pressure and bearish trend strength.
Such a scenario typically shows the beginning of a downward movement and a potential entry point for Selling trades.

ADX Color Indicator Settings
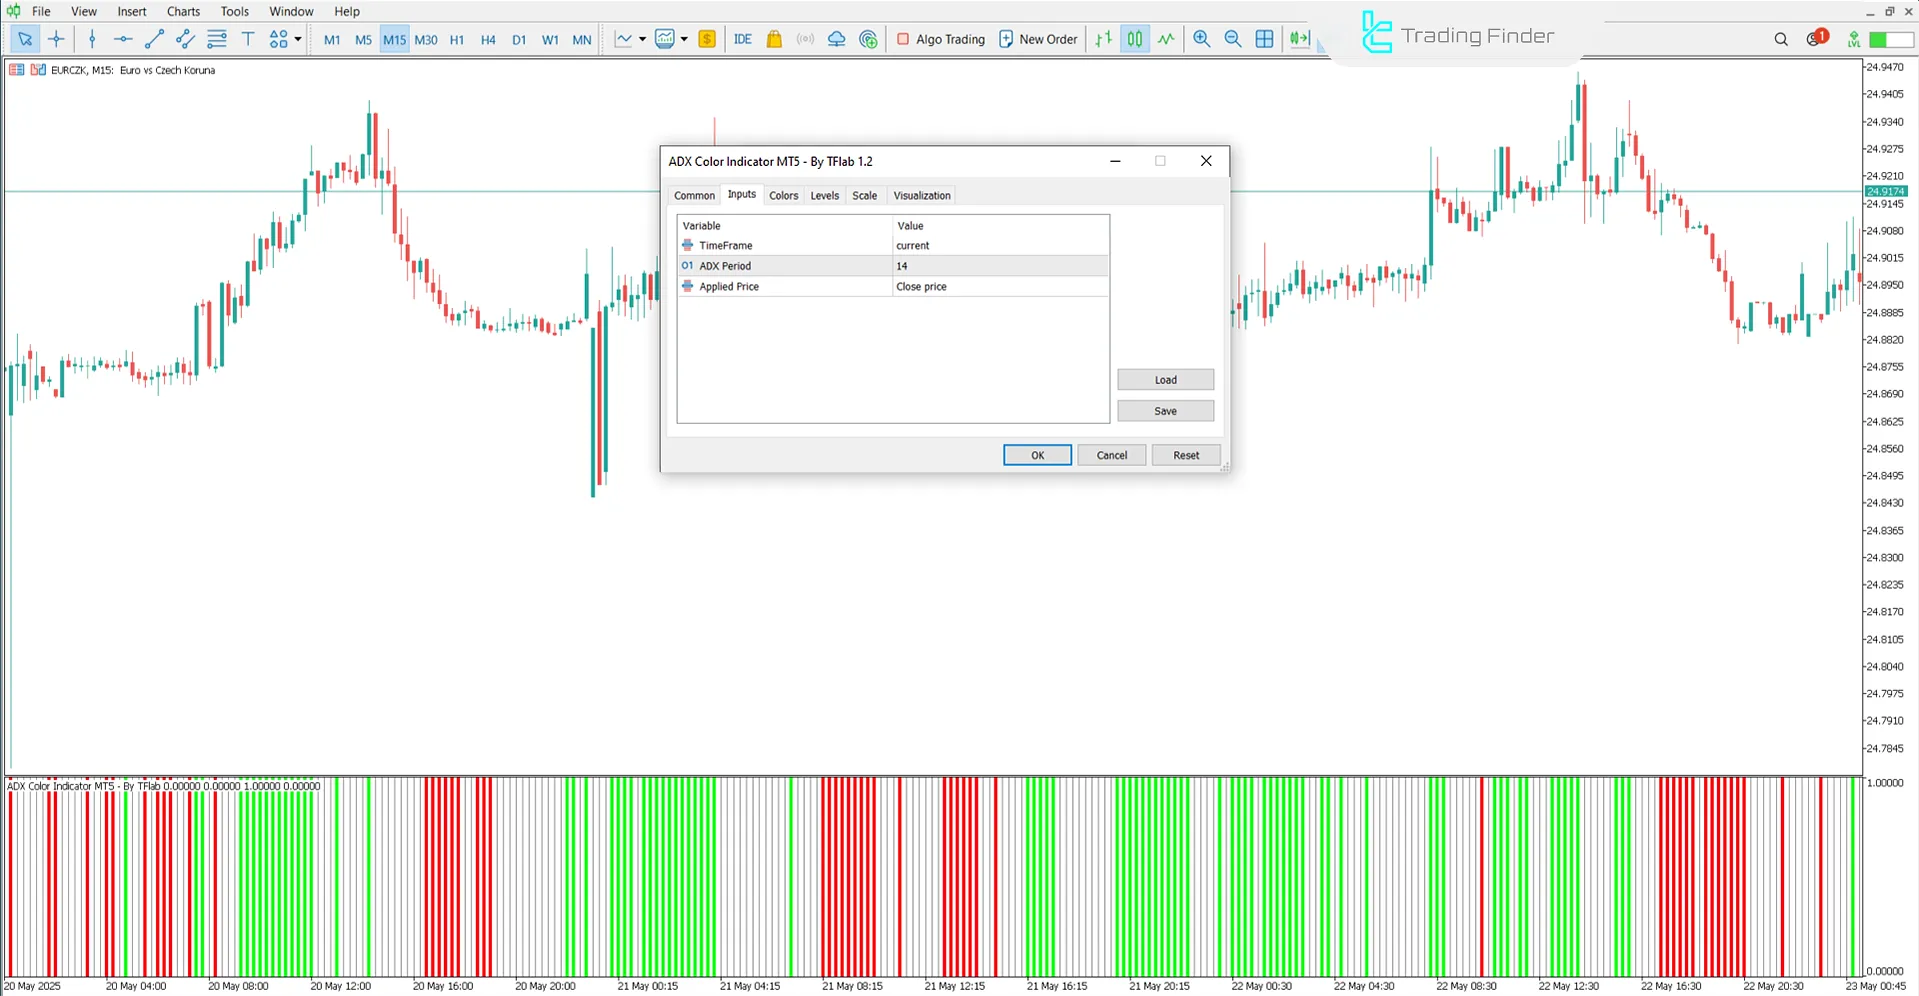
The image below shows thesettings panel of the ADX Color indicator:

- Timeframe: Selected period;
- ADX Period: Calculation period for ADX;
- Applied Price: Price source used.
Conclusion
The ADX Color Indicator visually represents market trend strength and direction using colored bars.
This trading tool enables traders to quickly identify bullish, bearish, or range bound market conditions, allowing them to determine appropriate entry and exit zones.
ADX Color MT5 PDF
ADX Color MT5 PDF
Click to download ADX Color MT5 PDFCan the ADX Color Indicator determine trend direction?
Yes, this trading tool uses different colors to indicate the direction of the trend as well.
When should you not rely on the ADX Color Indicator signals?
In low-volatility markets or during the release of significant news events, this indicator may provide false signals.


