![AI Breakout Bands Indicator for MetaTrader 5 - Free Download [TradingFinder]](https://cdn.tradingfinder.com/image/632590/2-174-en-ai-breakout-bands-mt5-1.webp)
![AI Breakout Bands Indicator for MetaTrader 5 - Free Download [TradingFinder] 0](https://cdn.tradingfinder.com/image/632590/2-174-en-ai-breakout-bands-mt5-1.webp)
![AI Breakout Bands Indicator for MetaTrader 5 - Free Download [TradingFinder] 1](https://cdn.tradingfinder.com/image/632589/2-174-en-ai-breakout-bands-mt5-2.webp)
![AI Breakout Bands Indicator for MetaTrader 5 - Free Download [TradingFinder] 2](https://cdn.tradingfinder.com/image/632585/2-174-en-ai-breakout-bands-mt5-3.webp)
![AI Breakout Bands Indicator for MetaTrader 5 - Free Download [TradingFinder] 3](https://cdn.tradingfinder.com/image/632586/2-174-en-ai-breakout-bands-mt5-4.webp)
The AI Breakout Bands Indicator in technical analysis draws the upper and lower bands around a central line on the price chart and highlights turquoise and purple areas as a dynamic channel.
The computational structure of this trading tool is based on the Kalman Filter, with two states of position and velocity.
The final output of this indicator is then processed through the K-Nearest Neighbor (KNN) smoother, providing nonlinear smoothing that clarifies the price pattern more effectively.
AI Breakout Bands Indicator Table
The general specifications of the AI Breakout Bands Indicator on the MetaTrader 5 platform are presented in the table below:
Indicator Categories: | Trading Assist MT5 Indicators Bands & Channels MT5 Indicators |
Platforms: | MetaTrader 5 Indicators |
Trading Skills: | Intermediate |
Indicator Types: | Reversal MT5 Indicators |
Timeframe: | Multi-Timeframe MT5 Indicators |
Trading Style: | Intraday MT5 Indicators |
Trading Instruments: | Forex MT5 Indicators Crypto MT5 Indicators Stock MT5 Indicators Commodity MT5 Indicators Indices MT5 Indicators Share Stock MT5 Indicators |
AI Breakout Bands Indicator at a Glance
The AI Breakout Bands Indicator is designed with a multi-layered algorithm. In this indicator, the price center of gravity is estimated using a two-dimensional Kalman state model, while the measurement noise “R” is adjusted to define the confidence level in real-time data.
The K-Nearest Neighbor (KNN) smoothing algorithm analyzes market fluctuations using similar historical data and inverse-distance weighting. This approach highlights bullish and bearish waves, delivering a clearer picture of the probable price direction.
Indicator in an Uptrend
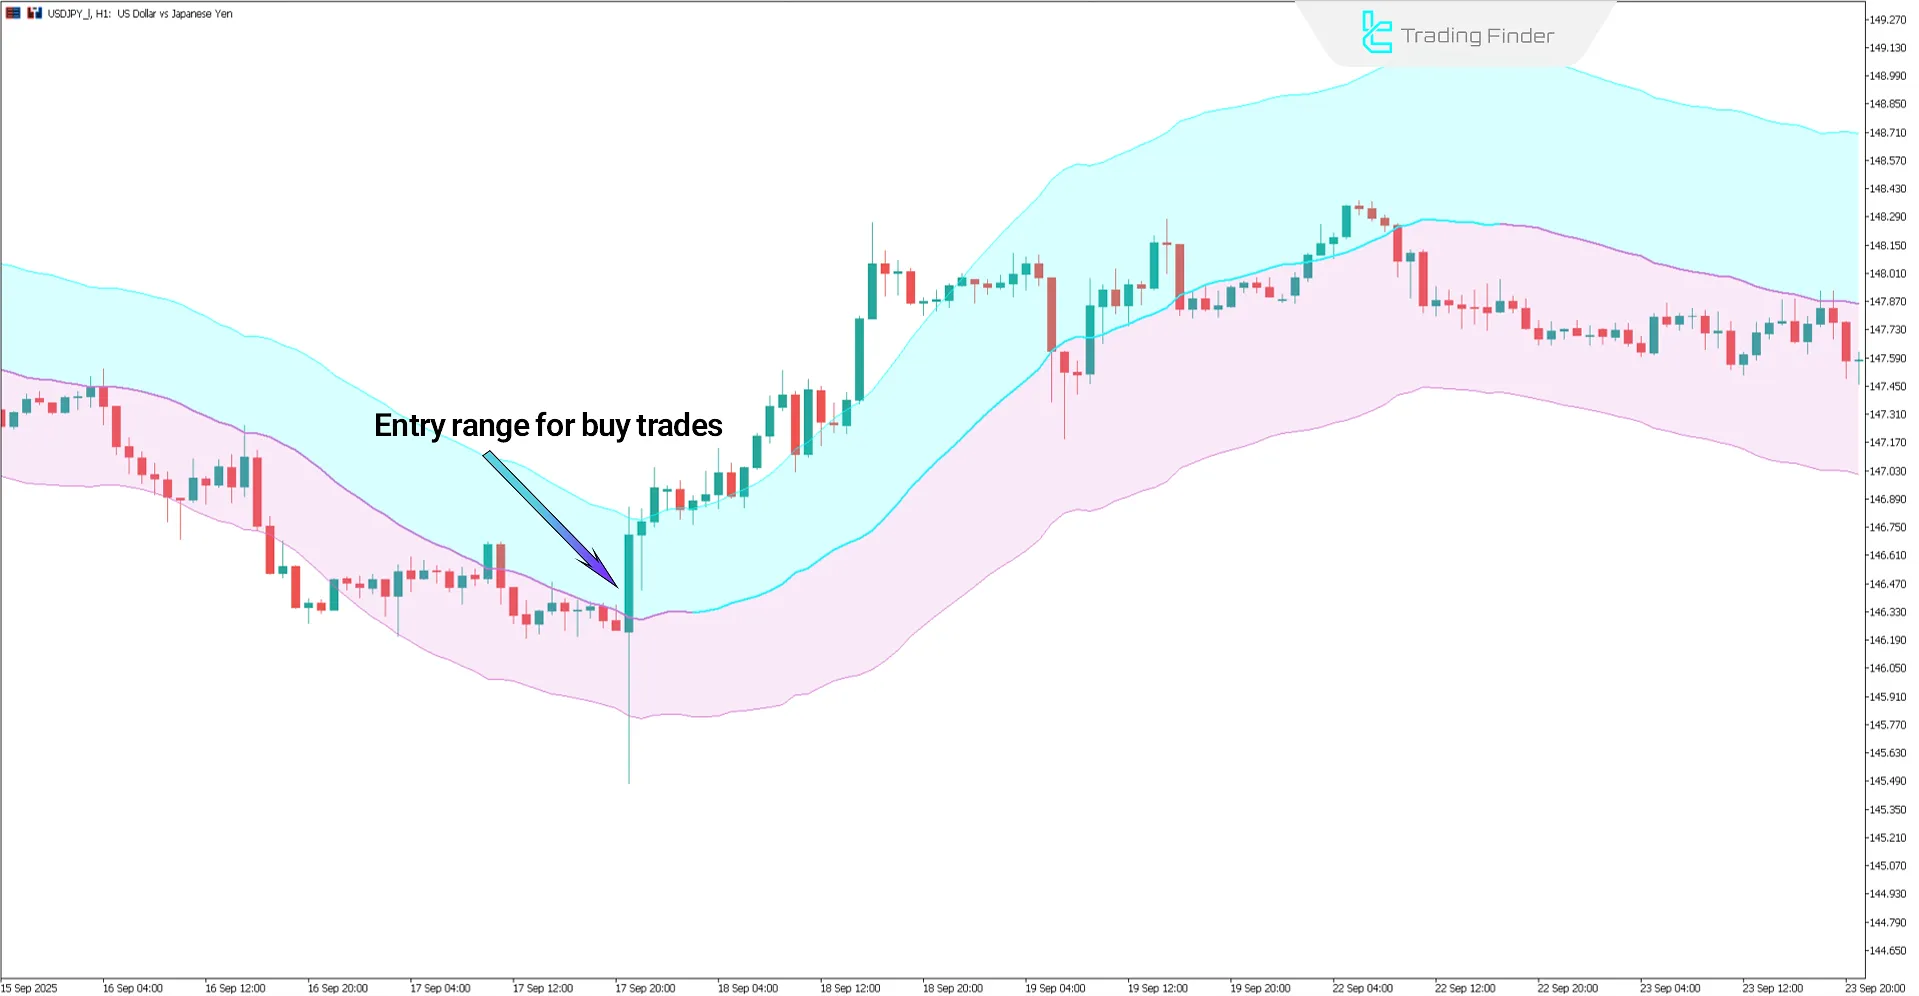
The figure below shows the USD/JPY price chart in the 1-hour timeframe. In an uptrend, candlesticks close above the midline while the slope of this line remains positive.
In this indicator, the consolidation of price in the upper area illustrates buying pressure and movement toward higher levels.
Additionally, when the candlestick body is positioned above the midline, a valid breakout forms, creating a suitable condition for buy trade entries.

Indicator in a Downtrend
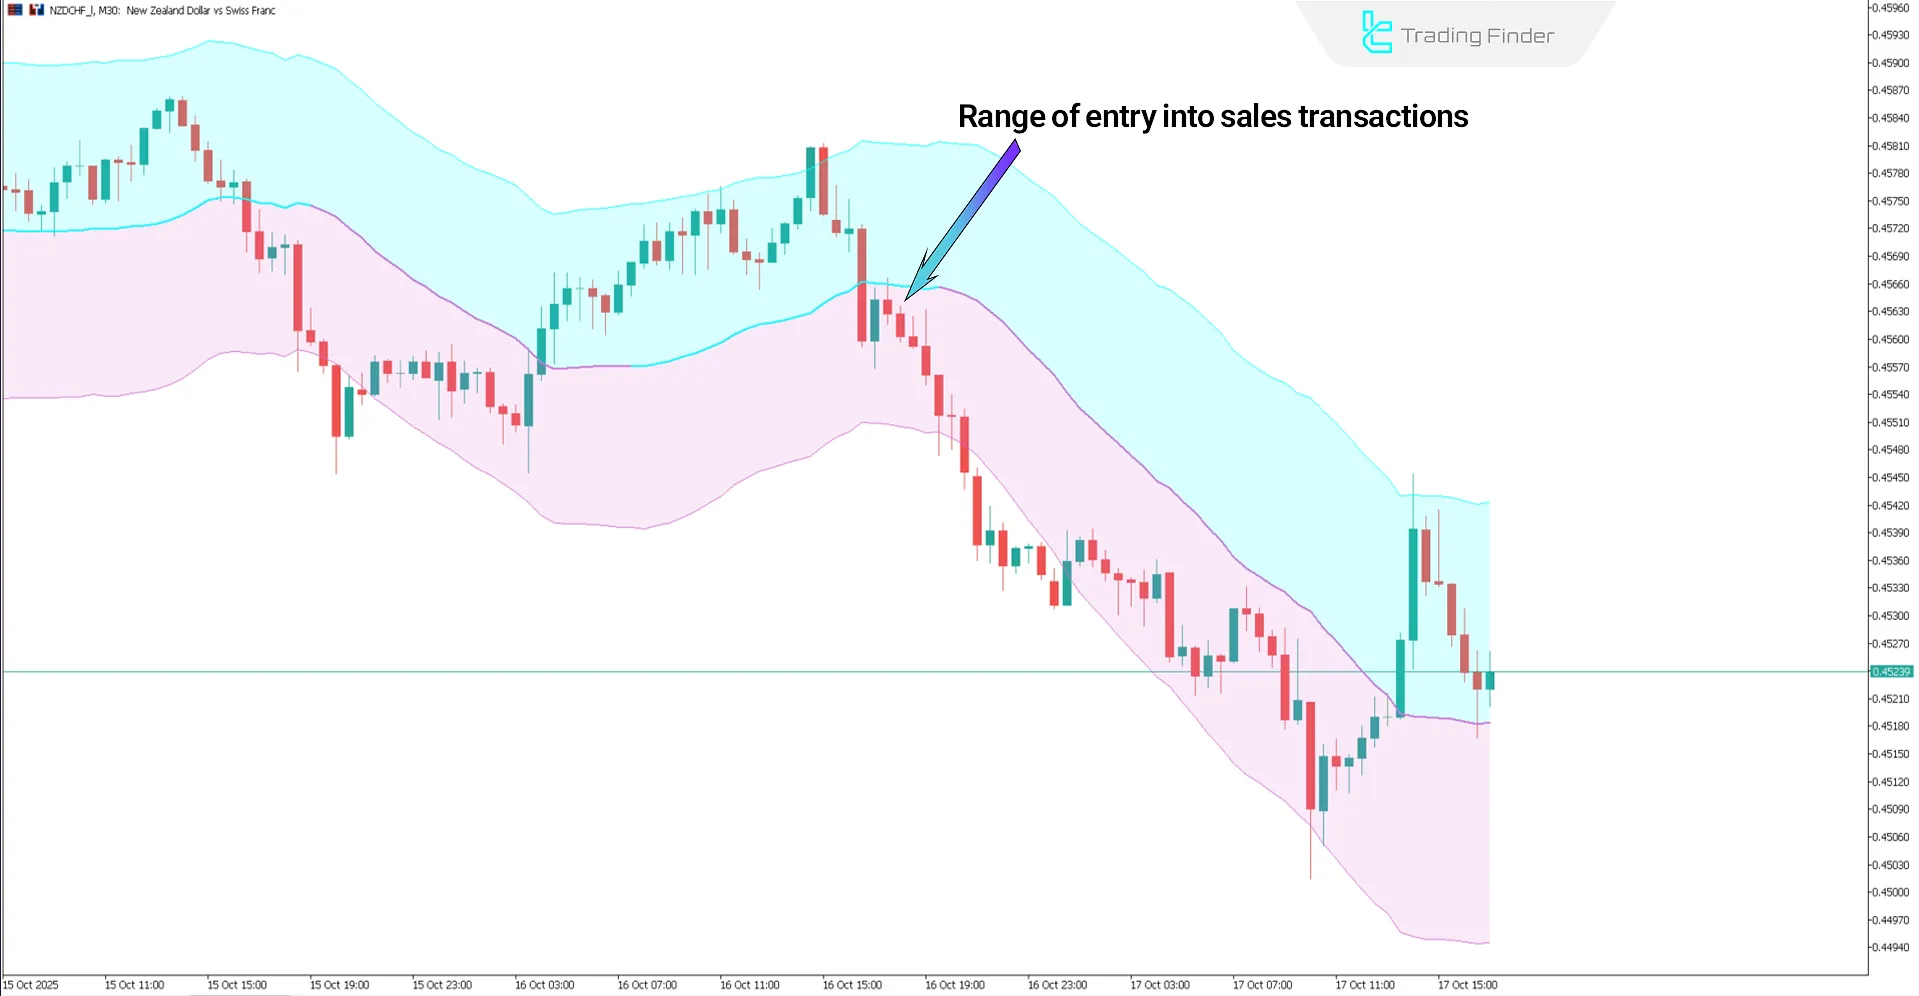
The figure below shows the NZD/CHF price chart in the 30-minute timeframe.
In this indicator, when the candlestick bodies close below the midline and the slope of this line remains negative, a downtrend is established.
Such a structure indicates dominant selling pressure and confirms the continuation of price movement toward lower levels.

AI Breakout Bands Indicator Settings
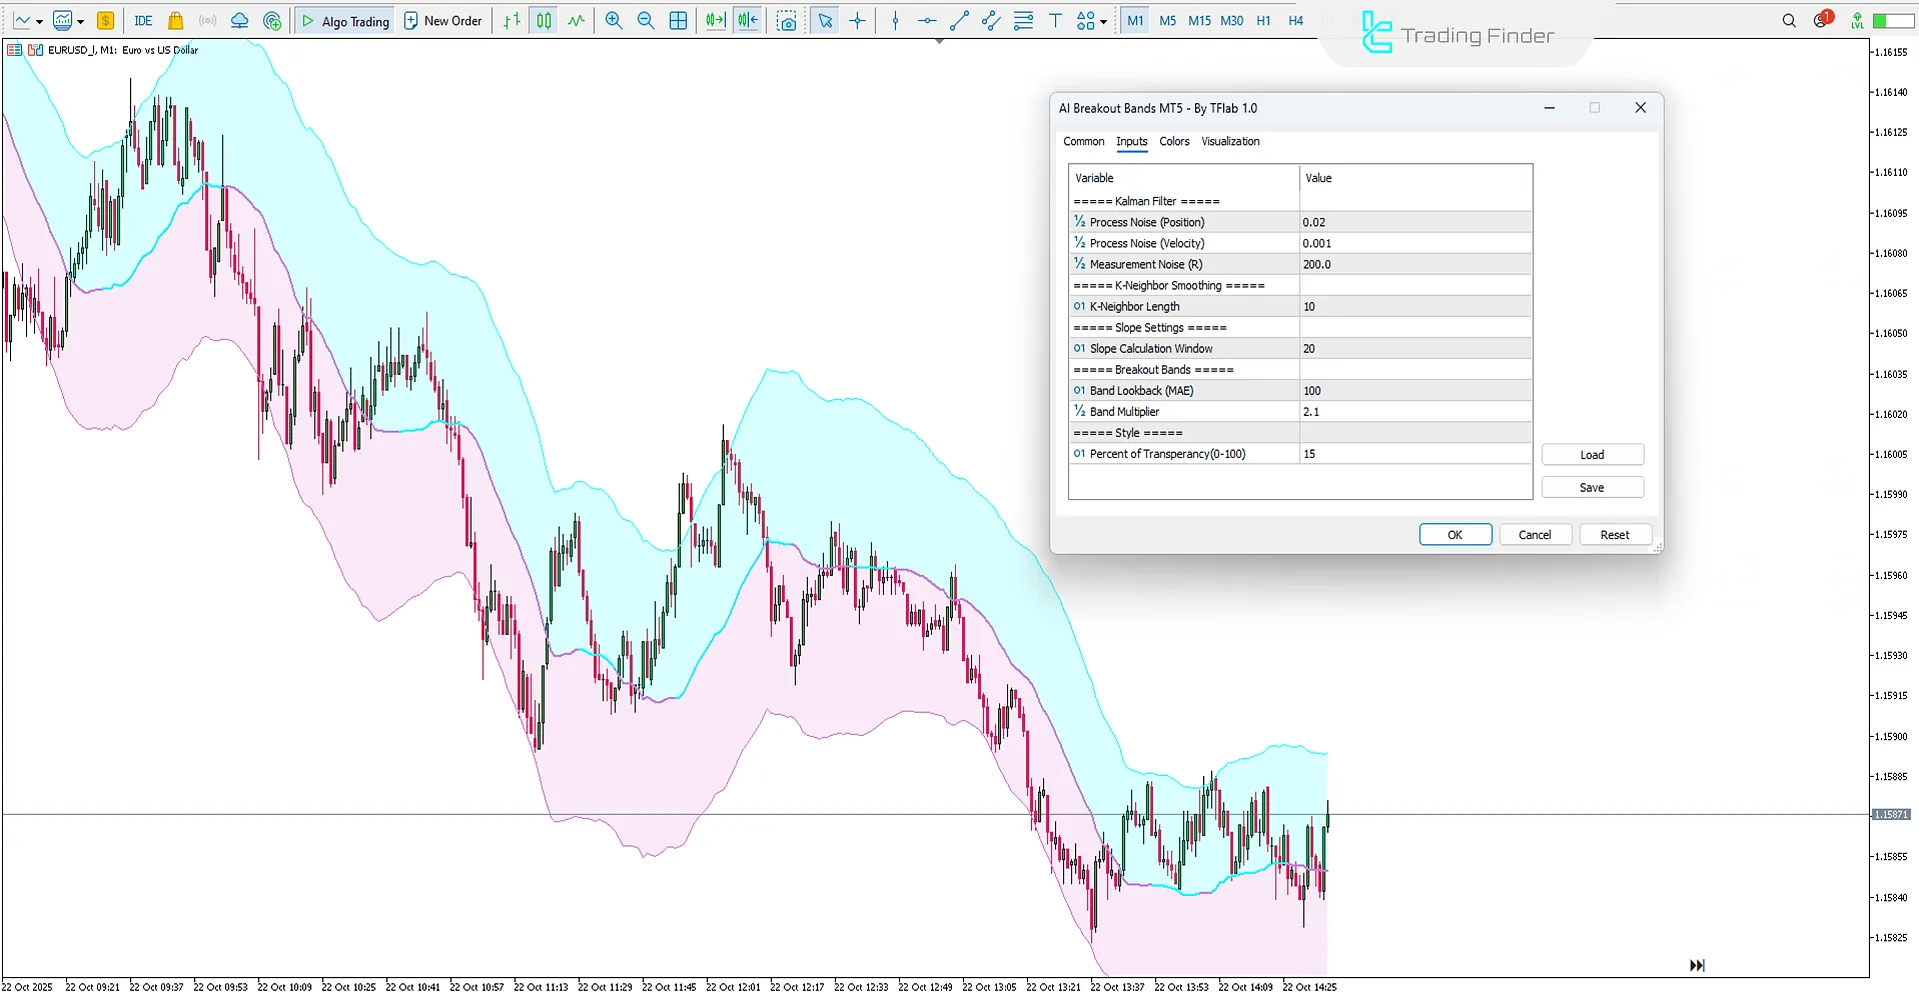
The image below shows the settings panel of the AI Breakout Bands Indicator on the MetaTrader 5 platform:

- Process Noise (Position): Process noise filter (Position)
- Process Noise (Velocity): Velocity estimation using the Kalman Filter (Velocity)
- Measurement Noise (R): Measurement error level of data
- K-Neighbor Length: Display of K-neighborhood length
- Slope Calculation Window: Window for slope calculation
- Band Lookback (MAE): Number of candlesticks for calculating breakout bands using the Mean Absolute Error criterion
- Band Multiplier: Band multiplier display
- Percent of Transparency (0-100): Graphic transparency level (0 to 100)
- Bullish Trend: Assigned color for bullish phase
- Bearish Trend: Assigned color for bearish phase
Conclusion
The AI Breakout Bands Indicator is an advanced analytical tool based on dynamic bands.
By combining the Kalman Filter and the KNN smoother, this indicator reconstructs market structure in real time.
Its primary feature is tracking price behavior adaptively, identifying valid breakout zones with high accuracy, and clarifying the probable direction of price movement.
AI Breakout Bands Indicator for MetaTrader 5 PDF
AI Breakout Bands Indicator for MetaTrader 5 PDF
Click to download AI Breakout Bands Indicator for MetaTrader 5 PDFWhat is the structure of the AI Breakout Bands Indicator?
This indicator is built on dynamic bands and reconstructs the real price path in real time by combining the Kalman Filter and the K-Nearest Neighbor (KNN) smoother.
What is the function of the KNN smoother in the AI Breakout Bands Indicator?
In this indicator, the KNN algorithm weights similar historical data based on inverse distance.


