![All In One Divergence Indicator for MetaTrader 5 Download – Free – [TFlab]](https://cdn.tradingfinder.com/image/299425/4-76-en-all-divergence-mt5-1.webp)
![All In One Divergence Indicator for MetaTrader 5 Download – Free – [TFlab] 0](https://cdn.tradingfinder.com/image/299425/4-76-en-all-divergence-mt5-1.webp)
![All In One Divergence Indicator for MetaTrader 5 Download – Free – [TFlab] 1](https://cdn.tradingfinder.com/image/299424/4-76-en-all-divergence-mt5-2.webp)
![All In One Divergence Indicator for MetaTrader 5 Download – Free – [TFlab] 2](https://cdn.tradingfinder.com/image/299422/4-76-en-all-divergence-mt5-3.webp)
![All In One Divergence Indicator for MetaTrader 5 Download – Free – [TFlab] 3](https://cdn.tradingfinder.com/image/299423/4-76-en-all-divergence-mt5-4.webp)
On June 22, 2025, in version 2, alert/notification functionality was added to this indicator
Among MetaTrader 5 indicators, the All In One Divergence Indicator is recognized as an advanced and multi-functional tool that enables automatic detection of price divergences.
This indicator, using eight powerful oscillators, including RSI, CCI, and AO, allows for the analysis of regular and hidden divergences, providing precise buy and sell entry signals.
All In One Divergence Indicator Table
The table below provides a summary of this indicator’s specifications:
Indicator Categories: | Oscillators MT5 Indicators Signal & Forecast MT5 Indicators Trading Assist MT5 Indicators |
Platforms: | MetaTrader 5 Indicators |
Trading Skills: | Intermediate |
Indicator Types: | Leading MT5 Indicators |
Timeframe: | Multi-Timeframe MT5 Indicators |
Trading Style: | Day Trading MT5 Indicators |
Trading Instruments: | Forex MT5 Indicators Crypto MT5 Indicators Stock MT5 Indicators Indices MT5 Indicators Forward MT5 Indicators Share Stock MT5 Indicators |
Indicator Overview
One of the key advantages of this indicator is its default setting for detecting Awesome Oscillator (AO) divergence, which is a reliable tool for analyzing market momentum.
The All In One Divergence Indicator can be used across all timeframes, displaying clear color-coded trends to distinguish between bullish and bearish movements. In this oscillator:
- Bullish divergences are shown in blue
- Bearish divergences are shown in pink
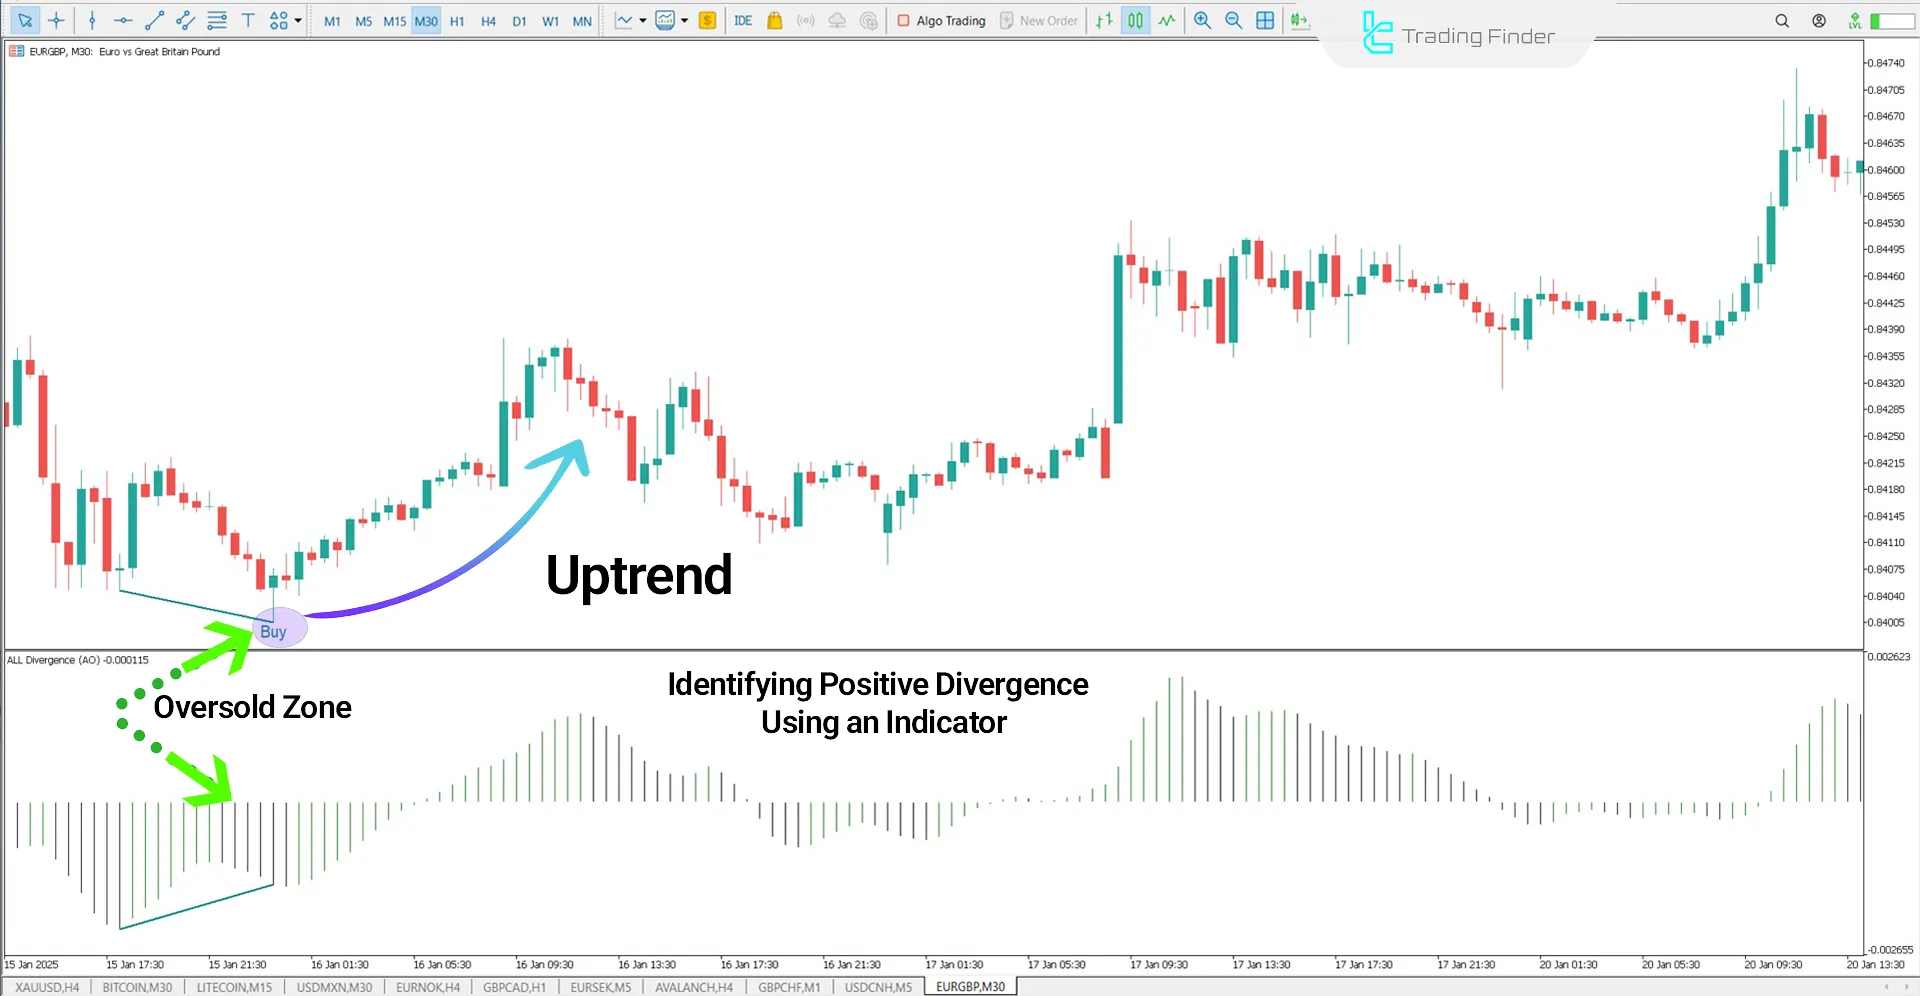
Indicator in an Uptrend
The ALO Divergence Indicator detects a bullish divergence between the price and the AO oscillator, generating a buy signal.
An increase in green bar volume within the indicator confirms the strengthening of the uptrend and validates the momentum behind price movement.

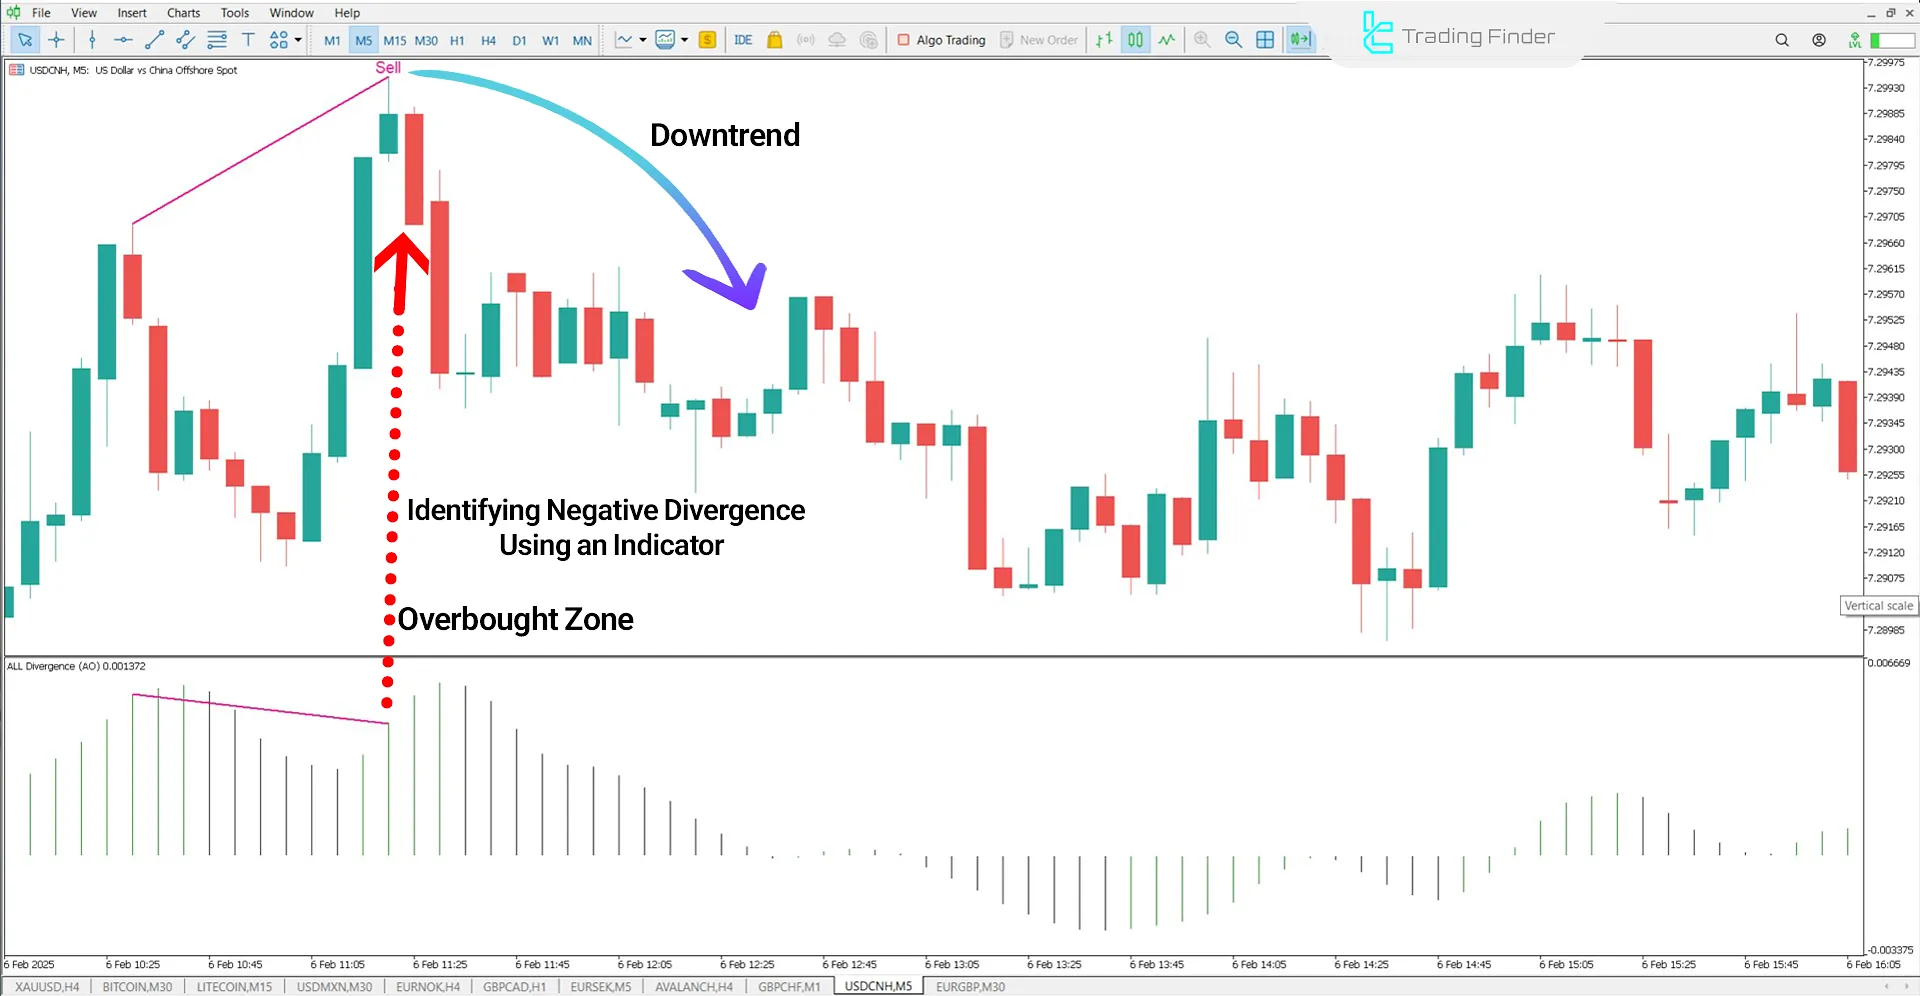
Indicator in a Downtrend
In the USD/CNH downtrend, the ALO Divergence Indicator detects a bearish divergence, displaying a pink divergence line to signal a sell entry.
As the oscillator’s red bar volume increases, it confirms stronger selling pressure, validating the continuation of the price decline.

Indicator Settings
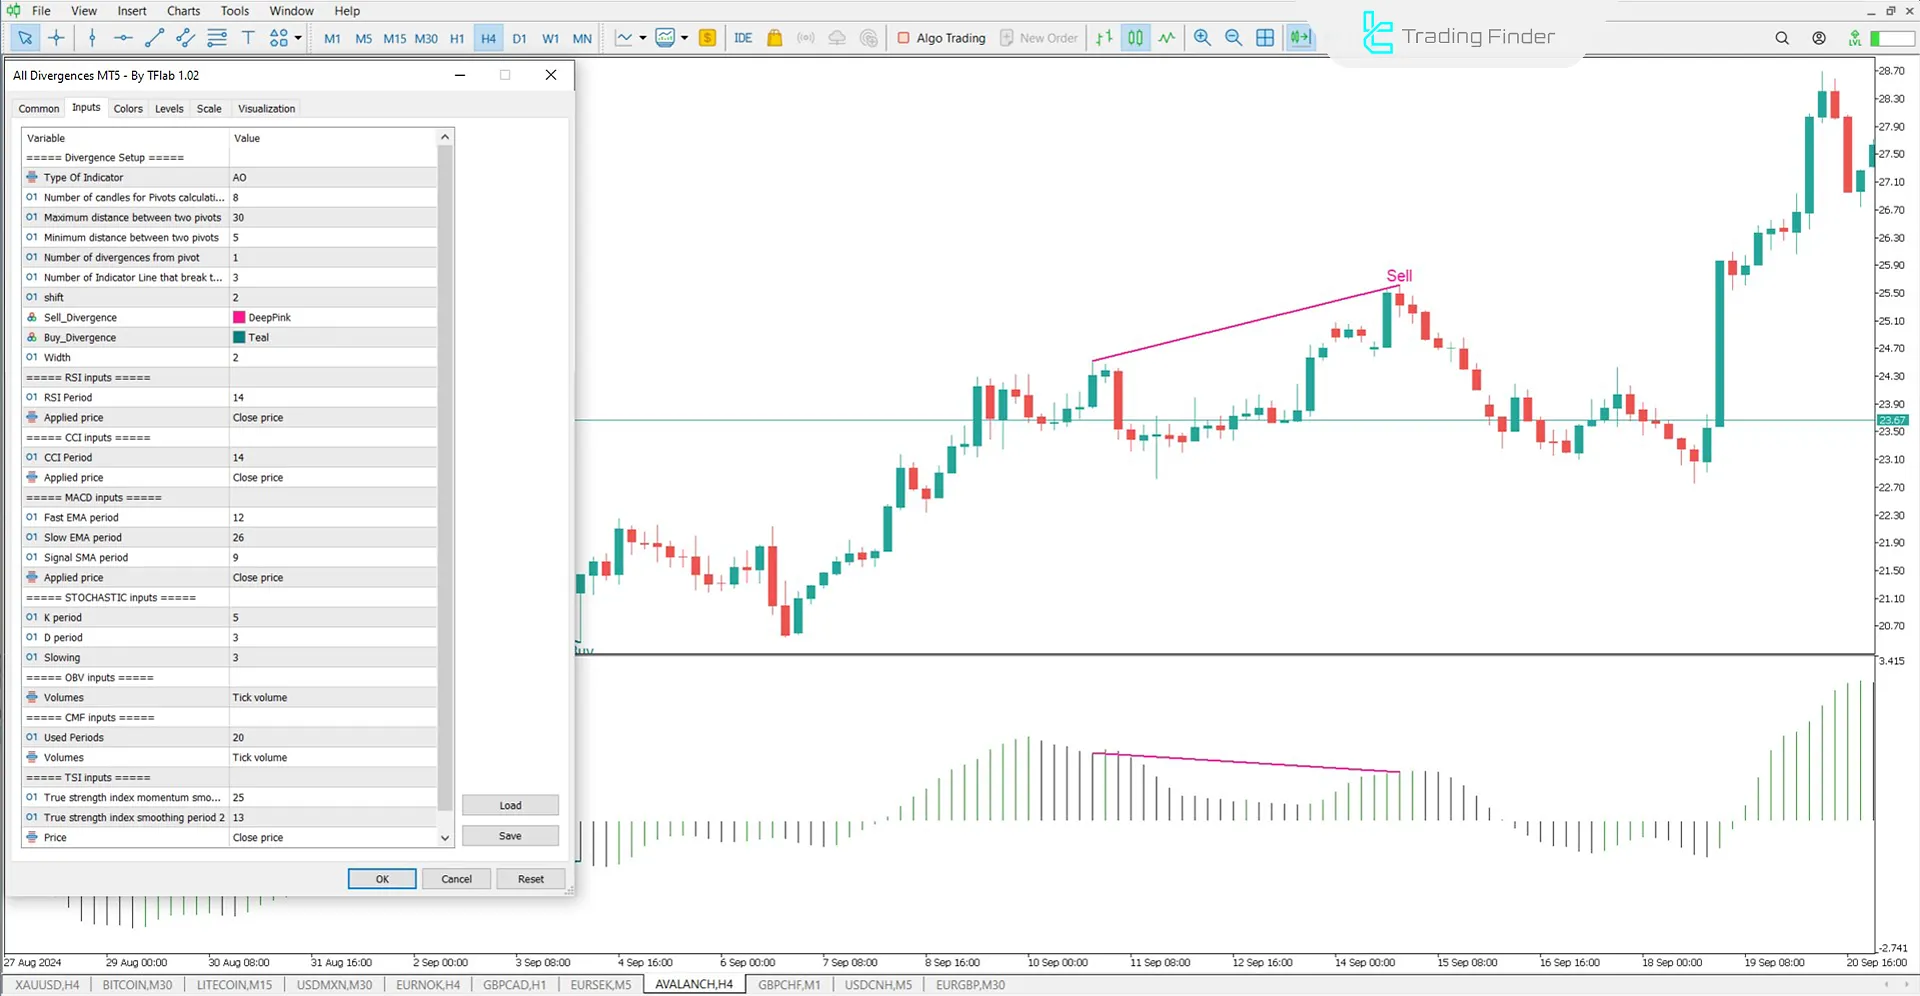
The full parameter settings of this signal and forecast MT5 indicator are displayed in the image below:a

- Type Of Indicator: Indicator type
- Number of candles for Pivots calculation: Number of candles used for pivot calculation
- Maximum distance between two pivots: Maximum distance between two pivots
- Minimum distance between two pivots: Minimum distance between two pivots
- Number of divergences from pivot: Number of divergences from a pivot
- Number of Indicator Lines that break the Divergence: Number of indicator lines at the divergence breakpoint
- Shift: Price shift
- Sell Divergence: Sell divergence signal color
- Buy Divergence: Buy divergence signal color
- Width: Line thickness
- RSI Period: RSI calculation period
- Applied price: Applied price
- CCI Period: CCI calculation period
- MACD inputs: MACD inputs
- Fast EMA period: Fast EMA period
- Slow EMA period: Slow EMA period
- Signal SMA period: Signal SMA period
- STOCHASTIC inputs: Stochastic oscillator inputs
- K period: K period in stochastic
- D period: D period in stochastic
- Slowing: Slowing factor in stochastic
- OBV inputs: OBV inputs
- CMF inputs: CMF inputs
- Used Periods: Selected time periods
- Type Of Volumes: The type of volume data used
- TSI inputs: True Strength Index (TSI) inputs
- True strength index momentum smoothing period 1: First smoothing period of TSI
- True strength index smoothing period 2: Second smoothing period of TSI
- Price: Price setting used in calculations
Conclusion
Unlike many divergence indicators that rely on a single oscillator, the ALO Divergence Indicator integrates multiple oscillators, including RSI, CCI, MACD, and AO.
The ALO Divergence Indicator detects both hidden and regular divergences, providing high-precision trading signals directly on the chart.
All In One Divergence MT5 PDF
All In One Divergence MT5 PDF
Click to download All In One Divergence MT5 PDFCan the ALO Divergence Indicator be used in all timeframes?
Yes, this indicator is applicable across all timeframes, making it suitable for both short-term and long-term analysis.
How are divergence signals color-coded in this indicator?
- Bullish divergence (buy signal) is displayed in blue
- Bearish divergence (sell signal) is displayed in pink


