![Anti Alternate Shark Harmonic Pattern Indicator MT5 - [TradingFinder]](https://cdn.tradingfinder.com/image/371283/2-63-en-anti-alternate-shark-harmonic-pattern-mt5-1.webp)
![Anti Alternate Shark Harmonic Pattern Indicator MT5 - [TradingFinder] 0](https://cdn.tradingfinder.com/image/371283/2-63-en-anti-alternate-shark-harmonic-pattern-mt5-1.webp)
![Anti Alternate Shark Harmonic Pattern Indicator MT5 - [TradingFinder] 1](https://cdn.tradingfinder.com/image/371287/2-63-en-anti-alternate-shark-harmonic-pattern-mt5-2.webp)
![Anti Alternate Shark Harmonic Pattern Indicator MT5 - [TradingFinder] 2](https://cdn.tradingfinder.com/image/371282/2-63-en-anti-alternate-shark-harmonic-pattern-mt5-3.webp)
![Anti Alternate Shark Harmonic Pattern Indicator MT5 - [TradingFinder] 3](https://cdn.tradingfinder.com/image/371286/2-63-en-anti-alternate-shark-harmonic-pattern-mt5-4.webp)
On July 2, 2025, in version 2, alert/notification and signal functionality was added to this indicator
The Anti Alternate Shark Harmonic Pattern Indicator is designed to detect deep reversal zones and price reactions in overbought or oversold market conditions.
This MetaTrader 5 tool identifies precise reversal points in technical analysis by tracking structural changes in wave direction and formation.
Anti Alternate Shark Harmonic Pattern Specifications Table
The following table presents the specifications of the Anti Alternate Shark Harmonic Pattern Indicator.
Indicator Categories: | Price Action MT5 Indicators Harmonic MT5 Indicators Candle Sticks MT5 Indicators |
Platforms: | MetaTrader 5 Indicators |
Trading Skills: | Intermediate |
Indicator Types: | Trend MT5 Indicators Reversal MT5 Indicators |
Timeframe: | Multi-Timeframe MT5 Indicators |
Trading Style: | Intraday MT5 Indicators |
Trading Instruments: | Forex MT5 Indicators Crypto MT5 Indicators Stock MT5 Indicators |
Indicator Overview
The Anti Alternate Shark Harmonic Pattern usually forms at the end of intense and volatile price movements and is a potential warning signal for trend reversal.
To validate the harmonic pattern, the following Fibonacci ratios must be analyzed:
· Wave AB vs. XA: AB should retrace 1.13 to 1.618 of XA;
· Wave BC: Typically extends 1.618 to 2.24 of AB;
· Wave CD: Point D defines the potential reversal zone, commonly located at 0.886 to 1.13 of XA; this point is considered the key entry area.
Uptrend Conditions
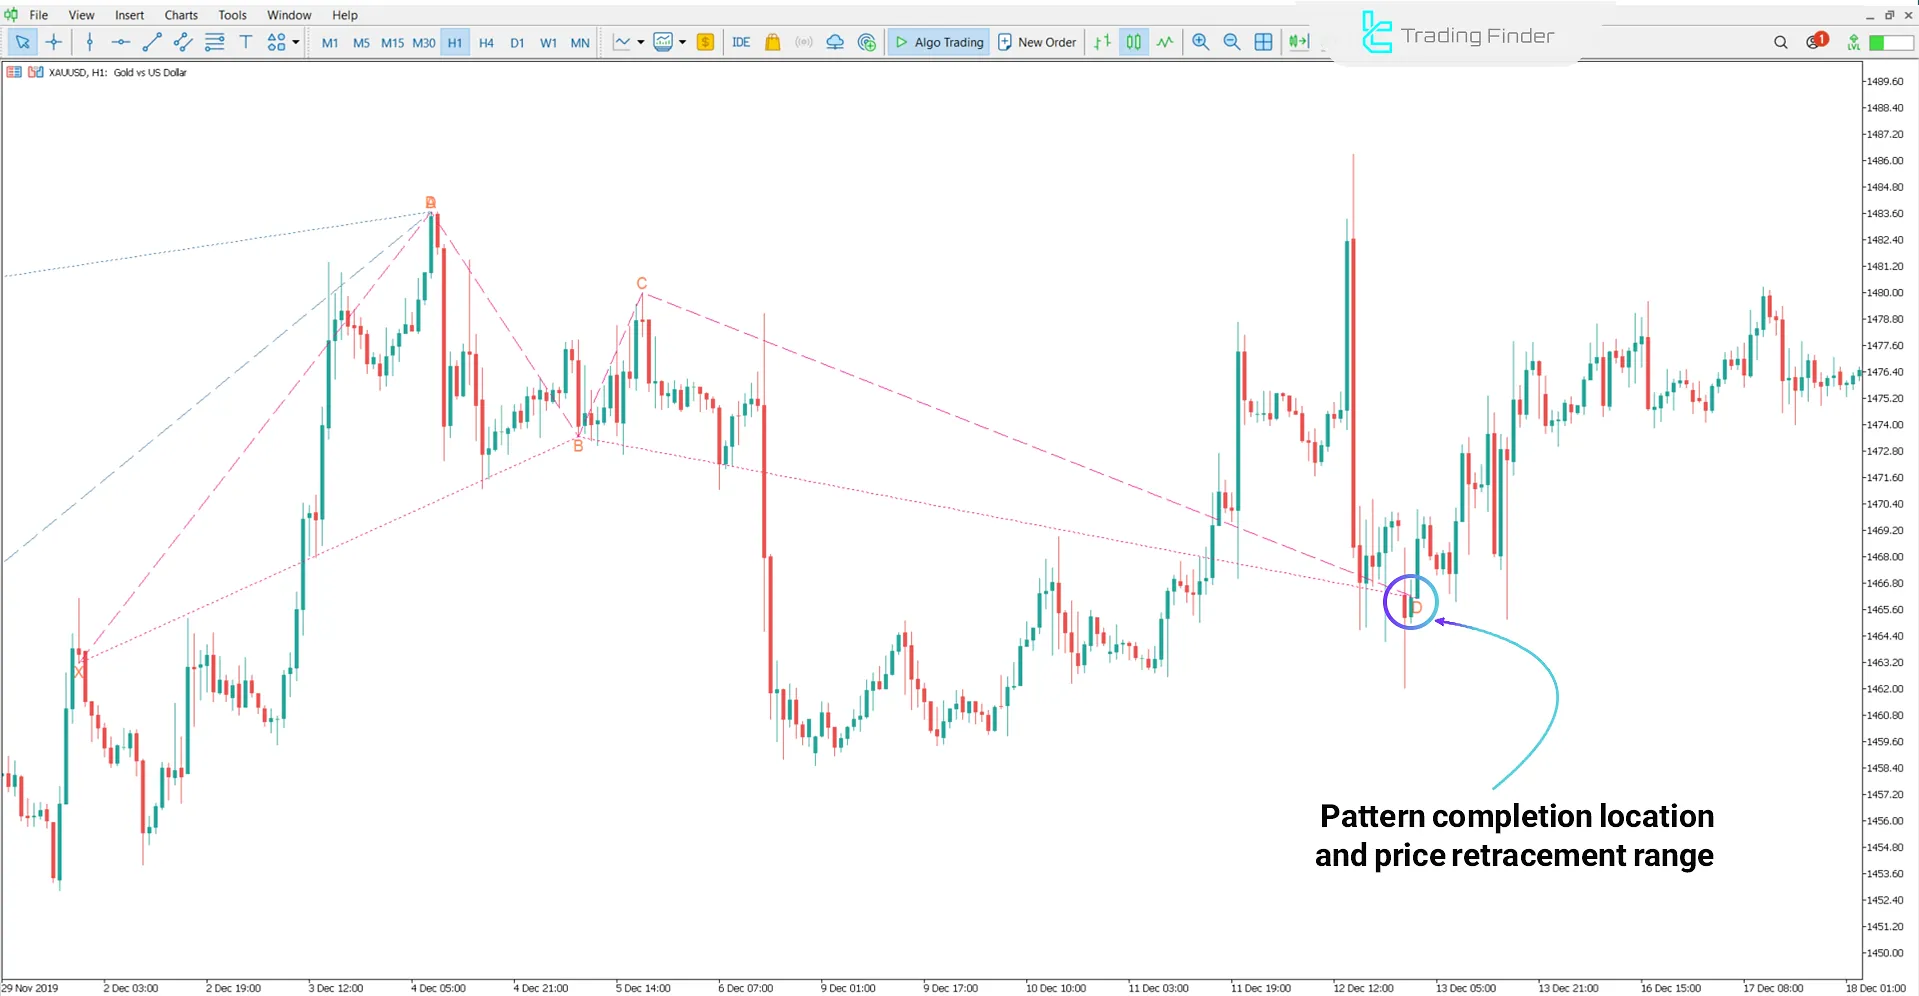
On the 1-hour chart of XAUUSD (Gold), a bullish Anti Alternate Shark Pattern forms. When point D lies within wave XA's 0.886 to 1.13 Fibonacci zone, it identifies a key price reversal area.
If the price stabilizes within this range, the likelihood of a bullish correction toward level C increases significantly.

Downtrend Conditions
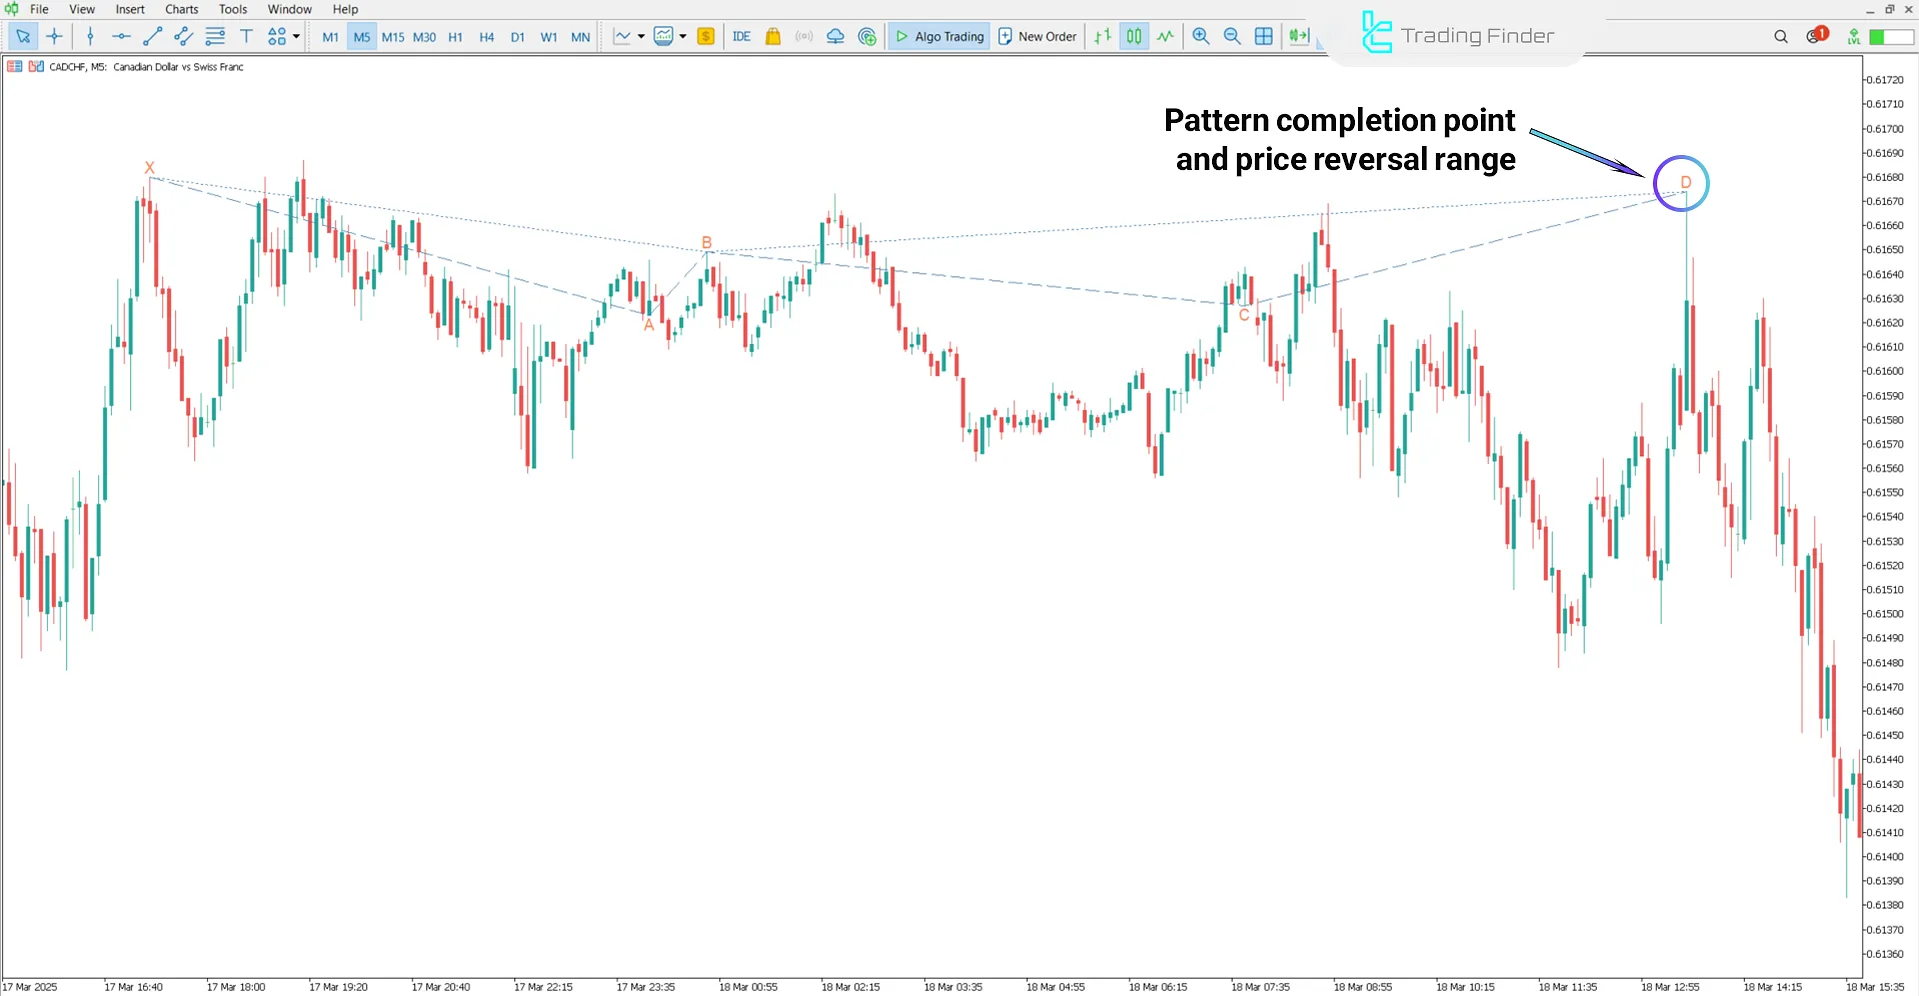
On the 5-minute chart of CAD/CHF, during the formation of a bearish Anti Alternate Shark Harmonic Pattern, point D falls within the 0.886 to 1.13 Fibonacci range of wave XA.
Following an upward move, this area is identified as a key reversal zone and often serves as an entry point for sell positions.

Anti Alternate Shark Harmonic Pattern Indicator Settings
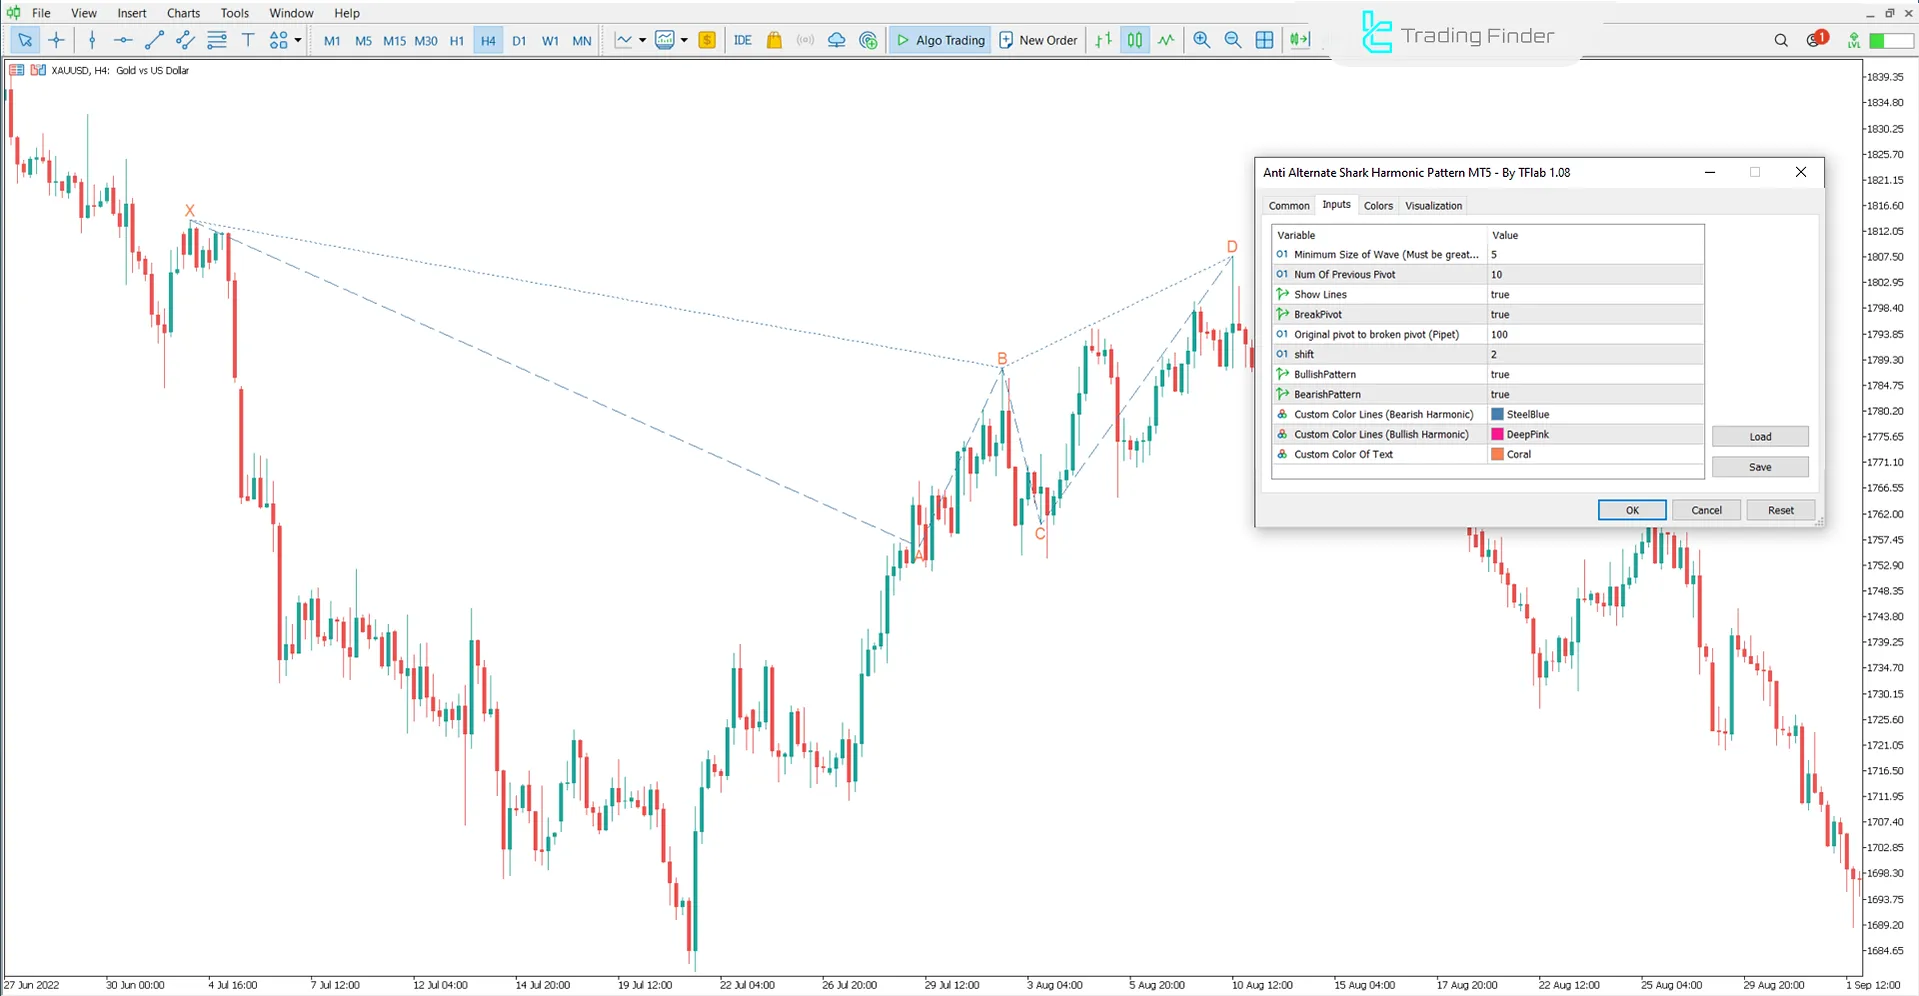
The following image shows the settings panel of the Anti Alternate Shark Harmonic Pattern Indicator, along with the configurable options:

- Minimum Size Of Wave: Minimum wavelength
- Num Of Previous Pivot: Number of previous pivots to analyze
- Show Lines: Show pattern lines
- Break Pivot: Pivot breakout
- Original pivot to broken pivot (Pipet): Distance between original and broken pivot
- Shift: Horizontal shift
- Bullish Pattern: Enable bullish pattern detection
- Bearish Pattern: Enable bearish pattern detection
- Custom Color Lines (Bearish Harmonic): Custom color for bearish harmonic lines
- Custom Color Lines (Bullish Harmonic): Custom color for bullish harmonic lines
- Custom Color Of Text: Custom color for on-chart text labels
Conclusion
The Anti Alternate Shark Harmonic Pattern Indicator is a specialized tool for identifying price reversal zones based on Fibonacci ratios and the XABCD harmonic Pattern.
Anti Alternate Shark Harmonic MT5 PDF
Anti Alternate Shark Harmonic MT5 PDF
Click to download Anti Alternate Shark Harmonic MT5 PDFWhich platform supports the Anti Alternate Shark Harmonic Pattern Indicator?
This indicator is developed for use on the MetaTrader 5 platform.
What is the core structure of the Anti Alternate Shark Harmonic Pattern Indicator?
The indicator is based on the XABCD harmonic formation and focuses on precise analysis of Fibonacci ratios within market waves.


