![Anti Butterfly Harmonic Pattern Indicator MT5 Download - [TFlab]](https://cdn.tradingfinder.com/image/362107/2-61-en-anti-butterfly-harmonic-pattern-mt5-1.webp)
![Anti Butterfly Harmonic Pattern Indicator MT5 Download - [TFlab] 0](https://cdn.tradingfinder.com/image/362107/2-61-en-anti-butterfly-harmonic-pattern-mt5-1.webp)
![Anti Butterfly Harmonic Pattern Indicator MT5 Download - [TFlab] 1](https://cdn.tradingfinder.com/image/362108/2-61-en-anti-butterfly-harmonic-pattern-mt5-2.webp)
![Anti Butterfly Harmonic Pattern Indicator MT5 Download - [TFlab] 2](https://cdn.tradingfinder.com/image/362105/2-61-en-anti-butterfly-harmonic-pattern-mt5-3.webp)
![Anti Butterfly Harmonic Pattern Indicator MT5 Download - [TFlab] 3](https://cdn.tradingfinder.com/image/362106/2-61-en-anti-butterfly-harmonic-pattern-mt5-4.webp)
On July 2, 2025, in version 2, alert/notification and signal functionality was added to this indicator
The Anti Butterfly Harmonic Pattern Indicator in the MetaTrader 5 platform automatically identifies the harmonic pattern points X, A, B, C, and D on the chart.
By analyzing price data and accurately calculating Fibonacci ratios, this tool offers high speed and precision in identifying reversal patterns.
Anti Butterfly Harmonic Pattern Specifications Table
The following table presents the features and capabilities of the Anti Butterfly Harmonic Pattern Indicator:
Indicator Categories: | Price Action MT5 Indicators Harmonic MT5 Indicators Candle Sticks MT5 Indicators |
Platforms: | MetaTrader 5 Indicators |
Trading Skills: | Intermediate |
Indicator Types: | Reversal MT5 Indicators |
Timeframe: | Multi-Timeframe MT5 Indicators |
Trading Style: | Intraday MT5 Indicators |
Trading Instruments: | Forex MT5 Indicators Crypto MT5 Indicators Stock MT5 Indicators Commodity MT5 Indicators Indices MT5 Indicators Forward MT5 Indicators Share Stock MT5 Indicators |
Indicator Overview
The Anti Butterfly Harmonic Pattern indicator is based on four main waves: XA, AB, BC, and CD, where the accuracy of Fibonacci ratios in each wave plays a crucial role in the pattern’s validity. The structural characteristics of these waves are:
· XA Wave: Represents the initial price movement;
· AB Wave: A correction equivalent to 38.2% to 61.8% of the XA wave;
· BC Wave: A retracement ranging from 38.2% to 88.6% of the AB wave;
· CD Wave: An extension of the XA wave, typically more than 127.2% and up to 161.8% or more.
These harmonic patterns are shown in red for bullish trends and in blue for bearish trends.
Uptrend Conditions
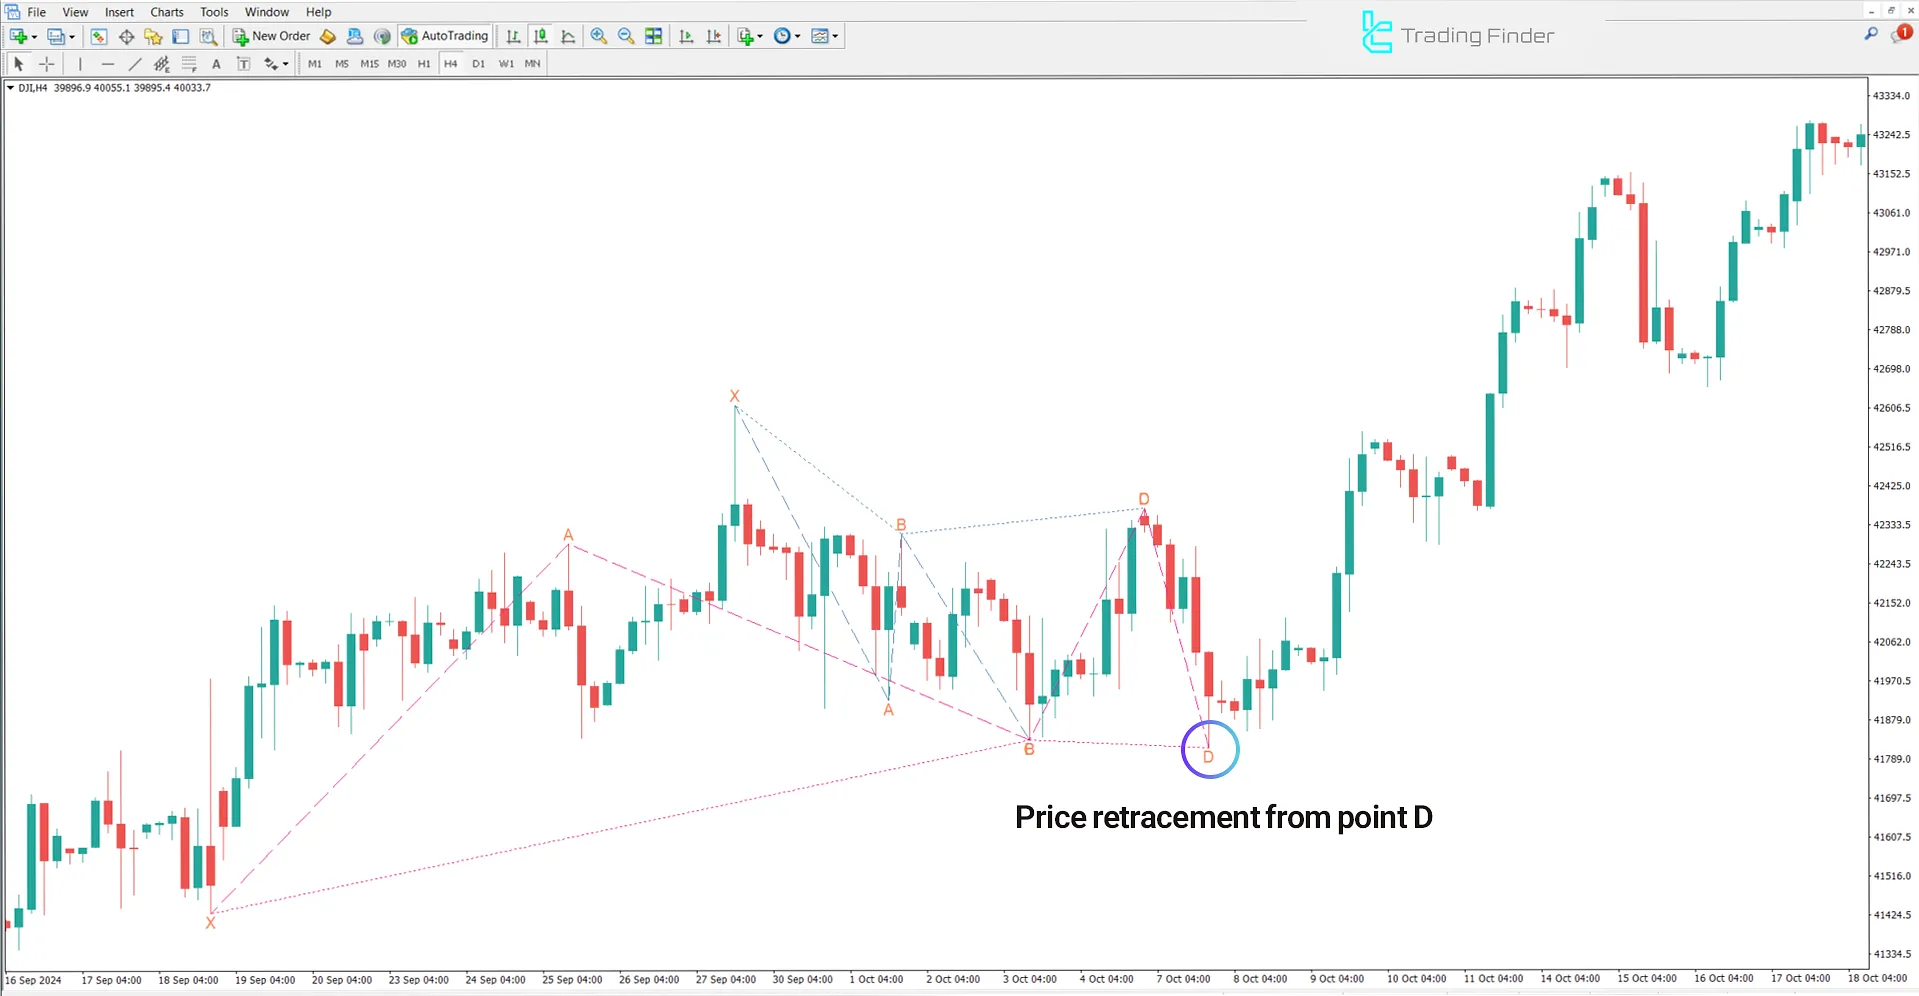
The image below shows the Dow Jones Index on a 4-hour timeframe. In this chart, the indicator identifies a bearish Anti Butterfly Harmonic Pattern, marking point D as a potential price reversal zone.
Upon the price reaching this zone and observing reversal signs, a buy signal is generated at point D.

Downtrend Conditions
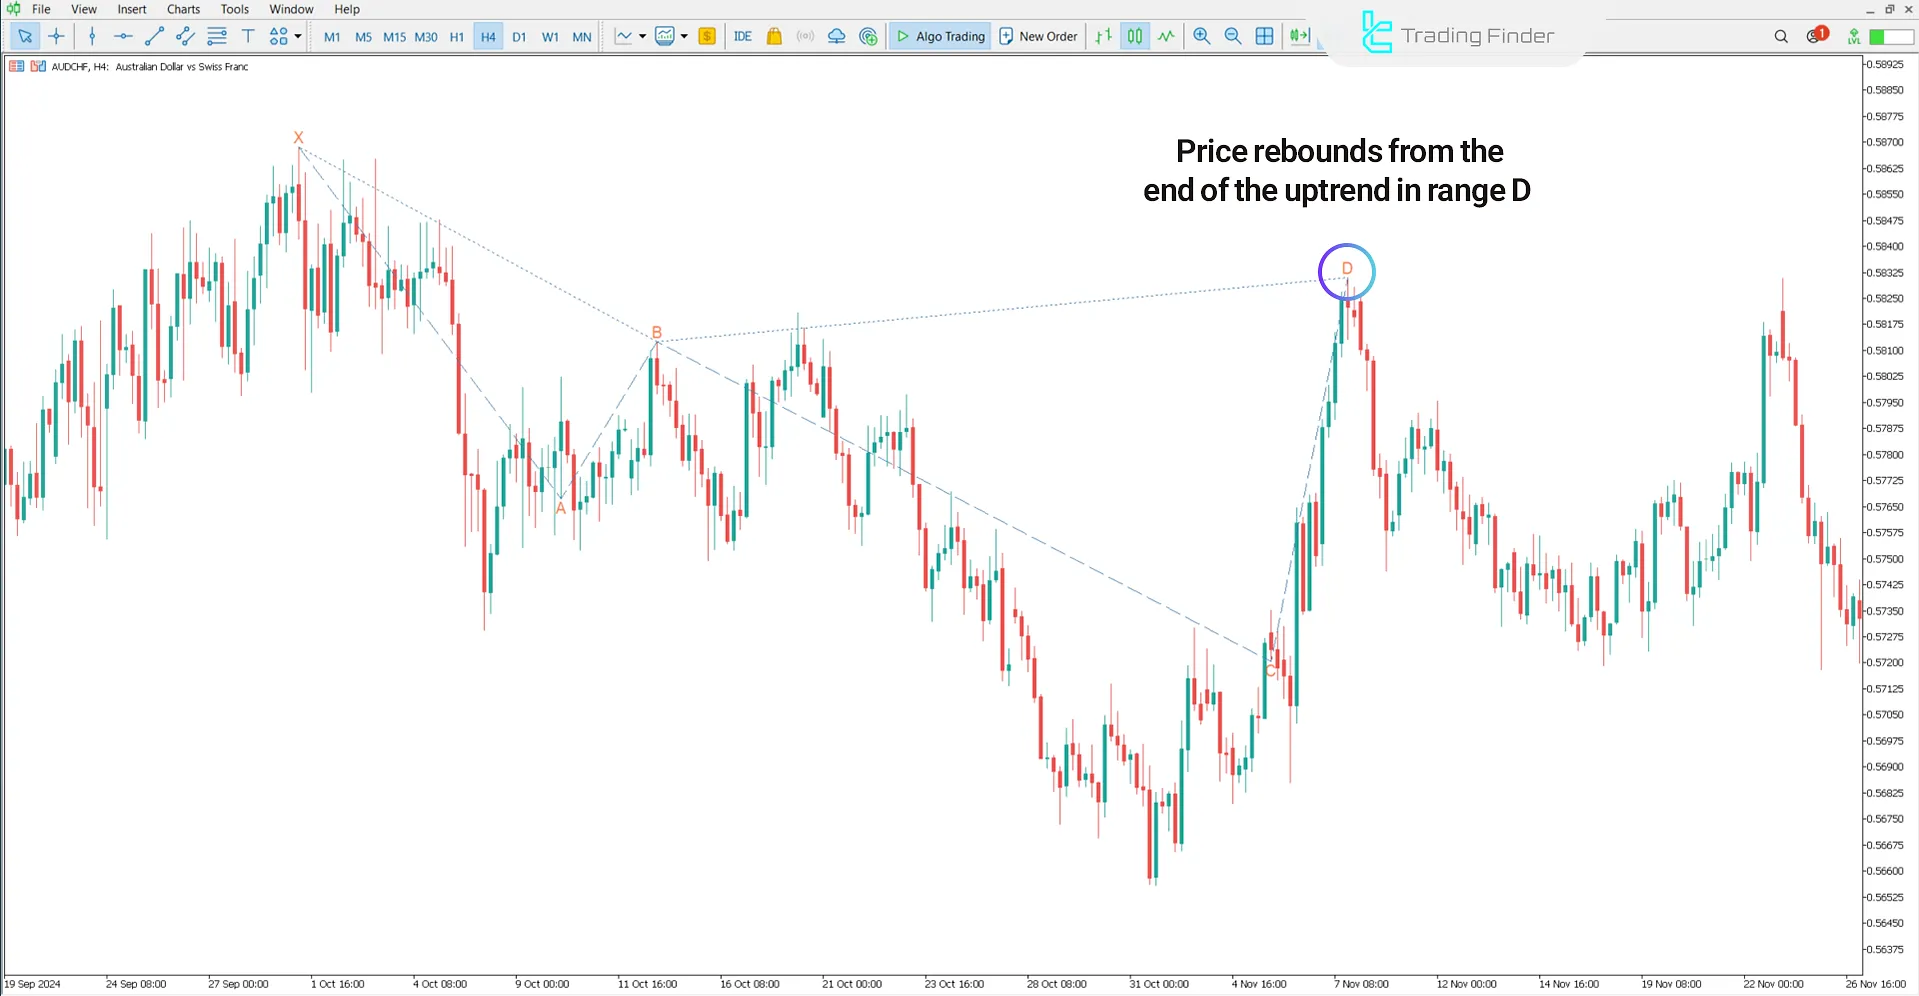
The following image displays the AUD/CHF currency pair chart on a 4-hour timeframe.
In this scenario, after the Anti Butterfly Harmonic Pattern forms at the market top, point D is identified as an ideal entry point for sell trades.

Indicator Settings
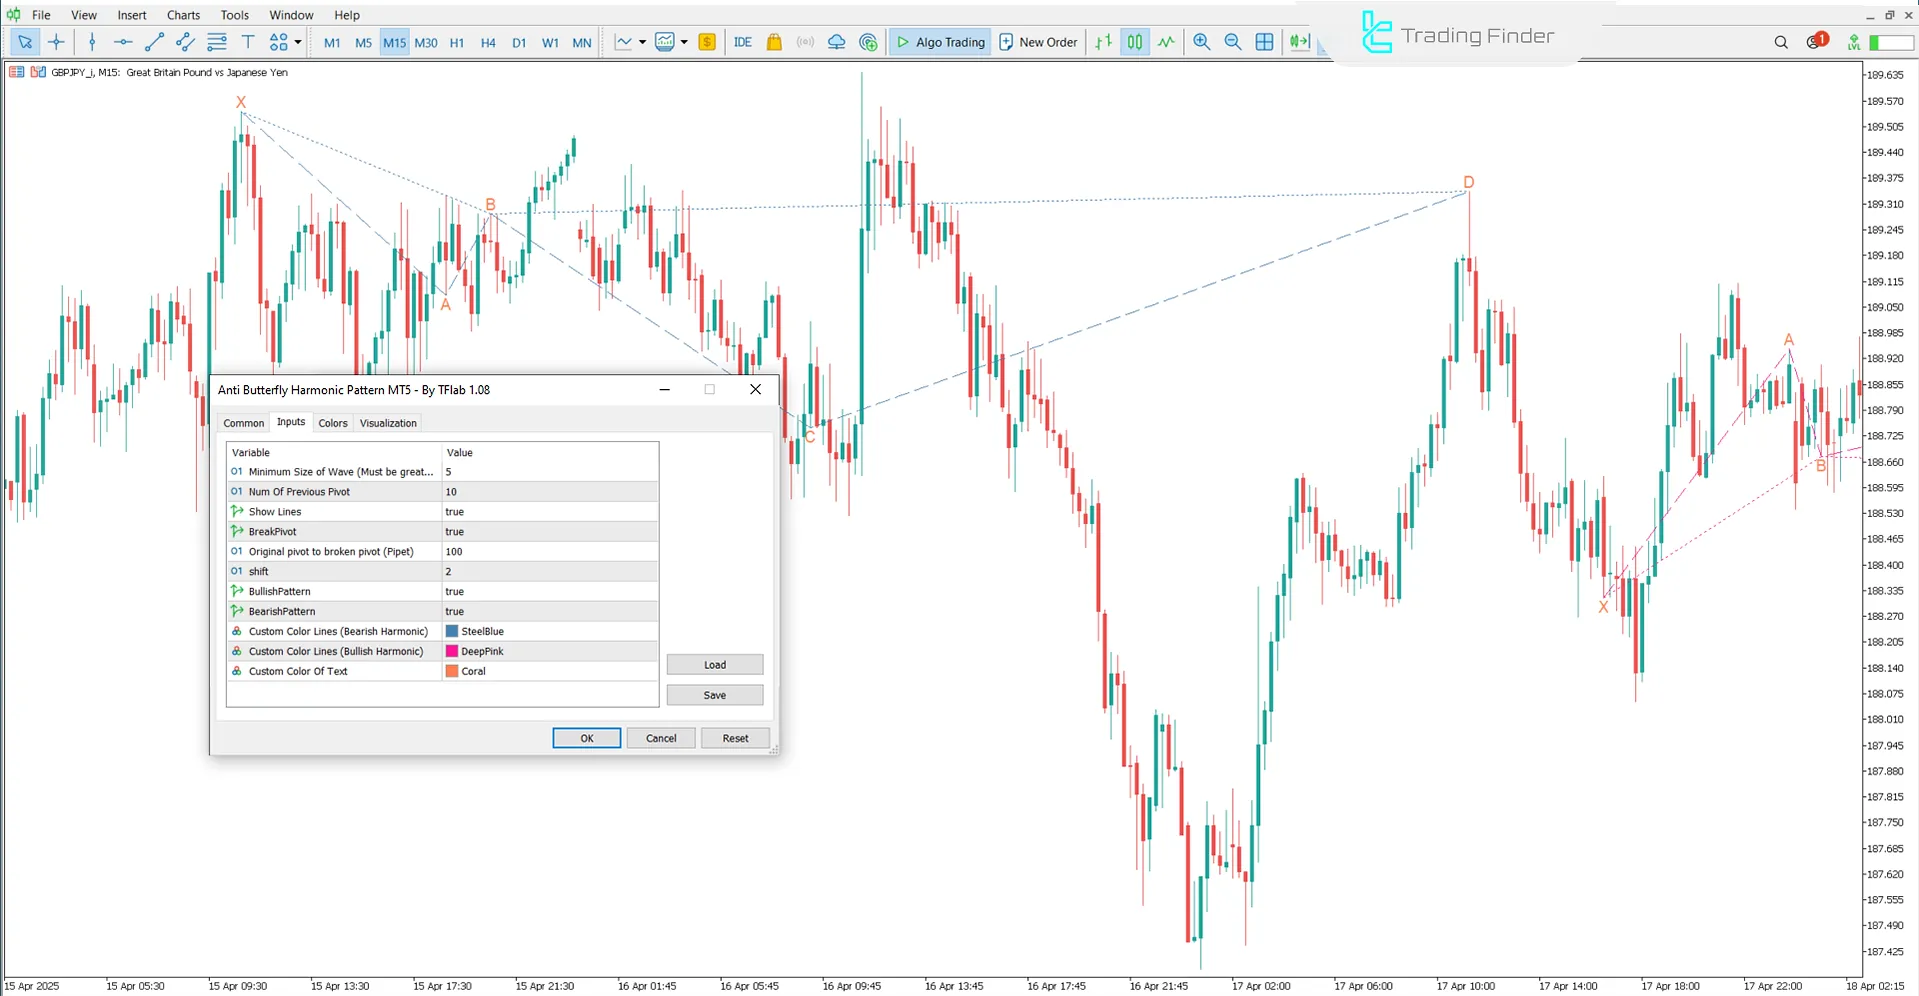
The image below shows the customizable options available in the Anti Butterfly Harmonic Pattern indicator:

- Minimum Length Of Wave (candle): Minimum wave length (in candles);
- Num Of Previous Candle: Number of previous candles to analyze;
- Show Lines: Display pattern lines;
- BreakPivot: Break pivot point;
- Original pivot to broken pivot (Pipet): Distance from original to broken pivot;
- Shift: Shift value;
- BullishPattern: Display bullish patterns;
- BearishPattern: Display bearish patterns;
- Style Of Line: Line style;
- Width Of Line: Line thickness;
- Custom Color Lines (Bearish Harmonic): Color of bearish harmonic lines;
- Custom Color Lines (Bullish Harmonic): Color of bullish harmonic lines;
- Custom Color Of Text: Text annotation color.
Conclusion
The Anti Butterfly Harmonic Pattern Indicator plays a key role in identifying harmonic patterns and spotting major price reversal zones in financial markets such as cryptocurrencies and Forex.
By precisely calculating Fibonacci levels, it suggests optimal entry and exit points at point D.
Anti Butterfly Harmonic Pattern MT5 PDF
Anti Butterfly Harmonic Pattern MT5 PDF
Click to download Anti Butterfly Harmonic Pattern MT5 PDFDoes the Anti Butterfly Harmonic Pattern indicator generate buy/sell signals?
Yes, when the price reaches point D and reversal signals are confirmed, the indicator issues buy or sell entry signals.
How many main waves does the Anti Butterfly Harmonic Pattern indicator include?
This trading tool consists of four main waves: XA, AB, BC, and CD.


