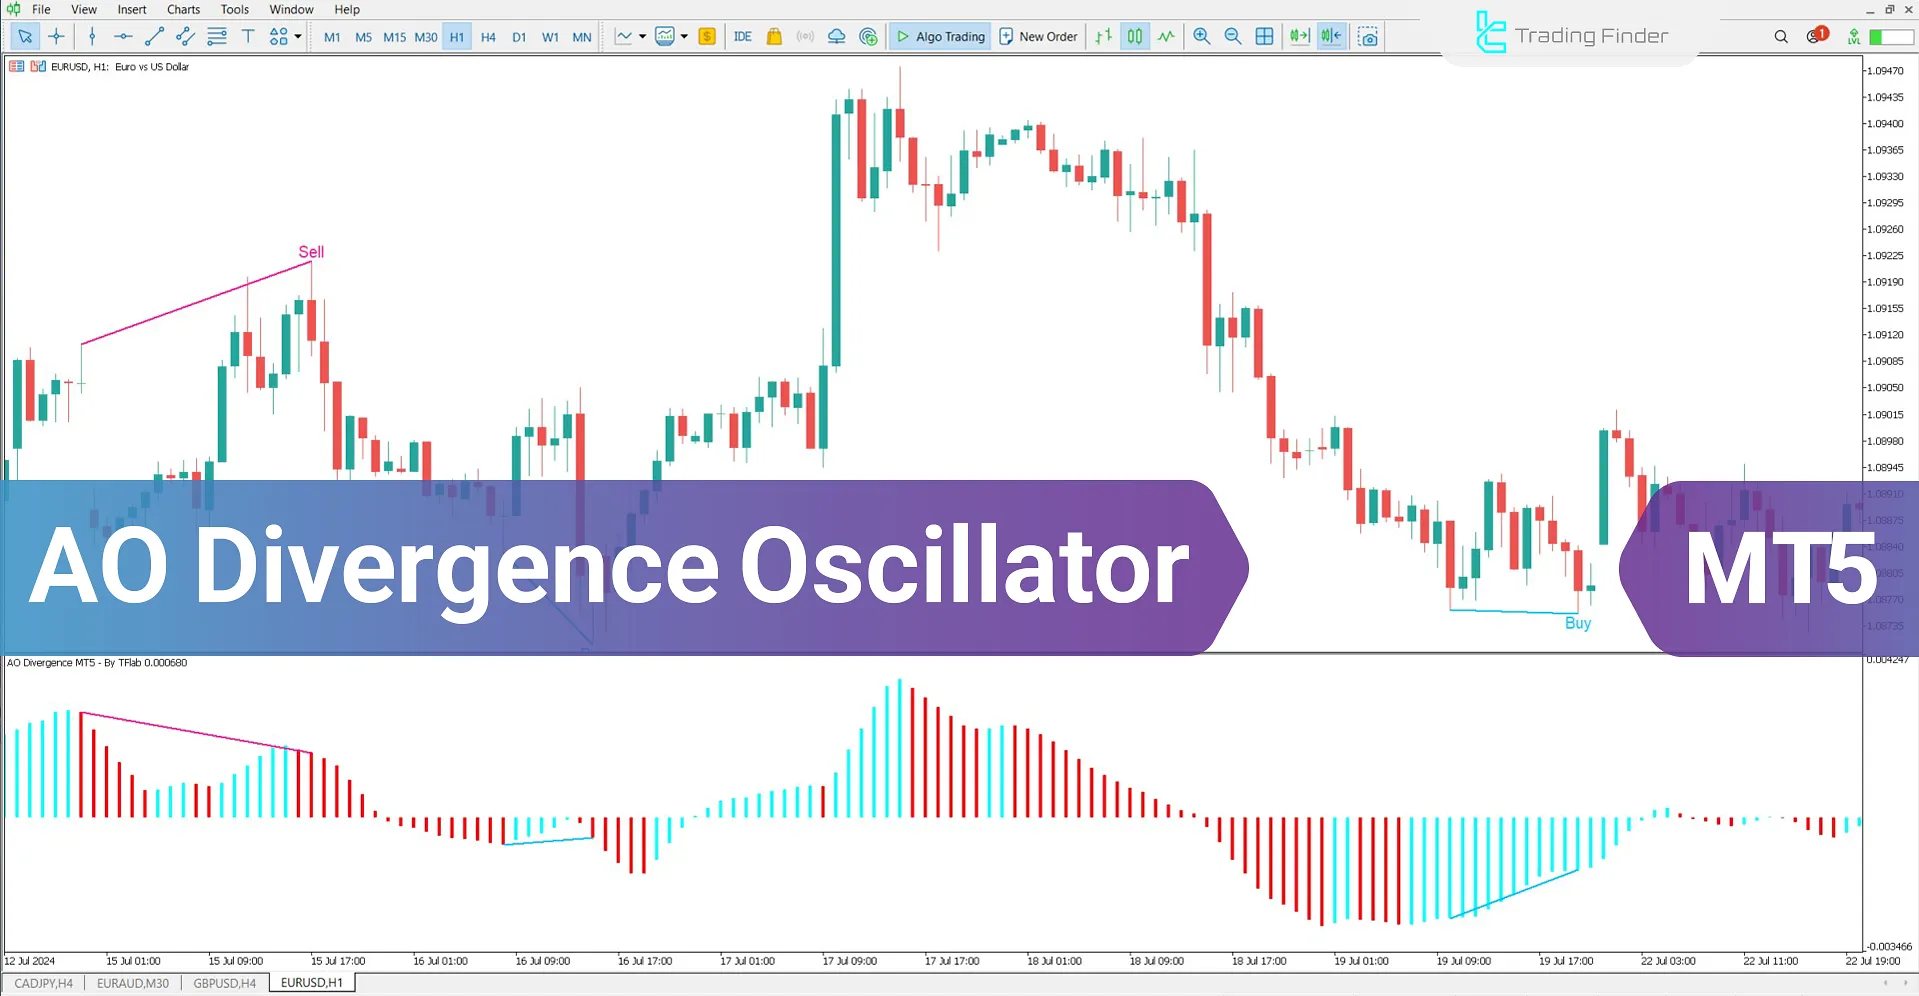


On June 22, 2025, in version 2, alert/notification functionality was added to this indicator
The AO Divergence Indicator in the MetaTrader 5 trading platform analyzes trend changes and its structural weaknesses using 5-period and 34-period moving average calculations.
This MetaTrader 5 indicator identifies bullish and bearish divergences by comparing price movement and the momentum of the histogram.
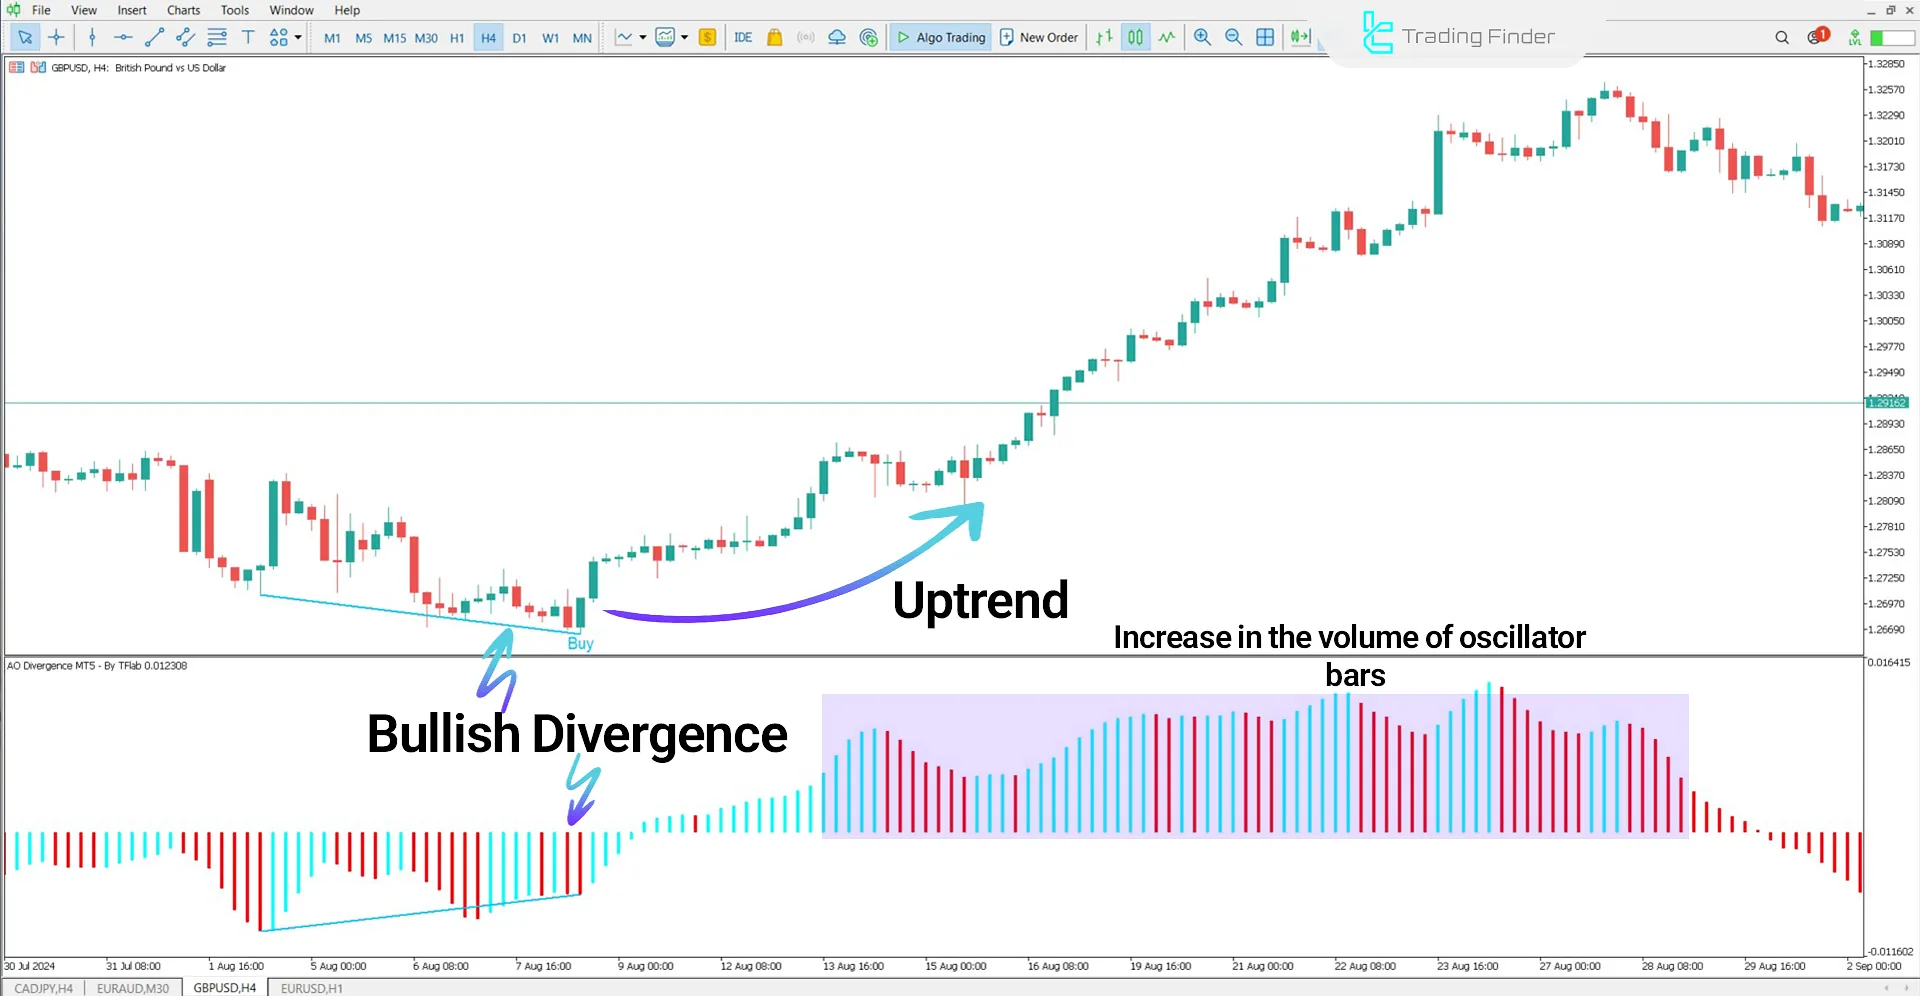
When a downward price fluctuation accompanies an increase in the AO value, the potential for a trend reversal to an uptrend increases.
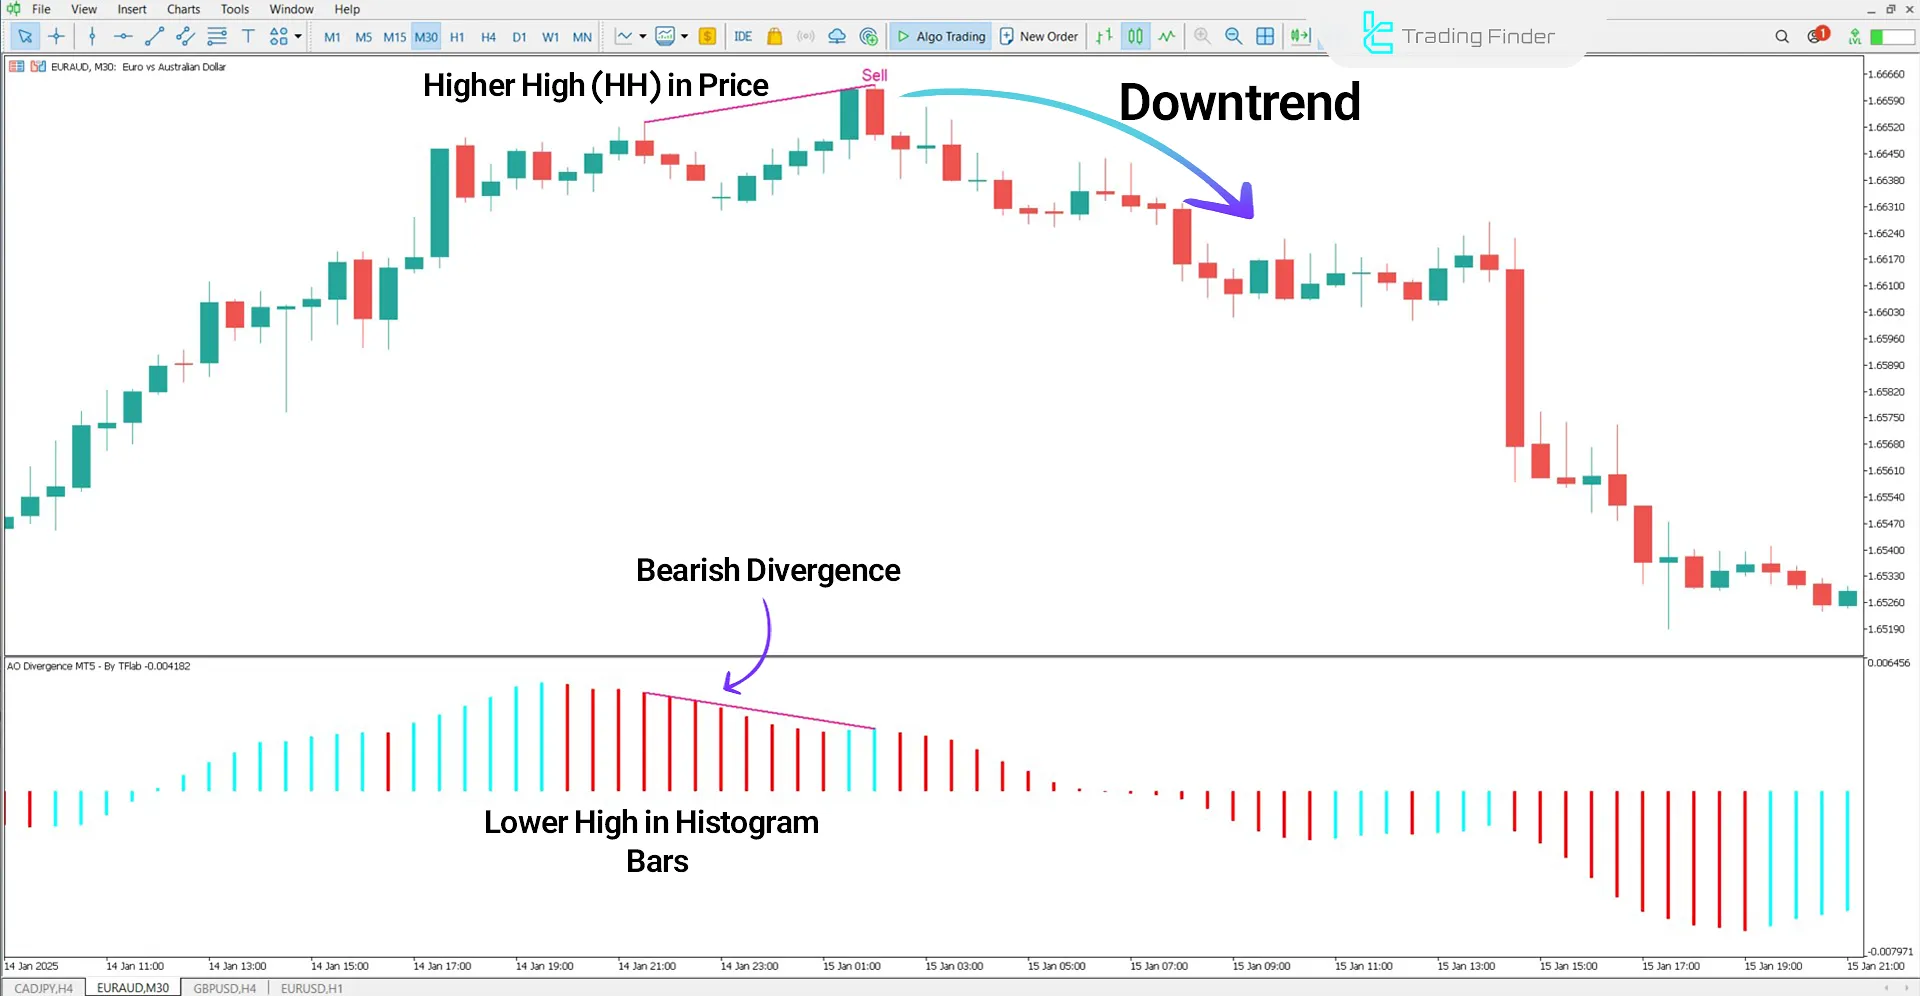
On the other hand, when the price is rising, but the AO histogram decreases, it shows weakness in the buyers' momentum and indicates a potential trend reversal.
Awesome Oscillator Divergence Indicator Specifications
The specifications of this indicator are summarized in the table below.
Indicator Categories: | Oscillators MT5 Indicators Signal & Forecast MT5 Indicators Trading Assist MT5 Indicators |
Platforms: | MetaTrader 5 Indicators |
Trading Skills: | Intermediate |
Indicator Types: | Leading MT5 Indicators Reversal MT5 Indicators |
Timeframe: | Multi-Timeframe MT5 Indicators |
Trading Style: | Day Trading MT5 Indicators |
Trading Instruments: | Forex MT5 Indicators Crypto MT5 Indicators Stock MT5 Indicators Forward MT5 Indicators |
Indicator at a Glance
One key feature of this MT5 trading assist Indicator is the automatic detection of divergences between price and momentum.
The AO Divergence Indicator marks these changes by displaying colored lines on the chart and issuing buy and sell signals:
- Blue Line: Confirms positive divergence, indicating the potential for price to move upwards
- Pink Line: Represents negative divergence, signaling the weakening of an uptrend
Indicator in an Uptrend
After identifying a positive divergence, the price enters an uptrend. An increase in the volume of the histogram bars can indicate the strengthening of this trend, while a gradual decrease in histogram volume serves as a warning for the potential weakening of the trend.
In such cases, traders can close their positions and exit the trade when they observe a decrease in volume.

Indicator in a Downtrend
In the 30-minute EUR/AUD chart, the indicator detects the divergence between price and oscillator and issues a sell signal.
In this scenario, the price forms a higher peak, but the indicator shows a lower peak.

Awesome Oscillator Divergence Indicator Settings
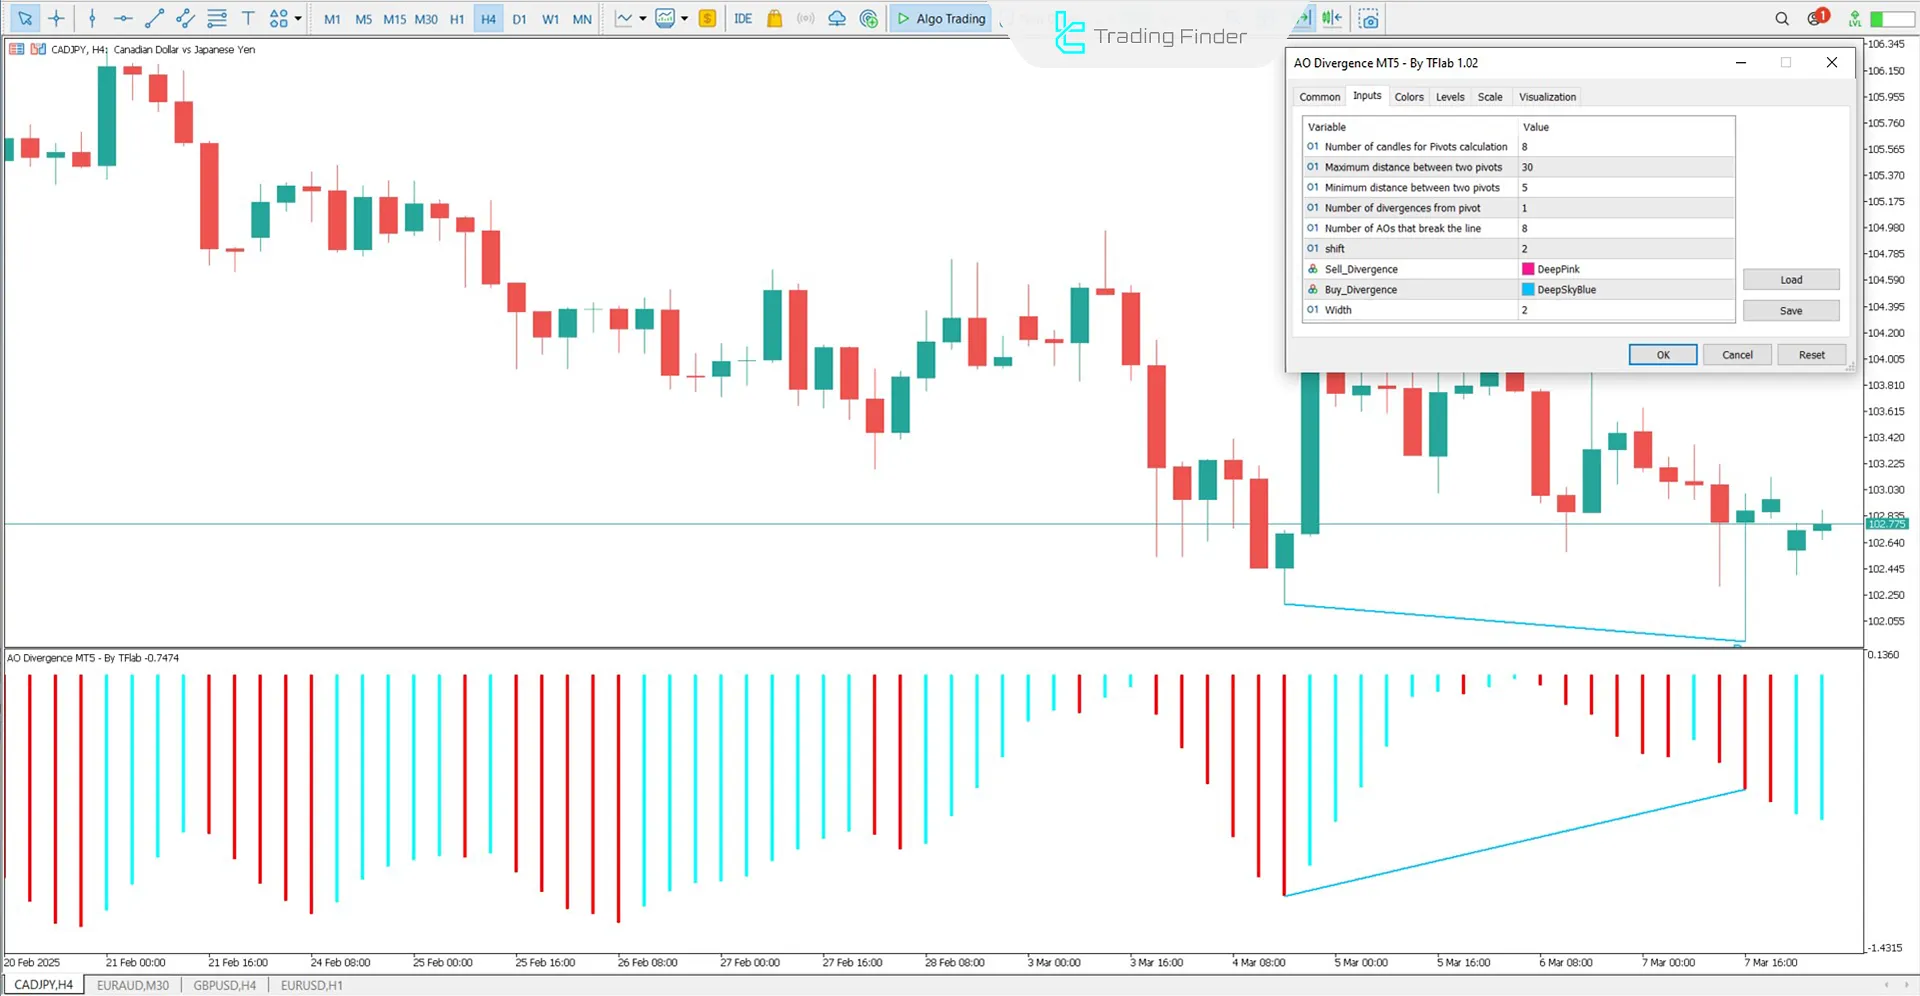
The details of the AO Divergence Indicator settings section are shown in the image below:

- Number of candles for Pivots calculation: Number of candles used for pivot calculation
- Maximum distance between two pivots: Maximum distance between two pivots
- Minimum distance between two pivots: Minimum distance between two pivots
- Number of divergences from pivot: Number of divergences from the pivot
- Number of CCI that break the line: Number of CCI breaks
- Shift: Price shift
- Sell Divergence: Color for sell divergence signal
- Buy Divergence: Color for buy divergence signal
- Width: Line thickness
Conclusion
Using the Awesome Oscillator Divergence Indicator helps detect market reversal points and analyzes the trend's sustainability.
The larger the positive histogram bars in the AO histogram, the stronger the bullish momentum and the continuation of price movement in the same direction.
On the contrary, a gradual decrease in the volume of histogram bars can signal a weakening trend and a potential price reversal.
Awesome Oscillator Divergence MT5 PDF
Awesome Oscillator Divergence MT5 PDF
Click to download Awesome Oscillator Divergence MT5 PDFWhat do the colors displayed in the AO Divergence Indicator represent?
The blue line indicates positive divergence, which increases the probability of price growth. Conversely, the pink line represents negative divergence, indicating a potential price decrease.
In which markets can this AO Divergence indicator be used?
The AO Divergence Indicator applies to Forex, cryptocurrency, and stock markets.


