![Aroon Oscillator in MetaTrader 5 Download - Free - [TradingFinder]](https://cdn.tradingfinder.com/image/210345/13-63-en-aroon-mt5-01.webp)
![Aroon Oscillator in MetaTrader 5 Download - Free - [TradingFinder] 0](https://cdn.tradingfinder.com/image/210345/13-63-en-aroon-mt5-01.webp)
![Aroon Oscillator in MetaTrader 5 Download - Free - [TradingFinder] 1](https://cdn.tradingfinder.com/image/210332/13-63-en-aroon-mt5-02.webp)
![Aroon Oscillator in MetaTrader 5 Download - Free - [TradingFinder] 2](https://cdn.tradingfinder.com/image/210344/13-63-en-aroon-mt5-03.webp)
![Aroon Oscillator in MetaTrader 5 Download - Free - [TradingFinder] 3](https://cdn.tradingfinder.com/image/210343/13-63-en-aroon-mt5-04.webp)
The Aroon indicator is one of the MetaTrader 5 indicators that uses two oscillating lines in blue and brown to identify future price movements and trend reversal points.
The trading tool is plotted below the price chart in a separate panel and determines trend strength and direction based on ranges between 0 and 100.
The relative positioning of the Aroon Up and Aroon Down lines can indicate whether the price trend is bullish or bearish.
Aroon Indicator Specifications Table
The features and specifications of the Aroon Indicator are as follows.
Indicator Categories: | Oscillators MT5 Indicators Volatility MT5 Indicators Currency Strength MT5 Indicators |
Platforms: | MetaTrader 5 Indicators |
Trading Skills: | Elementary |
Indicator Types: | Reversal MT5 Indicators |
Timeframe: | Multi-Timeframe MT5 Indicators |
Trading Style: | Intraday MT5 Indicators |
Trading Instruments: | Forex MT5 Indicators Crypto MT5 Indicators Stock MT5 Indicators |
Overview of the Aroon Indicator
The indicator issues Bullish or Bearish signals based on the relative positions of the Aroon Up and Aroon Down lines.
The trend is considered bullish when the blue line (Aroon Up) is above the brown line (Aroon Down). Conversely, the trend is bearish when the blue line is below the brown line. A value near 70 indicates trend stability in either direction.
Buy Signal
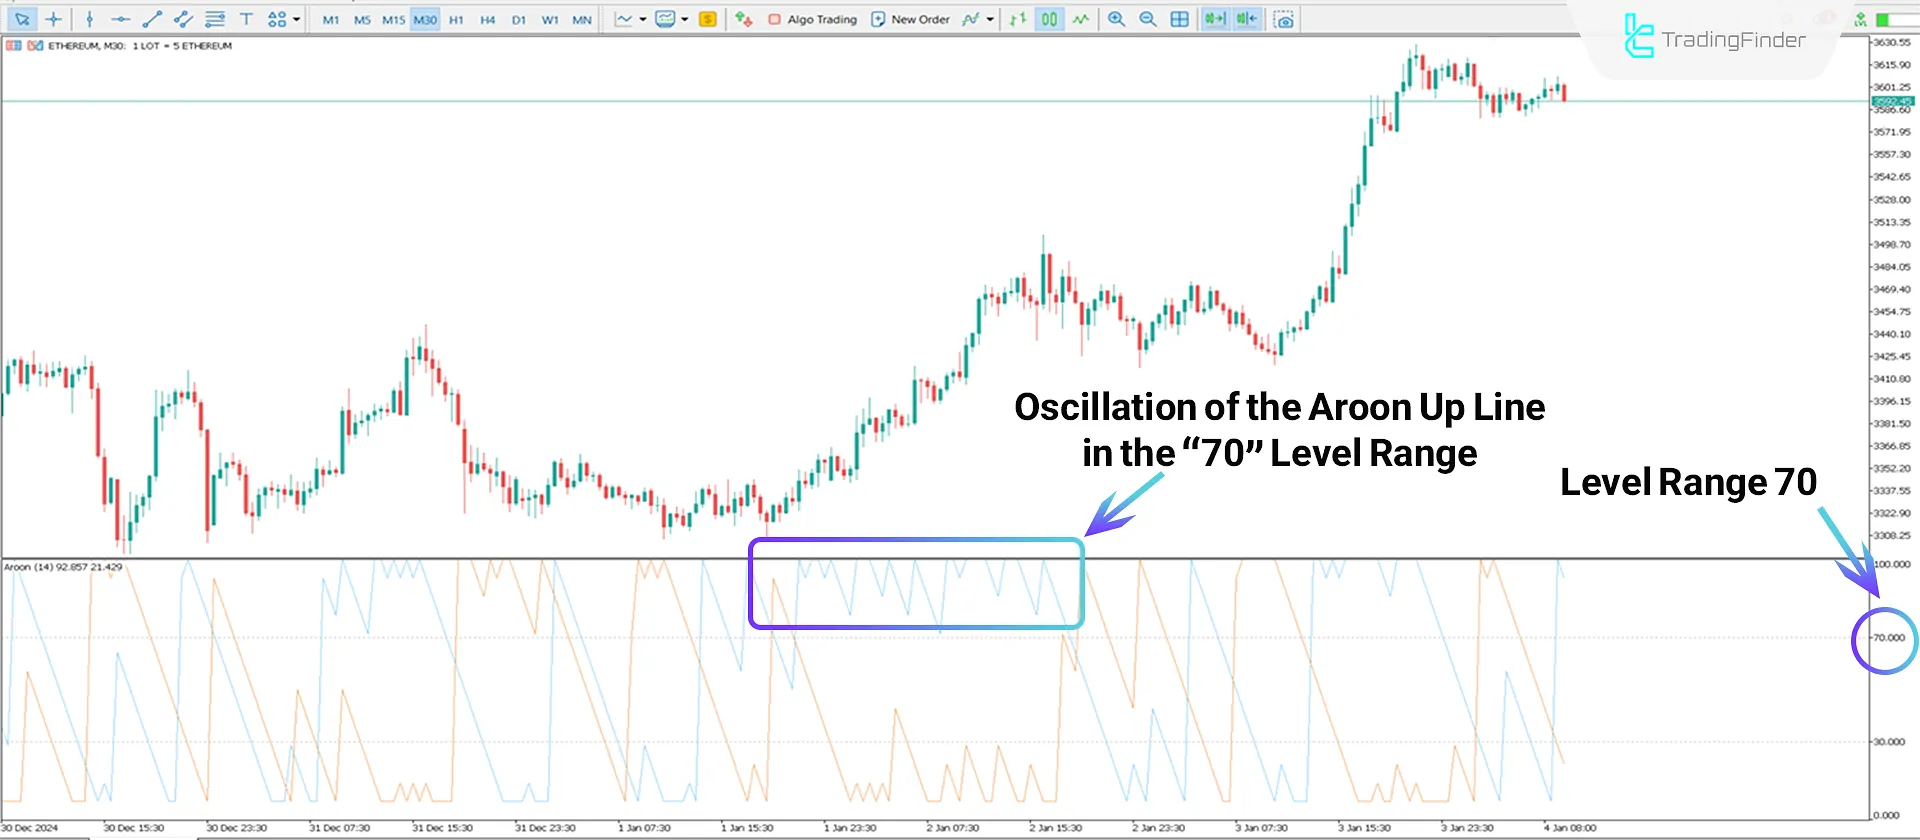
Based on the 30-minute Ethereum (ETH) chart, the blue oscillating line (Aroon Up) is positioned above the brown line and within the 70-level range.
This indicates a bullish trend, with the oscillation of the blue line above 70 further affirming the trend's strength and stability.

Sell Signal
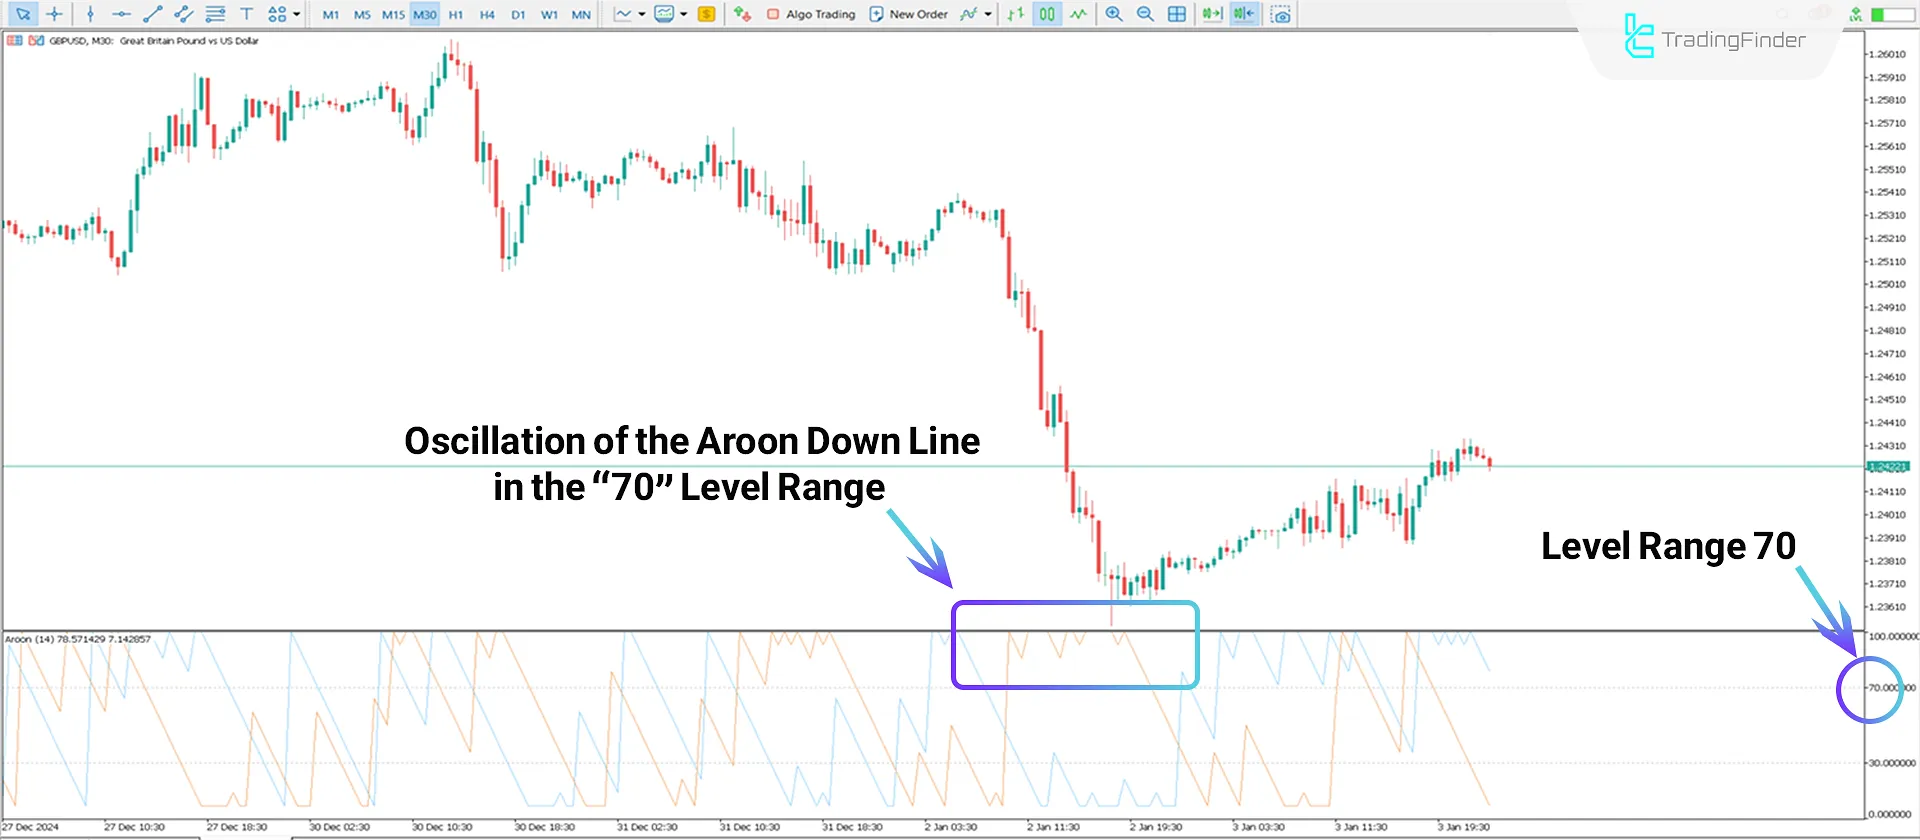
The 30-minute GBP/USD currency pair chart demonstrates how the Aroon Oscillator issues a Sell Signal.
The brown Aroon Down line is above the blue Aroon Up line, oscillating within the 70-level range, signaling a strong bearish trend.

Indicator Settings
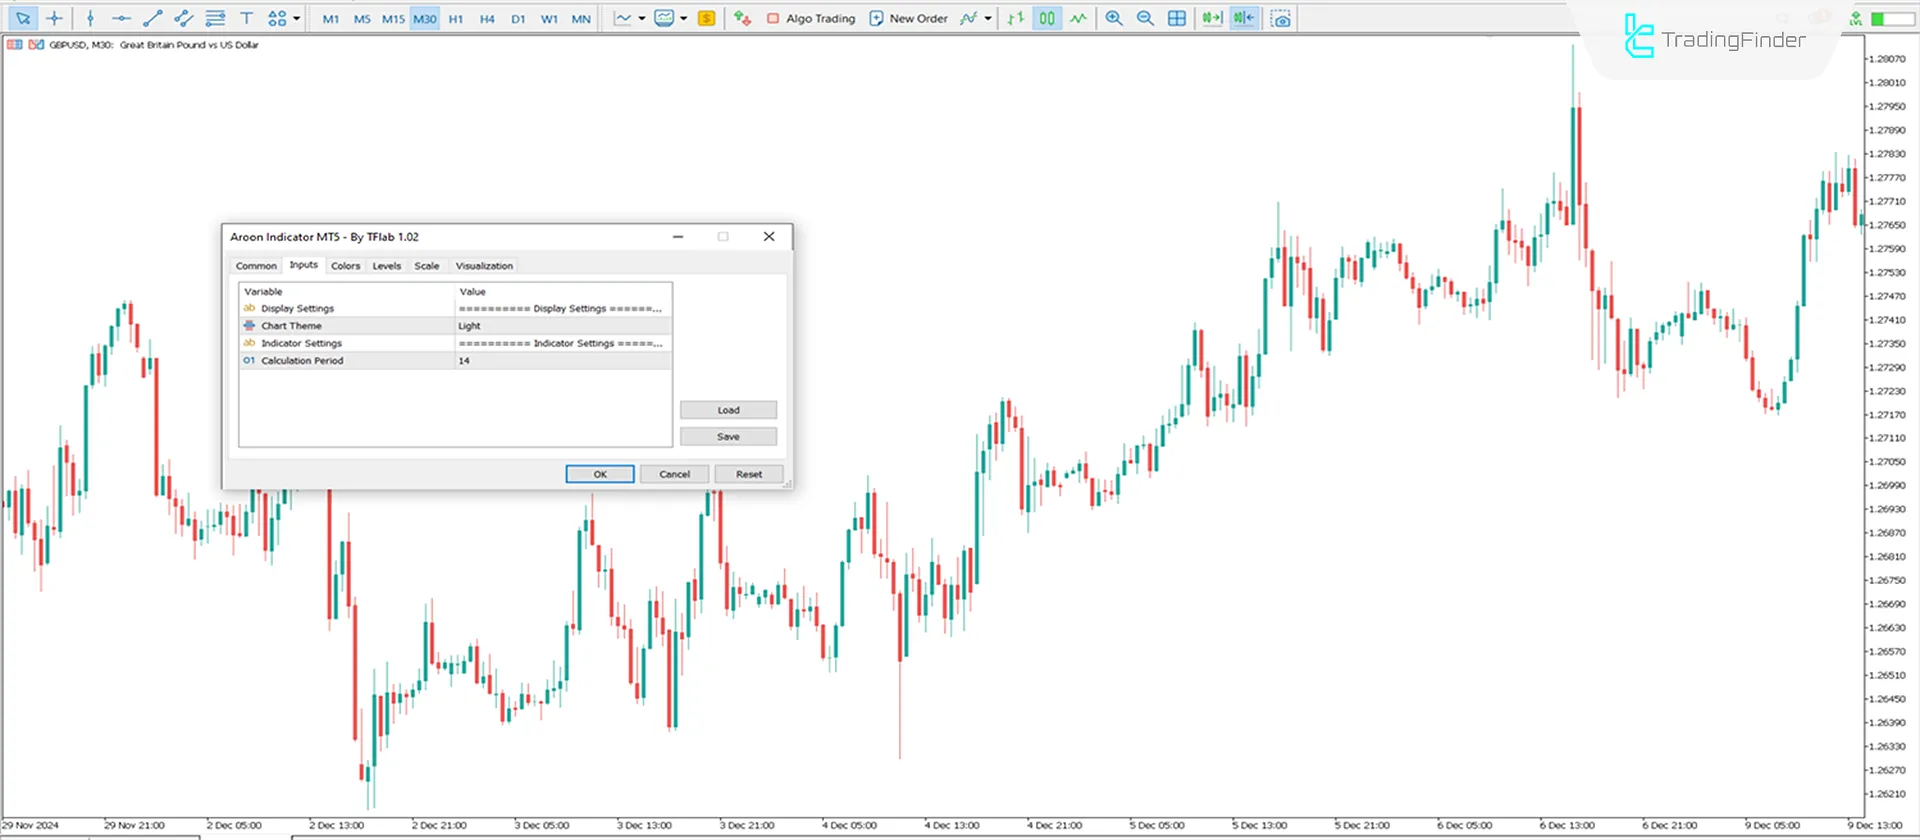
The configuration options for the Aroon Oscillator are as follows:

- Chart Theme: Define the indicator's visual theme;
- Period: Specify the number of periods used to calculate the trend line.
Conclusion
The Aroon indicator is one of the highly volatile indicators in MetaTrader 5 and, in technical analysis, consists of two lines aimed at identifying trend movements and reversal zones.
This oscillator indicates whether the trend is bullish (Uptrend) or bearish (Downtrend) based on the positioning of these two lines. Additionally, the fluctuation of either of these lines above the 70 level signifies the strength and stability of the trend.
Aroon Oscillator Meta MT5 PDF
Aroon Oscillator Meta MT5 PDF
Click to download Aroon Oscillator Meta MT5 PDFWhich timeframe is suitable for this indicator?
The Aroon Indicator is multi-timeframe and applicable across all time intervals.
Is this indicator suitable for beginner traders?
Yes, the Aroon Oscillator is simple, making it ideal for beginner traders.


