![ATR XH Volume Indicator for MetaTrader 5 Download - Free - [TFlab]](https://cdn.tradingfinder.com/image/244193/4-49-en-atr-xh-volume-mt5-1.webp)
![ATR XH Volume Indicator for MetaTrader 5 Download - Free - [TFlab] 0](https://cdn.tradingfinder.com/image/244193/4-49-en-atr-xh-volume-mt5-1.webp)
![ATR XH Volume Indicator for MetaTrader 5 Download - Free - [TFlab] 1](https://cdn.tradingfinder.com/image/244192/4-49-en-atr-xh-volume-mt5-2.webp)
![ATR XH Volume Indicator for MetaTrader 5 Download - Free - [TFlab] 2](https://cdn.tradingfinder.com/image/244190/4-49-en-atr-xh-volume-mt5-3.webp)
![ATR XH Volume Indicator for MetaTrader 5 Download - Free - [TFlab] 3](https://cdn.tradingfinder.com/image/244191/4-49-en-atr-xh-volume-mt5-4.webp)
The ATR XH Volume Indicator in MetaTrader 5 indicators integrates market volatility with trading volume.
This indicator simultaneously displays changes in the Average True Range (ATR) and trading volume, identifying market trends and determining periods of high or low volatility.
In this indicator, volatility is measured by the ATR, which is displayed in orange by default for clear distinction from other chart components.
ATR XH Volume Indicator Specifications
The table below summarizes the key features of this indicator.
Indicator Categories: | Oscillators MT5 Indicators Volatility MT5 Indicators Trading Assist MT5 Indicators |
Platforms: | MetaTrader 5 Indicators |
Trading Skills: | Intermediate |
Indicator Types: | Range MT5 Indicators Reversal MT5 Indicators |
Timeframe: | Multi-Timeframe MT5 Indicators |
Trading Style: | Intraday MT5 Indicators |
Trading Instruments: | Forex MT5 Indicators Crypto MT5 Indicators Stock MT5 Indicators |
Overview of the Indicator
The ATR XH Volume Indicator provides the ability to identify strong trends and low-volatility periods by simultaneously displaying ATR fluctuations and trading volume.
- When both volume and ATR increase simultaneously, this is considered a sign of continued market momentum in the same direction
- A decrease in both volume and ATR indicates entry into a range phase
An increase in volume coupled with a decrease in ATR may signify trend weakness and the potential for a market reversal
Indicator in an Uptrend
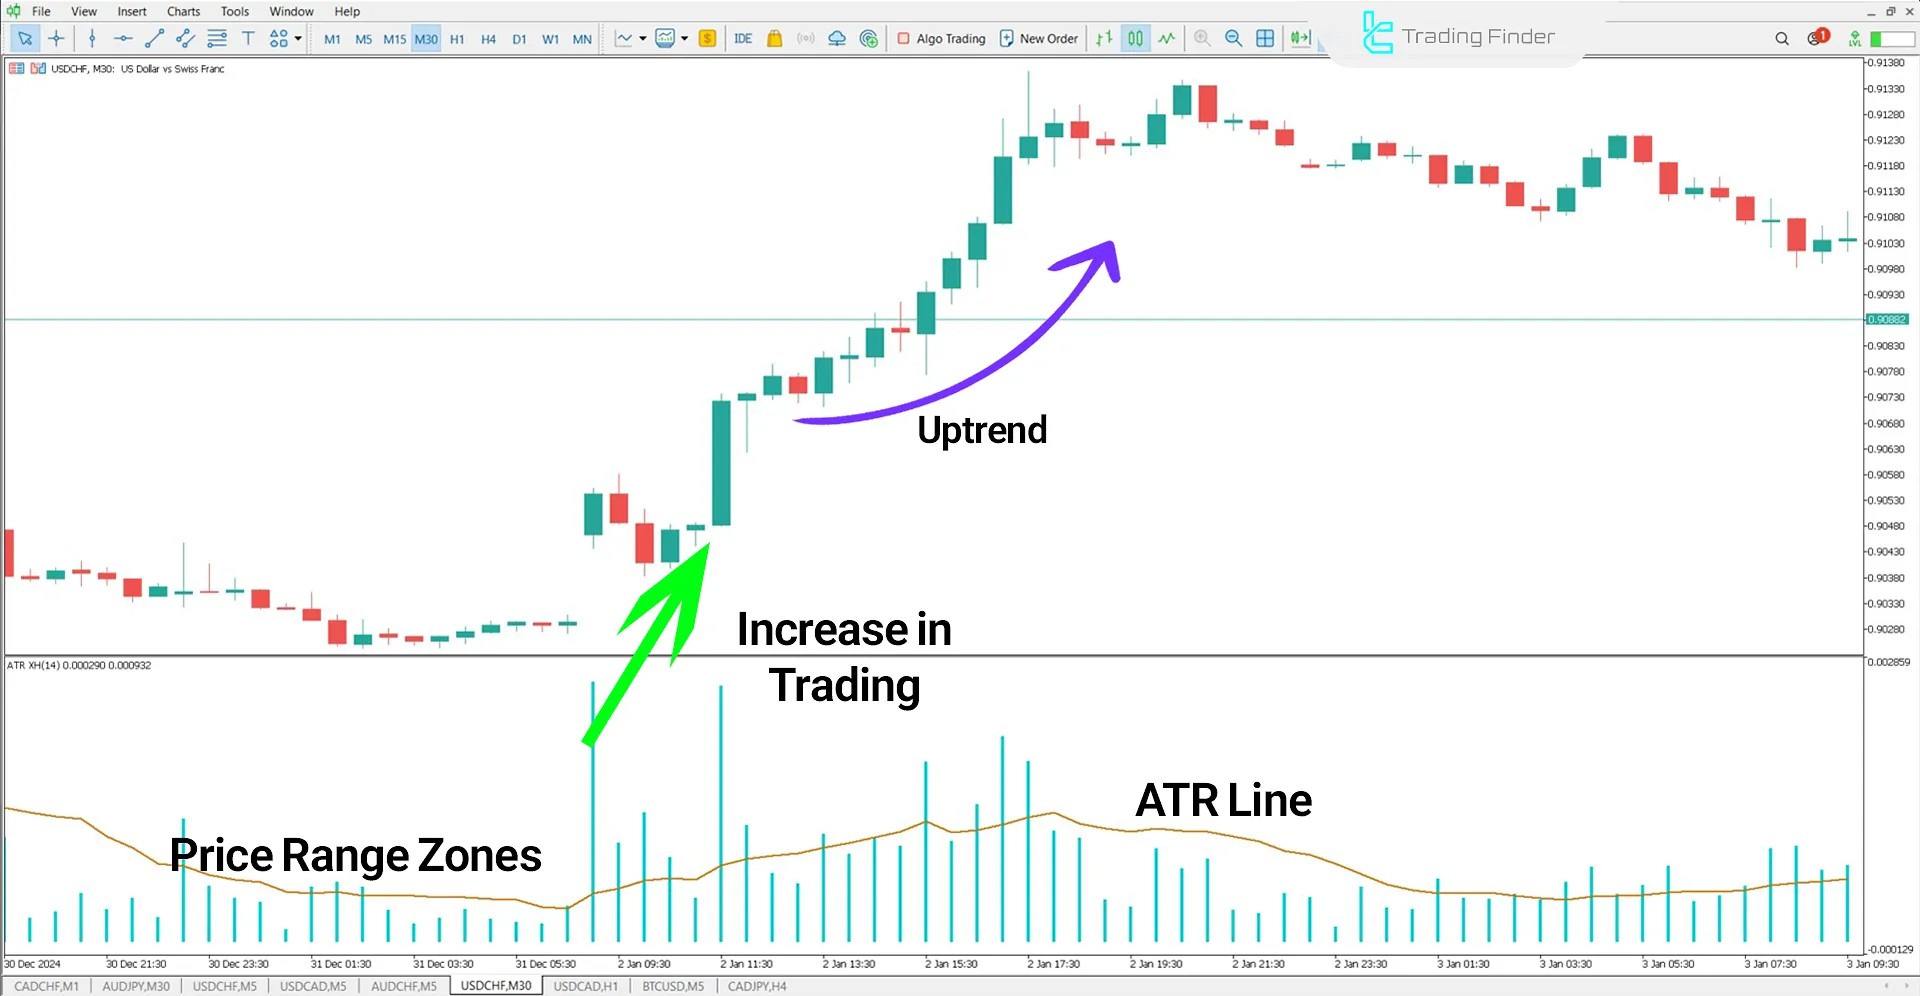
In the chart below, the price initially moved within a range. After an increase in trading volume and crossing the ATR line, an uptrend was formed.
Analysts can utilize additional tools, such as the PAFX Secret Indicator, for entry into trades in these zones.

Indicator in a Downtrend
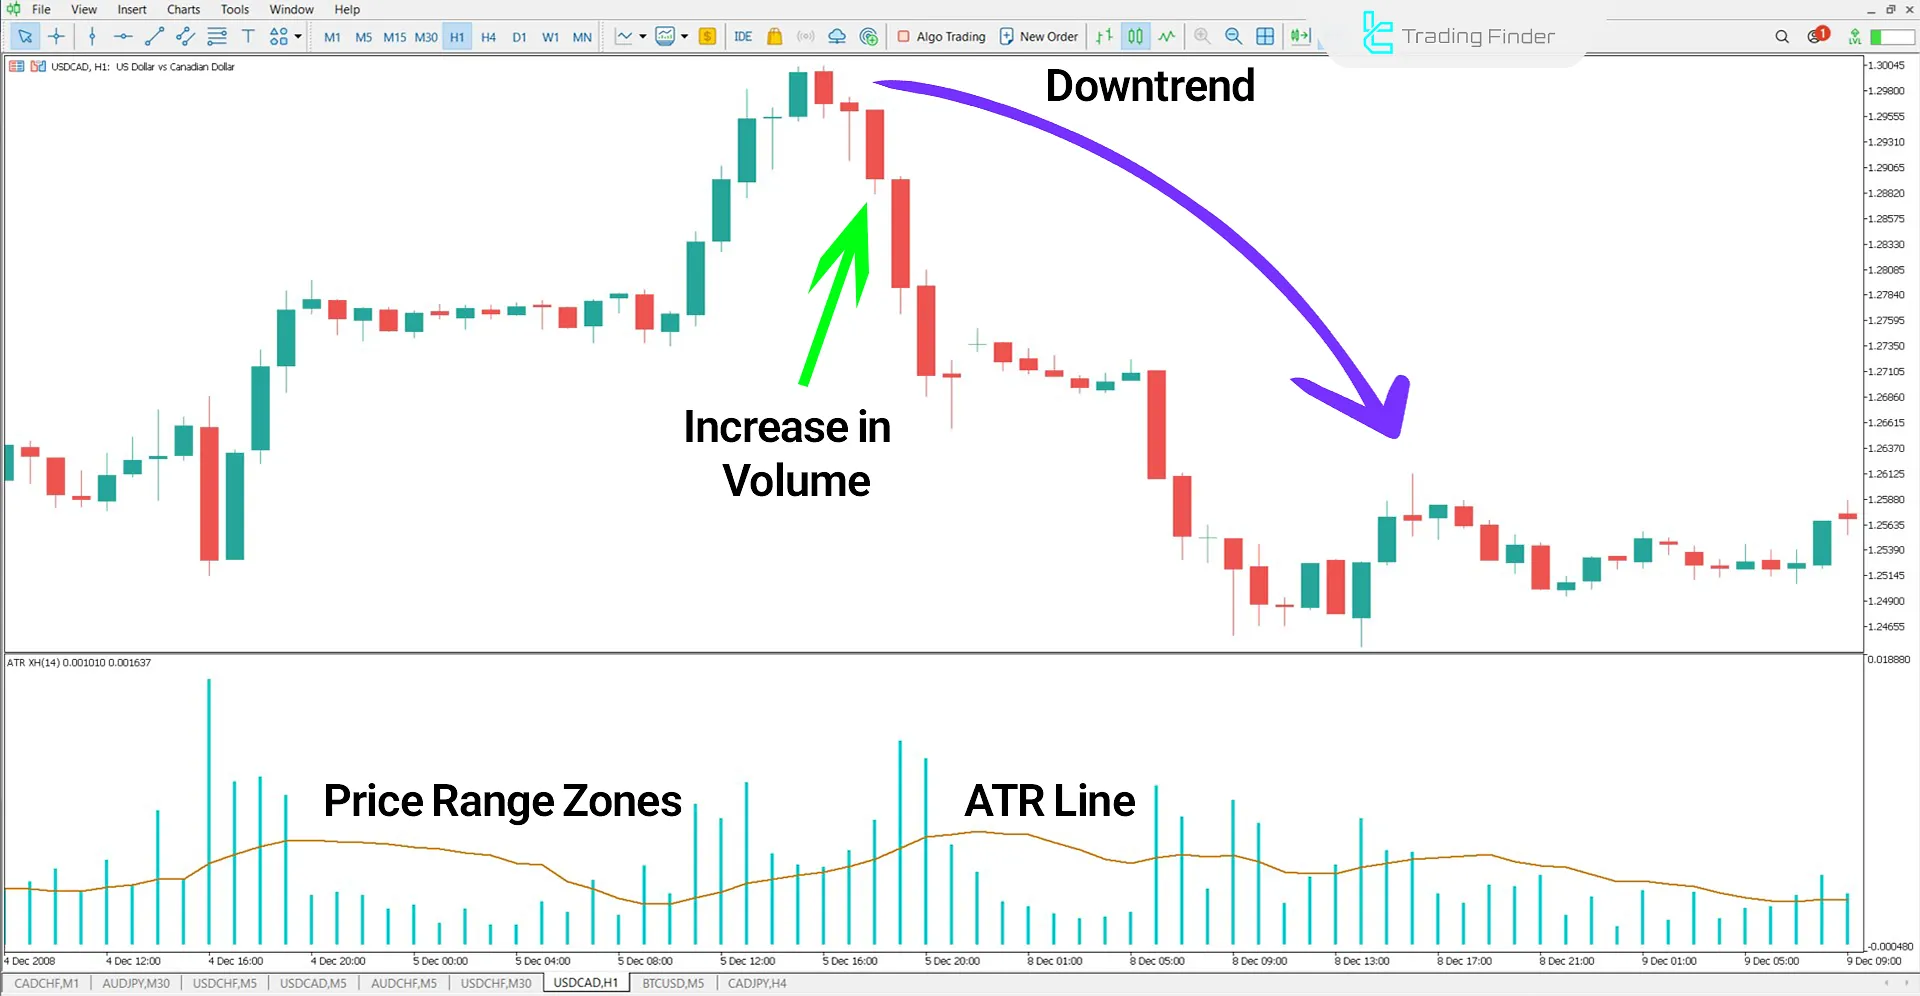
In the USD/CAD hourly chart, the price initially broke out of the range and experienced a relatively weak growth.
Subsequently, with an increase in trading volume, the price entered a downtrend, creating opportunities for sell positions.

ATR XH Volume Indicator Settings
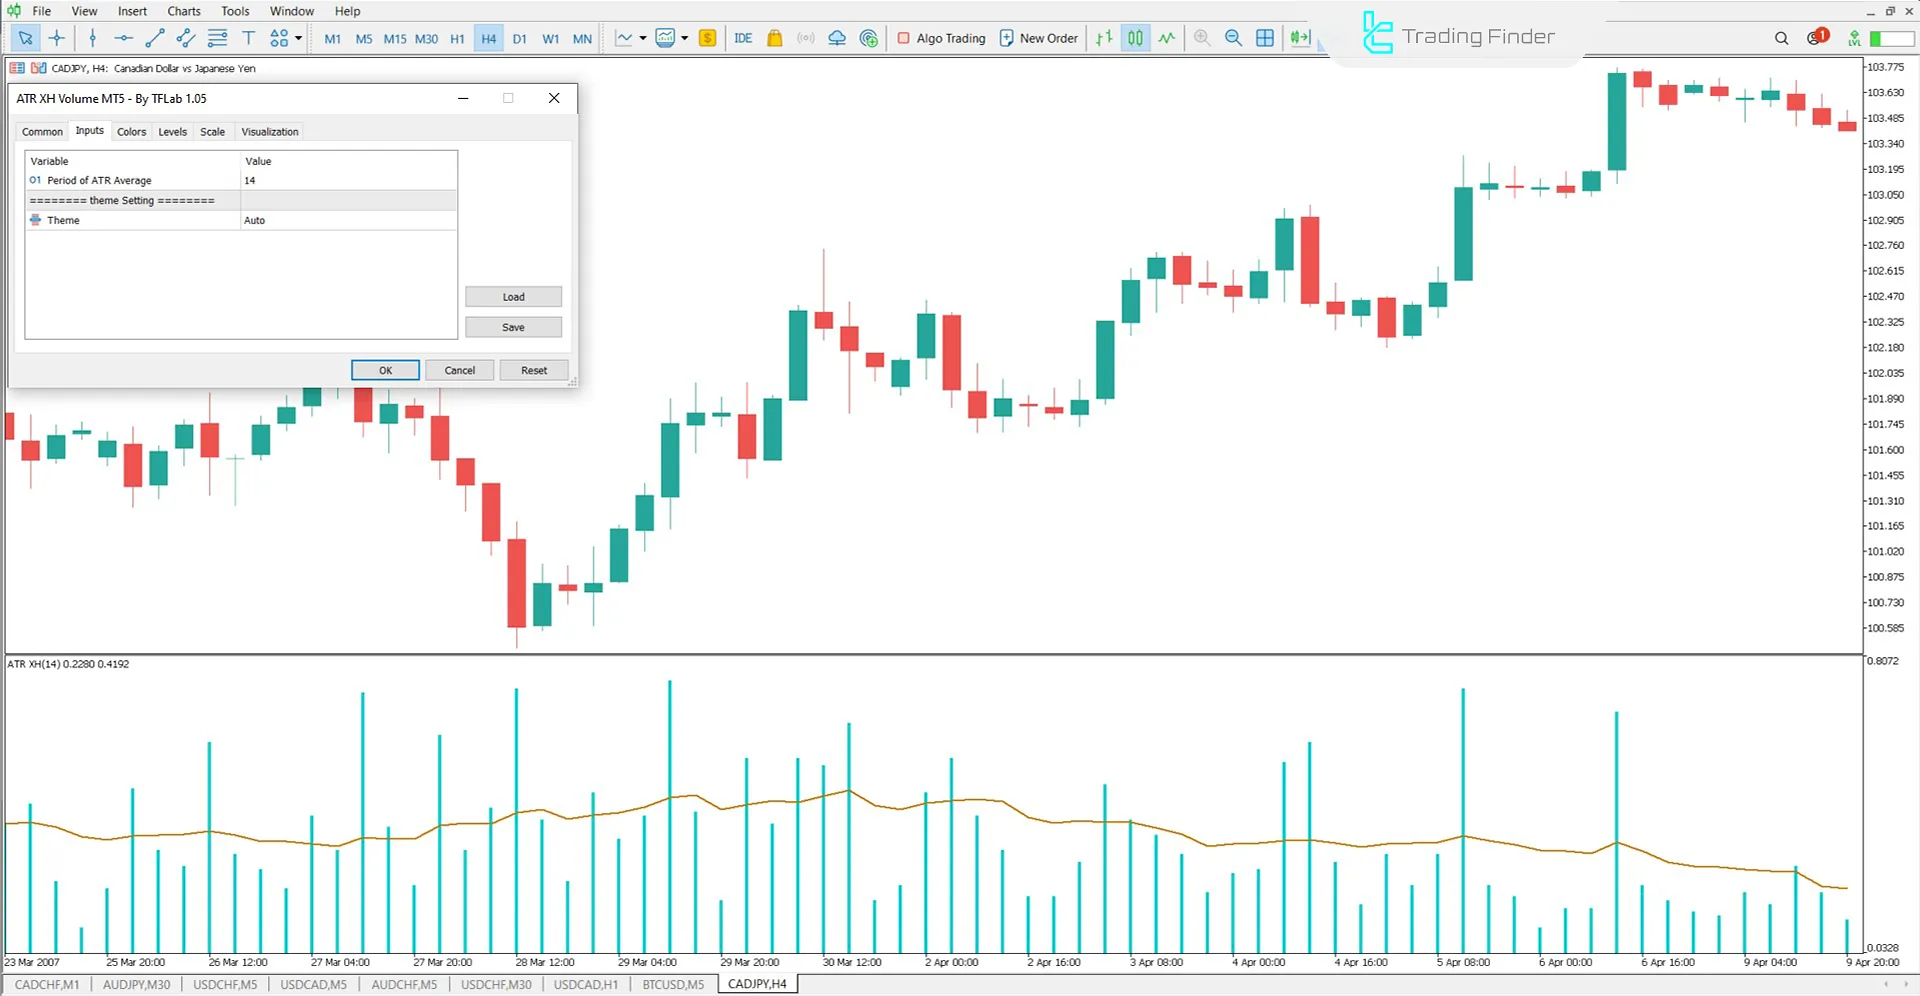
The following image shows the settings for this indicator:

- Period of ATR Average: Calculates the volume period based on ATR.
Conclusion
The ATR XH Volume Indicator, a composite tool in MetaTrader 5, is designed to analyze market trends and identify key levels on price charts.
This tool combines the ATR (Average True Range) with trading volume to examine market volatility. It helps identify entry and exit zones in conjunction with volume changes.
ATR XH Volume MT5 PDF
ATR XH Volume MT5 PDF
Click to download ATR XH Volume MT5 PDFDoes this indicator provide buy and sell signals?
No, this indicator does not issue buy or sell signals.
Is this indicator suitable for all markets?
Yes, the ATR XH Volume Indicator is suitable for Forex, stocks, and cryptocurrency markets.


