![Auto Pivot Lines Indicator for MetaTrader 5 Download - [TradingFinder]](https://cdn.tradingfinder.com/image/394108/2-67-en-auto-pivot-lines-mt5-1.webp)
![Auto Pivot Lines Indicator for MetaTrader 5 Download - [TradingFinder] 0](https://cdn.tradingfinder.com/image/394108/2-67-en-auto-pivot-lines-mt5-1.webp)
![Auto Pivot Lines Indicator for MetaTrader 5 Download - [TradingFinder] 1](https://cdn.tradingfinder.com/image/394111/2-67-en-auto-pivot-lines-mt5-2.webp)
![Auto Pivot Lines Indicator for MetaTrader 5 Download - [TradingFinder] 2](https://cdn.tradingfinder.com/image/394109/2-67-en-auto-pivot-lines-mt5-3.webp)
![Auto Pivot Lines Indicator for MetaTrader 5 Download - [TradingFinder] 3](https://cdn.tradingfinder.com/image/394110/2-67-en-auto-pivot-lines-mt5-4.webp)
The Auto Pivot Lines indicator is a technical analysis tool that automatically identifies potential market reversal zones by analyzing the last 20 highs and lows.
This MetaTrader 5 trading tool evaluates each candle's Open, High, Low, and Close data, identifies three consecutive peaks or troughs in the same direction as pivot points, and draws lines to indicate price retracement levels.
Auto Pivot Lines SpecificationsTable
The table below shows the general features and specifications of the Auto Pivot Lines Indicator on the MetaTrader 5 platform:
Indicator Categories: | Pivot Points & Fractals MT5 Indicators Liquidity Indicators MT5 Indicators Trading Assist MT5 Indicators |
Platforms: | MetaTrader 5 Indicators |
Trading Skills: | Intermediate |
Indicator Types: | Trend MT5 Indicators Reversal MT5 Indicators |
Timeframe: | Multi-Timeframe MT5 Indicators |
Trading Style: | Intraday MT5 Indicators |
Trading Instruments: | Forex MT5 Indicators Crypto MT5 Indicators Stock MT5 Indicators Commodity MT5 Indicators Indices MT5 Indicators Share Stock MT5 Indicators |
Auto Pivot Lines at a Glance
The Auto Pivot Lines Indicator identifies three consecutive peaks or troughs, then draws a pivot line displayed as a dashed extension.
To indicate different timeframes, it uses: Blue for long-term levels (based on 20 pivots), Green for mid-term levels (based on custom middle pivots), Red for short-term levels (in the current timeframe).
Uptrend Conditions
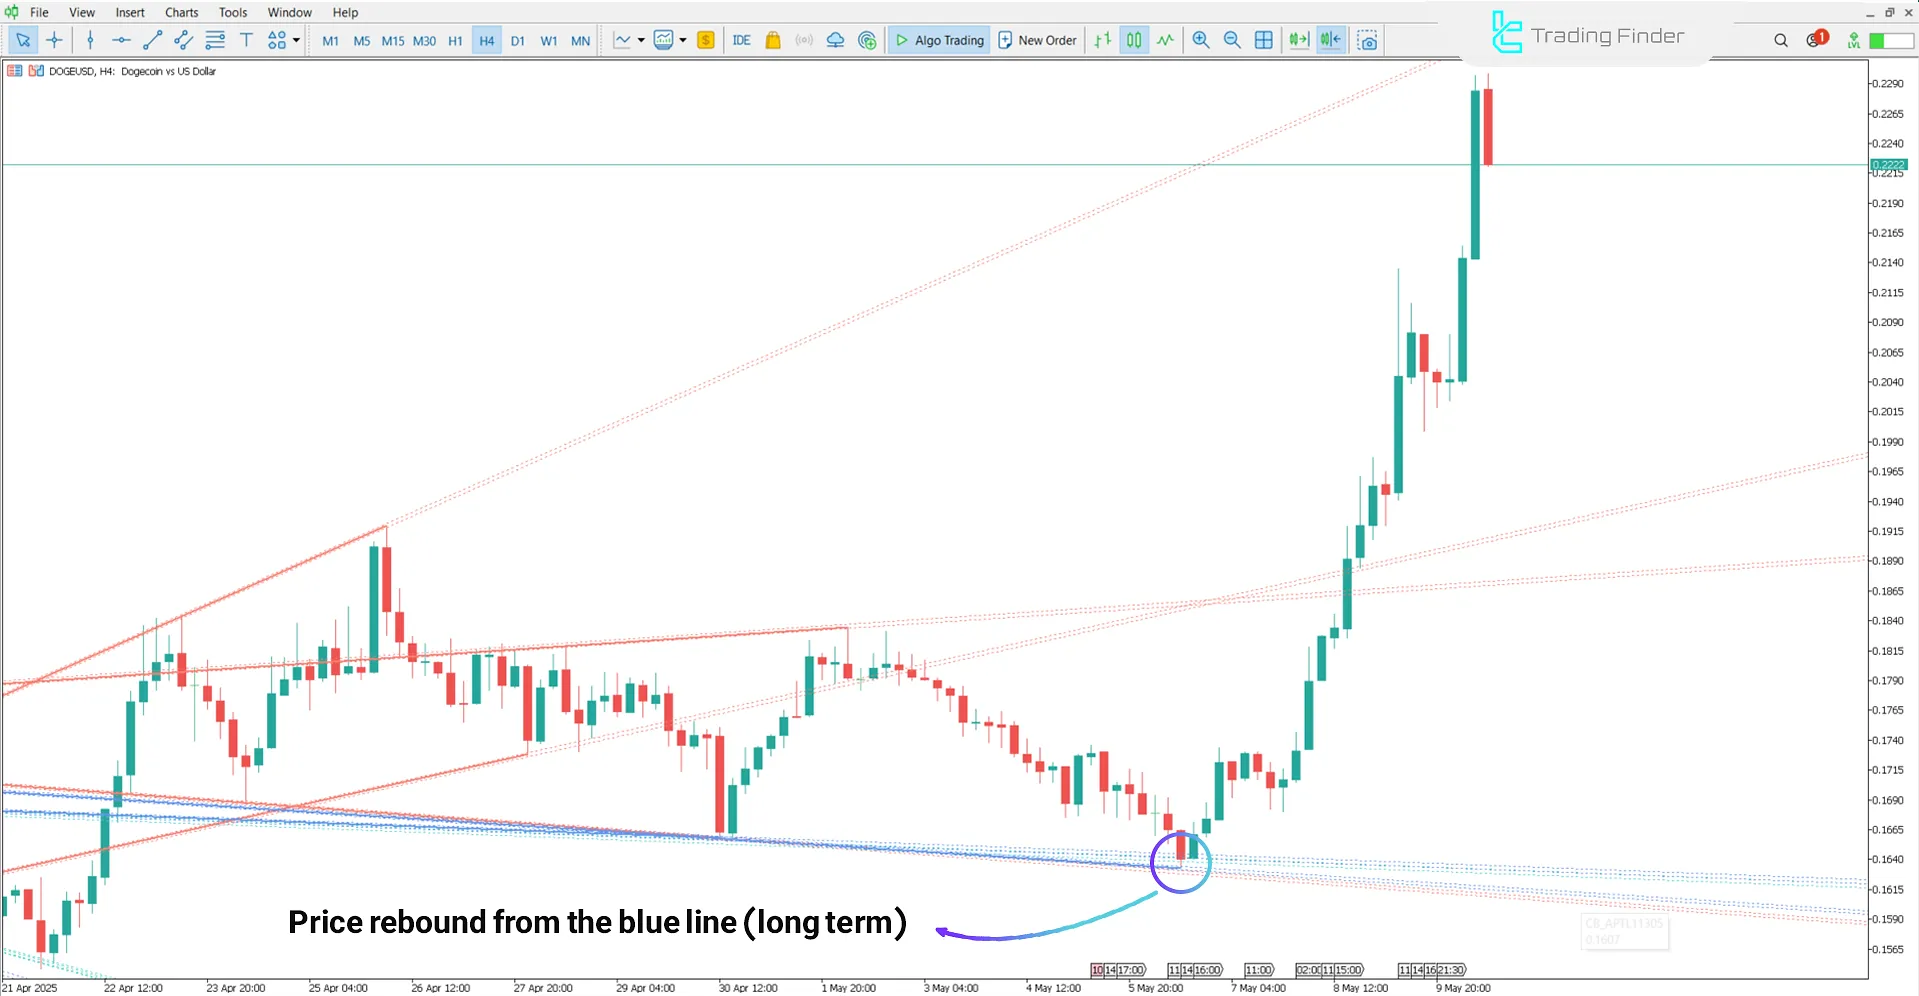
The image below shows the DOGE/USDT price chart on the 4-hour timeframe.
This indicator analyzes the last 20 pivot points, identifies three aligned peaks, and draws a blue line based on them. When the price reaches this blue line, a price reversal or trend change often occurs.

Downtrend Conditions
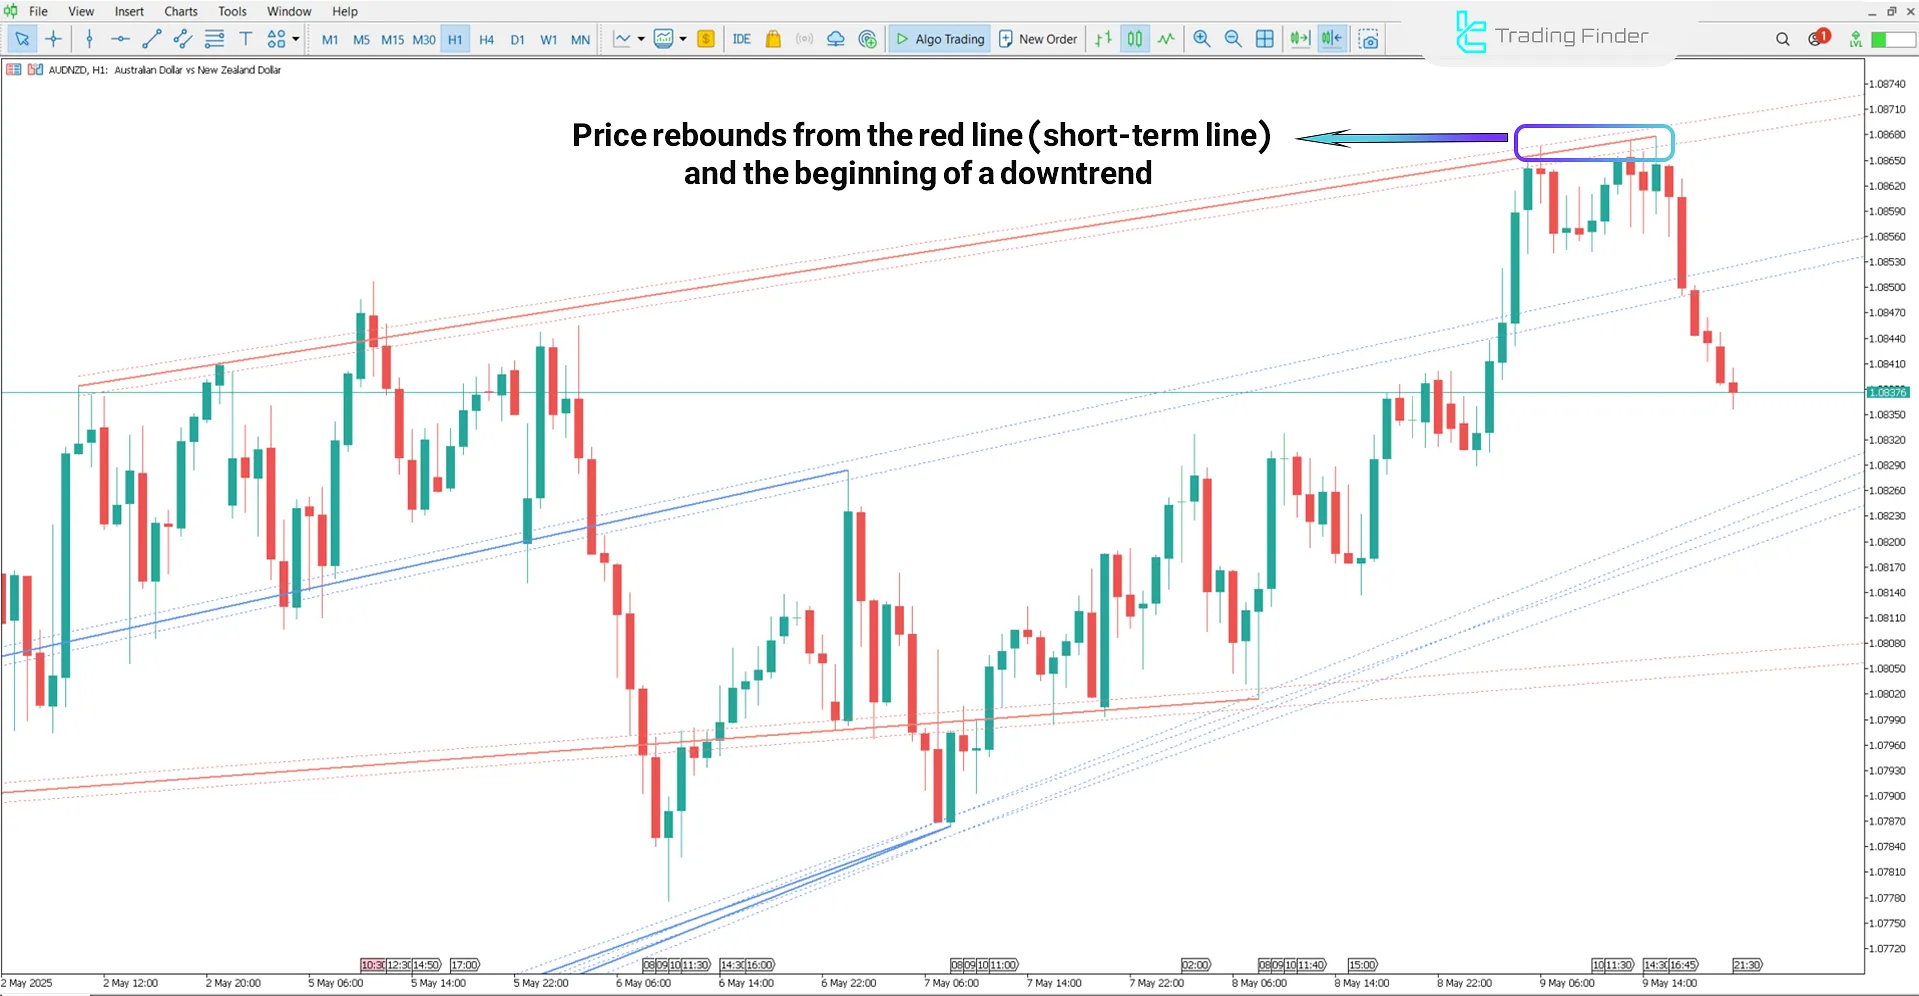
In the 1-hour timeframe of the AUD/NZD currency pair, the Auto Pivot Lines Indicator identifies three consecutive peaks in a short-term range and draws a red line. When the price hits this line, it signals the start of a downtrend.

Auto Pivot Lines Indicator Settings
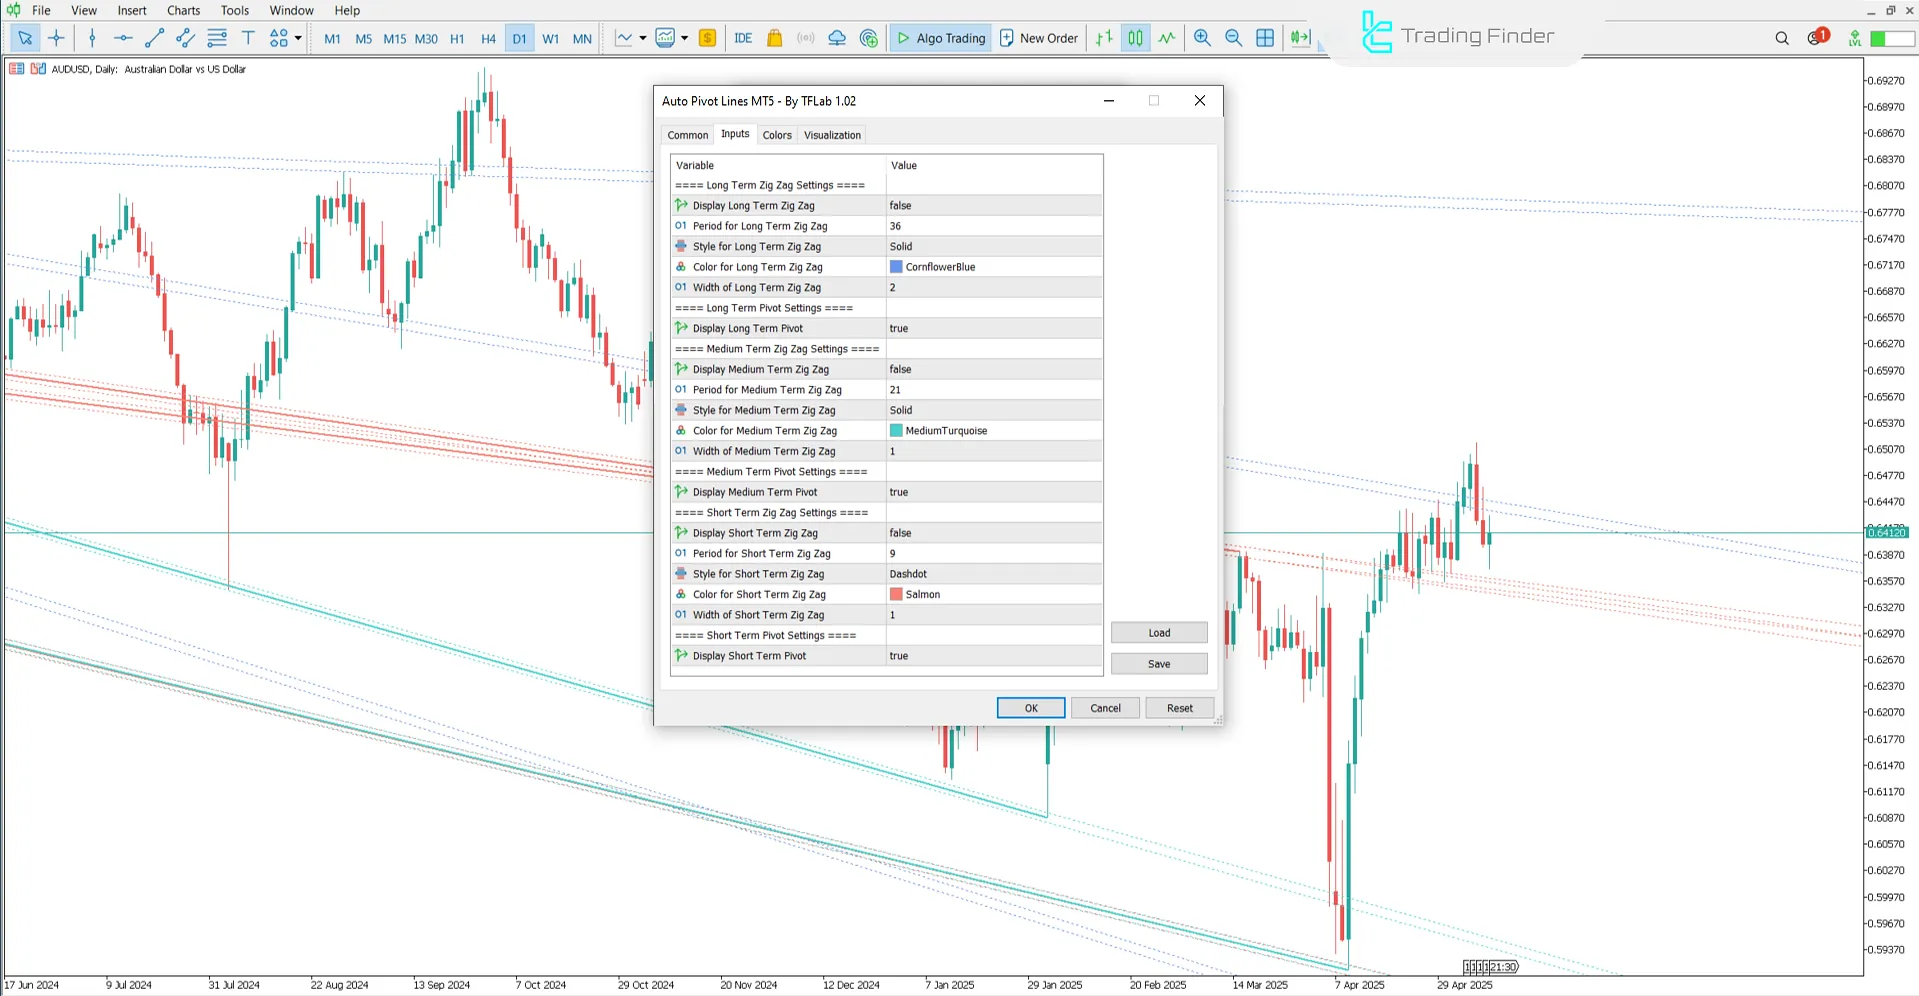
The settings panel of the Auto Pivot Lines Indicator is shown below:

- Display of the Long Term Zig Zag Line: Toggle visibility of the long-term ZigZag line
- Pivot period for the long-term zigzag line: Set the pivot interval used for long-term ZigZag calculation
- Style of the Long Term Zig Zag Line: Select the design style for the long-term ZigZag line
- Color of the Long Term Zig Zag Line: Choose the color applied to the long-term ZigZag pattern
- Width of the Long Term Zig Zag Line: Adjust the stroke thickness of the long-term ZigZag path
- Display of the Long-Term Pivot Line: Show or hide the pivot line derived from long-term analysis
- Display of the Medium-Term Zig Zag Line: Enable drawing of the medium-term ZigZag structure
- Pivot period for the Medium Term Zig Zag Line: Define the bar range for medium-term pivot calculation
- Style of the Medium-Term Zig Zag Line: Pick the style for displaying the medium ZigZag line
- Color of the Medium-Term Zig Zag Line: Assign a color to the medium-term ZigZag segment
- Width of the Medium Term Zig Zag Line: Modify the line width for medium-term trend illustration
- Enable display of the Medium Term Pivot Line: Turn on the pivot line display for mid-term zones
- Display of the Short-Term Zig Zag Line: Activate the short-term ZigZag display option
- Pivot period for the Short-Term Zig Zag Line: Configure the pivot period for short-term market swings
- Style of the Short-Term Zig Zag Line: Customize the visual format of the short-term ZigZag line
- Color of the Short-Term Zig Zag Line: Apply a specific color to highlight short-term price turns
- Width of the Short-Term Zig Zag Line: Set the line thickness for short-term ZigZag rendering
- Display of the Short-Term Pivot Line: Display the most recent pivot line for short-term action
Conclusion
The Auto Pivot Lines Indicator analyzes the last 20 highs and lows, identifies three aligned pivot points, and automatically draws lines on the chart.
These lines are extended using dashed lines to significant reversal or trend continuation zones and are color-coded as:Blue for long-term, Green for mid-term, Red for short-term timeframes.
Auto Pivot Lines MT5 PDF
Auto Pivot Lines MT5 PDF
Click to download Auto Pivot Lines MT5 PDFWhich financial markets is the Auto Pivot Lines Indicator applicable to?
This indicator can be used across all markets, including cryptocurrencies, Forex, stocks, and commodities.
On which timeframes can the Auto Pivot Lines Indicator be used?
The Auto Pivot Lines Indicator is fully compatible with all timeframes.


