![Average Daily Range (ADR) Indicator for MT5 Download - Free - [TFlab]](https://cdn.tradingfinder.com/image/274381/4-56-en-average-daily-range-mt5-1.webp)
![Average Daily Range (ADR) Indicator for MT5 Download - Free - [TFlab] 0](https://cdn.tradingfinder.com/image/274381/4-56-en-average-daily-range-mt5-1.webp)
![Average Daily Range (ADR) Indicator for MT5 Download - Free - [TFlab] 1](https://cdn.tradingfinder.com/image/274379/4-56-en-average-daily-range-mt5-2.webp)
![Average Daily Range (ADR) Indicator for MT5 Download - Free - [TFlab] 2](https://cdn.tradingfinder.com/image/274377/4-56-en-average-daily-range-mt5-3.webp)
![Average Daily Range (ADR) Indicator for MT5 Download - Free - [TFlab] 3](https://cdn.tradingfinder.com/image/274378/4-56-en-average-daily-range-mt5-4.webp)
The Average Daily Range (ADR) Indicator is one of the most powerful tools in the MetaTrader 5 indicators suite. It is designed to analyze daily price volatility.
If the price approaches ADR High, it indicates buyer weakness, suggesting a potential price reversal or correction. Conversely, if the price nears ADR Low, it may indicate weakness among sellers.
Indicator Specifications Table
The table below summarizes the key features of this indicator.
Indicator Categories: | Support & Resistance MT5 Indicators Trading Assist MT5 Indicators Risk Management MT5 Indicators |
Platforms: | MetaTrader 5 Indicators |
Trading Skills: | Intermediate |
Indicator Types: | Range MT5 Indicators Reversal MT5 Indicators |
Timeframe: | Multi-Timeframe MT5 Indicators |
Trading Style: | Intraday MT5 Indicators |
Trading Instruments: | Forex MT5 Indicators Crypto MT5 Indicators Stock MT5 Indicators |
Overview of the Indicator
ADR levels in this indicator are automatically plotted in orange, allowing analysts to use these zones to determine entry and exit points while effectively managing risk.
In summary, the ADR Indicator is a specialized and efficient tool that provides a clear perspective on price range movements. It helps traders control risk and enhance trading performance.
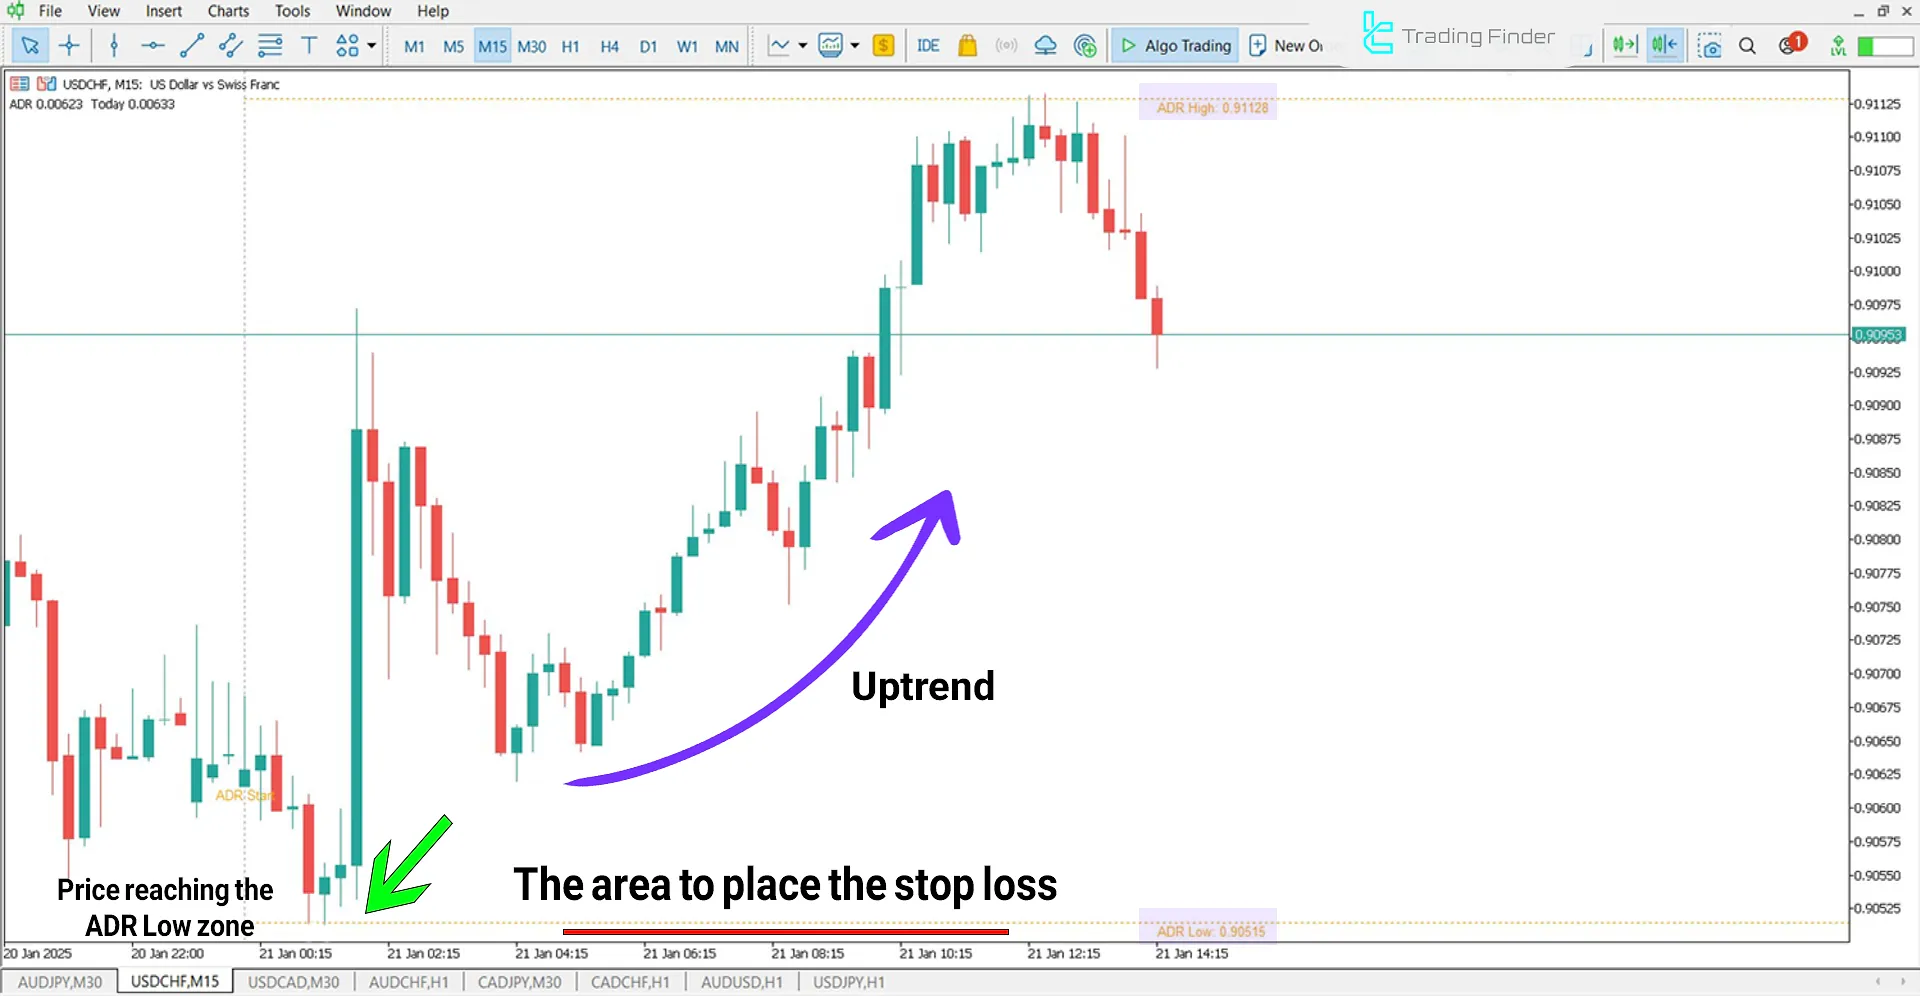
ADR in an Uptrend
If the price approaches ADR Low, it may indicate decreasing seller strength.
In such conditions, the probability of a bullish reversal increases, and this level might act as daily support.

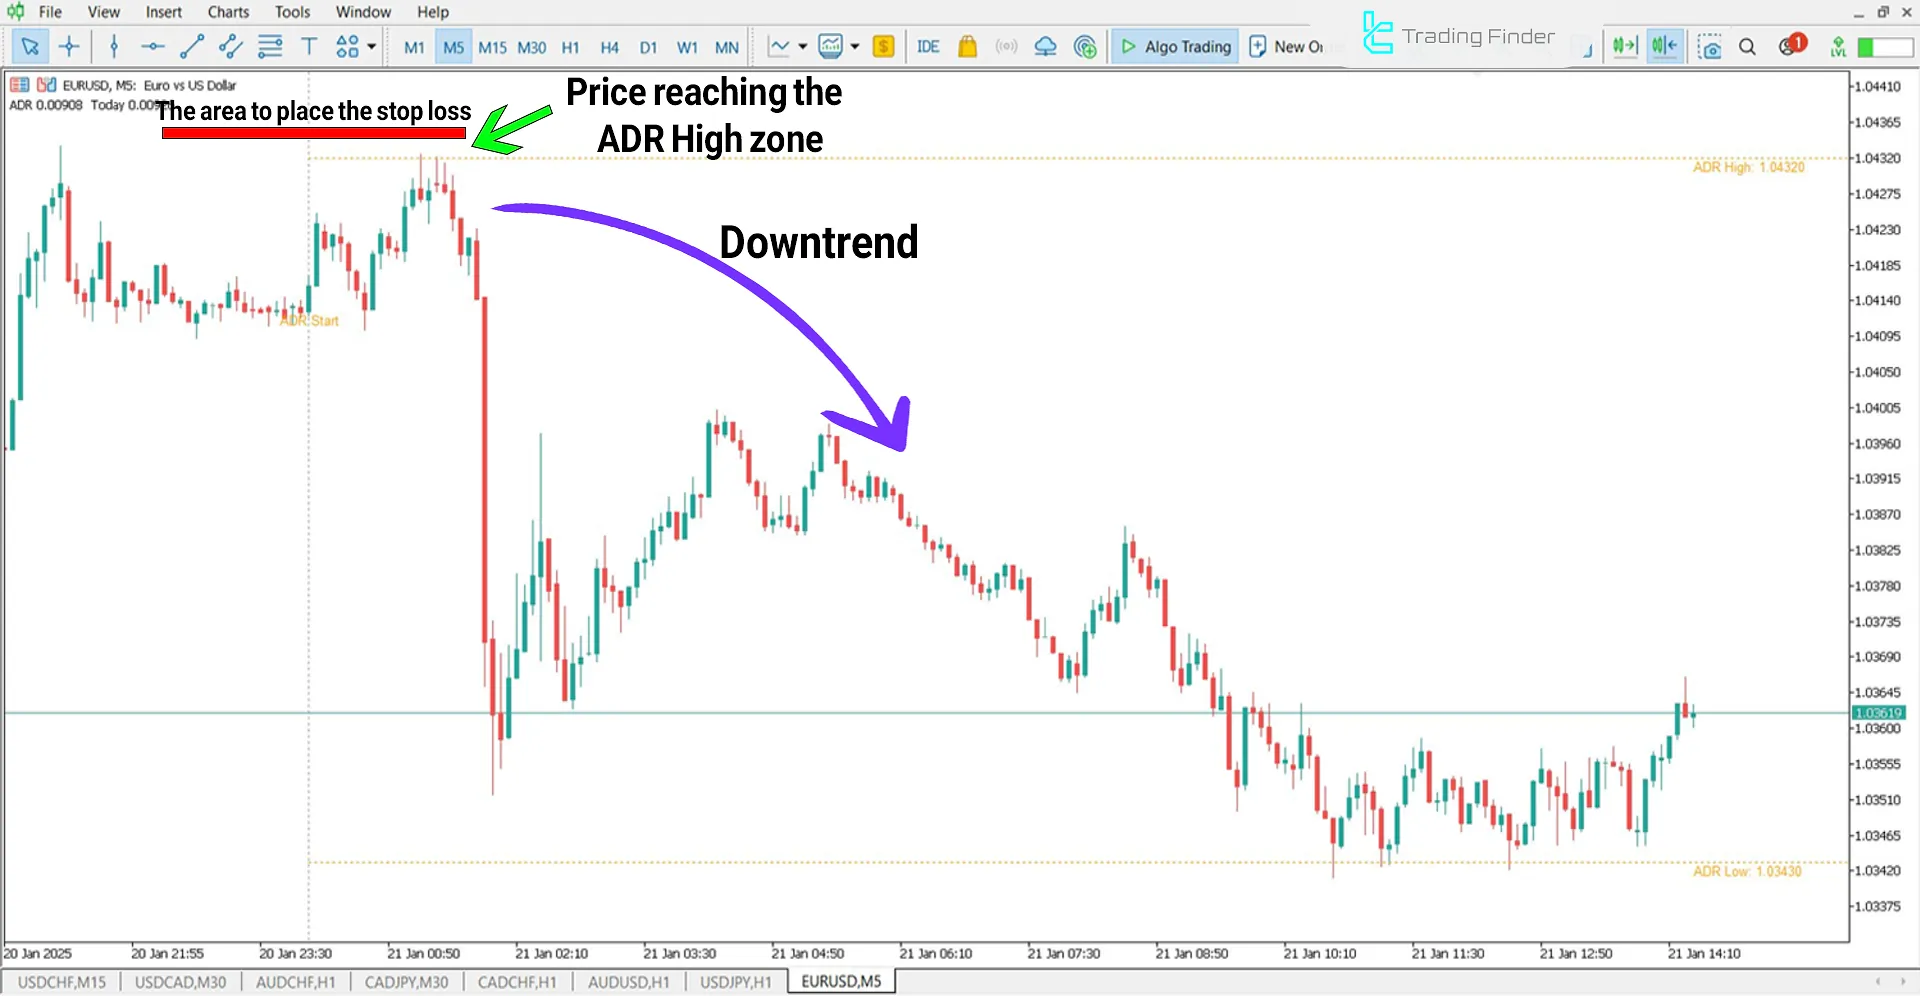
ADR in a Downtrend
Reaching ADR High suggests weakening buyer strength. The likelihood of a price correction or trend reversal increases in this situation.
This level may act as daily resistance. Traders should look for reversal candlesticks or declining buying volume to improve their analysis accuracy.

ADR Indicator Settings
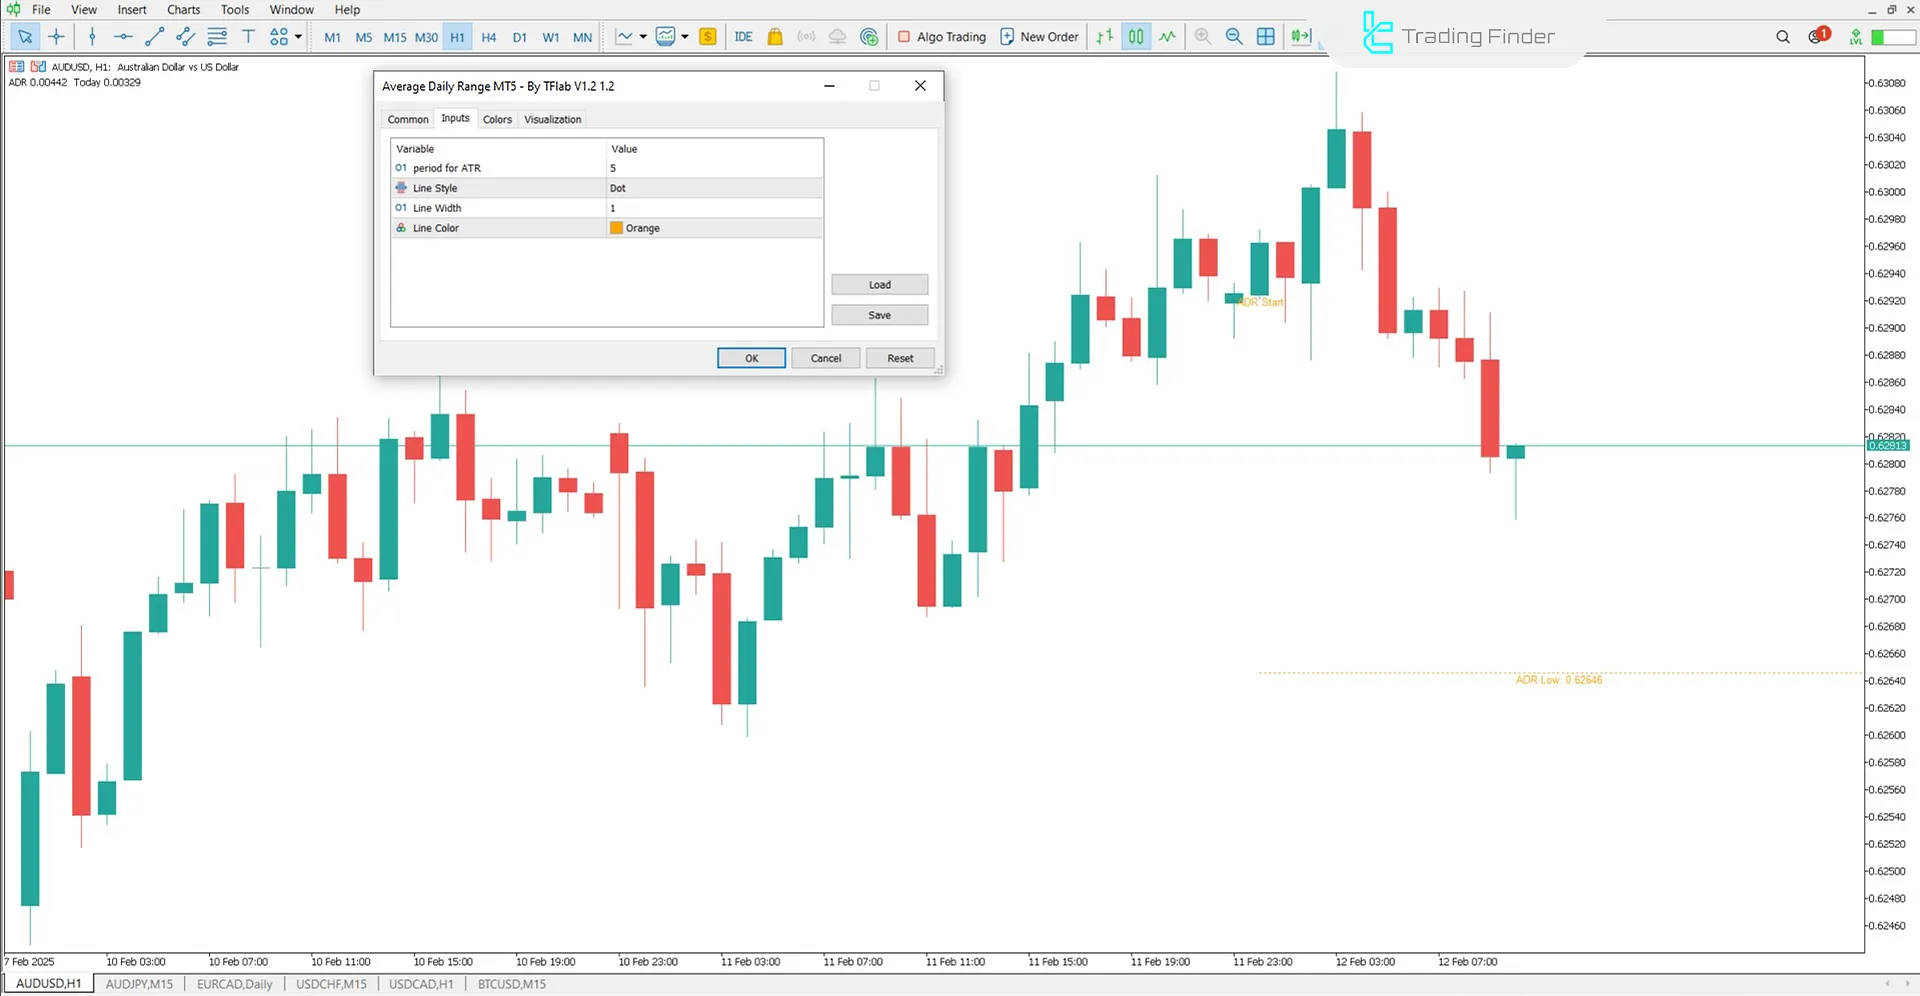
The following image displays the complete settings of the ADR Indicator:

- Period for ATR: Sets the ATR calculation period for defining levels
- Line Style: Determines the indicator line style
- Line Width: Sets the line width
- Line Color: Defines the line color
Conclusion
The Average Daily Range (ADR) Indicator not only enables traders to identify the daily high and low price ranges but also plays a key role in precisely planning entry and exit points.
Average Daily Range ADR MT5 PDF
Average Daily Range ADR MT5 PDF
Click to download Average Daily Range ADR MT5 PDFCan this indicator be used for risk management?
Yes, traders can use ADR High and low levels to set Stop Loss (SL) and Take Profit (TP) points, which helps them manage their risk more effectively.
Is the ADR Indicator applicable to all markets?
The ADR Indicator can be used in various markets, including Forex, cryptocurrencies, and stocks.
It's not working on mt5.Just a single line is coming .
Please review the usage guide carefully, and if the issue still persists, you can contact support through the online chat for assistance.
Thank you for the ADR indicator. I was looking forward to seeing an ADR Indicator that has the following features - 1. Percentage of ADR for ENTRY. ADR Percentage UP line ADR Percentage DOWN line 2. Percentage of ADR for TARGET. ADR Percentage UP line ADR Percentage DOWN line Thank you for looking into these features and possibly inventing it. Kind regards.
i forward your feedback to our developer team. thank you for feedback


