![Balanced Volume Oscillator for MetaTrader 5 Download - Free – [TFlab]](https://cdn.tradingfinder.com/image/183270/4-30-en-balanced-volume-oscillator-mt5-1.webp)
![Balanced Volume Oscillator for MetaTrader 5 Download - Free – [TFlab] 0](https://cdn.tradingfinder.com/image/183270/4-30-en-balanced-volume-oscillator-mt5-1.webp)
![Balanced Volume Oscillator for MetaTrader 5 Download - Free – [TFlab] 1](https://cdn.tradingfinder.com/image/183237/4-30-en-balanced-volume-oscillator-mt5-2.webp)
![Balanced Volume Oscillator for MetaTrader 5 Download - Free – [TFlab] 2](https://cdn.tradingfinder.com/image/183238/4-30-en-balanced-volume-oscillator-mt5-3.webp)
![Balanced Volume Oscillator for MetaTrader 5 Download - Free – [TFlab] 3](https://cdn.tradingfinder.com/image/183239/4-30-en-balanced-volume-oscillator-mt5-4.webp)
The Balanced Volume Oscillator is one of the MetaTrader 5 indicators, serving as an effective tool for analyzing trading volumes by evaluating volume changes relative to the periodic average and Fibonacci levels.
This indicator usescolor-coded histograms to provide a clear picture of market volume flow, showing whether trading volume is increasing or decreasing.
The varied histogram colors in this oscillator, such as red, green, yellow, purple, and blue, indicate different volume levels, enabling traders to quickly identify divergences and potential reversal zones (PRZ).
Balanced Volume Oscillator Specifications Table
This table provides a concise explanation of this indicator's details:
Indicator Categories: | Oscillators MT5 Indicators Support & Resistance MT5 Indicators Trading Assist MT5 Indicators |
Platforms: | MetaTrader 5 Indicators |
Trading Skills: | Intermediate |
Indicator Types: | Trend MT5 Indicators Reversal MT5 Indicators |
Timeframe: | Multi-Timeframe MT5 Indicators |
Trading Style: | Day Trading MT5 Indicators |
Trading Instruments: | Forex MT5 Indicators Crypto MT5 Indicators Stock MT5 Indicators Share Stock MT5 Indicators |
Indicator Overview
In the Balanced Volume Oscillator, histogram bars are designed to display the current trading volume relative to the average periodic volume.
Each bar is color-coded to represent specific volume changes compared to the periodic average and Fibonacci levels:
- Red: Volume below the periodic average
- Green: Volume above the 38.2% Fibonacci level
- Yellow: Volume between 38.2% and 61.8% Fibonacci levels
- Purple: Volume between 61.8% and 100% Fibonacci levels
- Blue: Volume above the 100% Fibonacci level
Indicator in an Uptrend
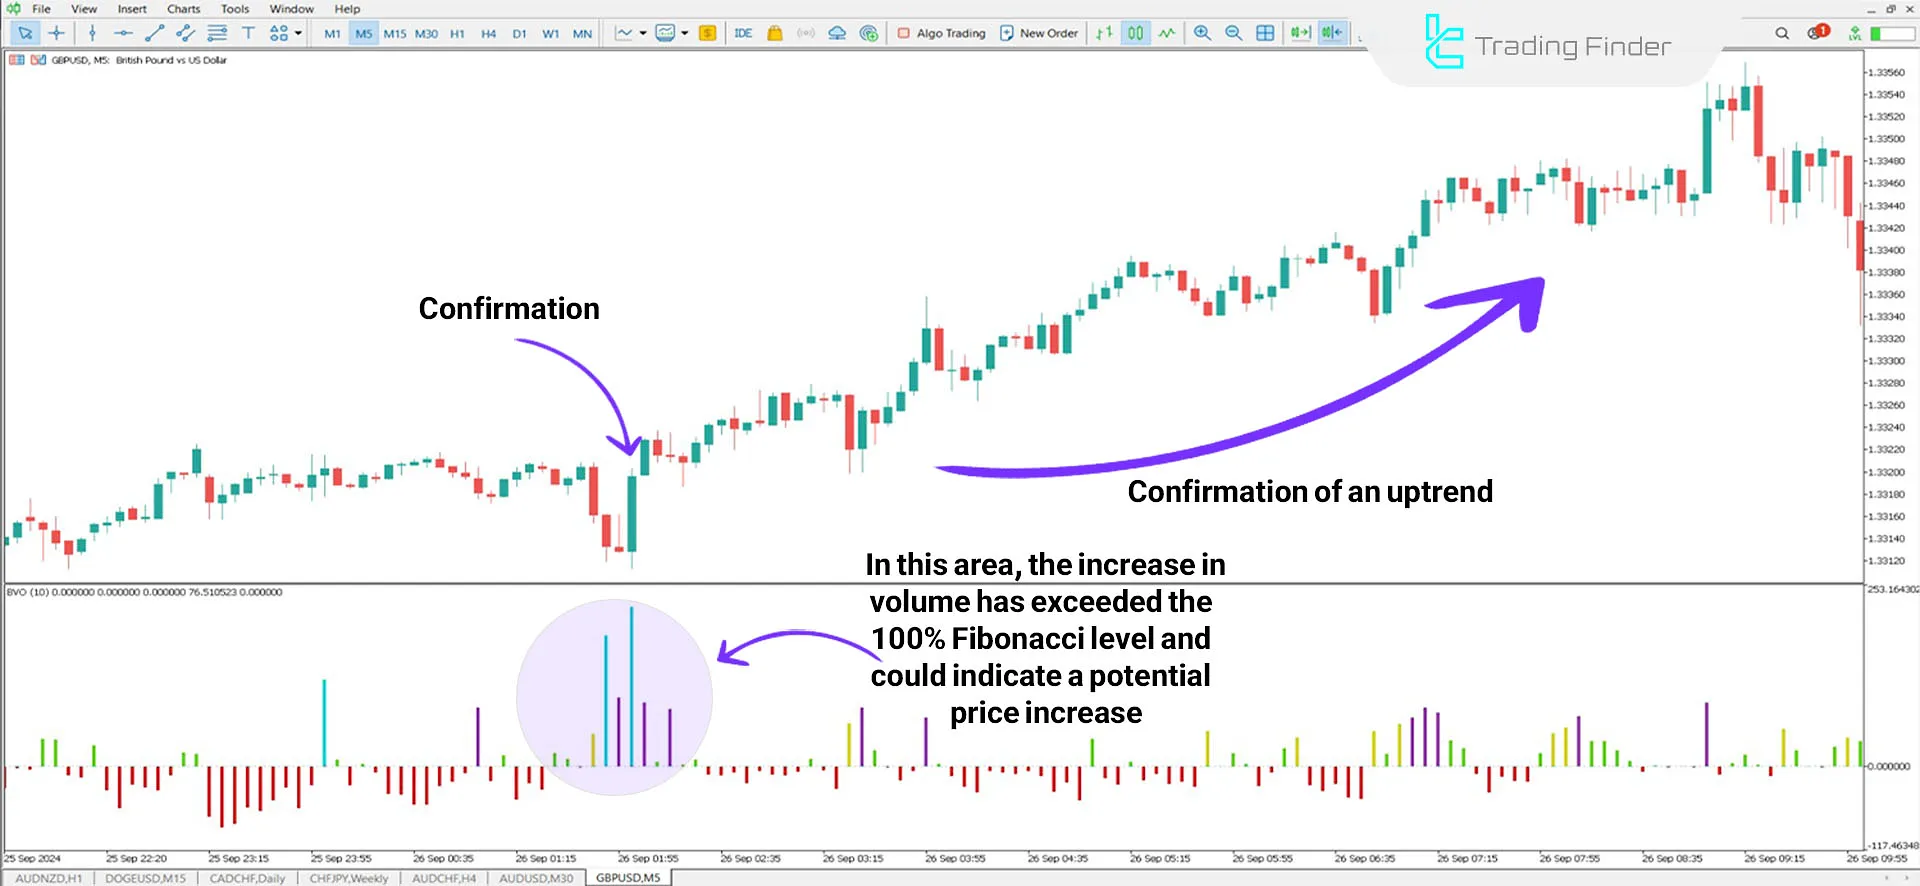
The chart under review pertains to the GBP/USD currency pair. Red bars in the histogram of the Balanced Volume Oscillator indicate significant trading volume.
Traders can initiate a Buy position by observing increased trading volume (purple and blue bars) and receiving confirmations by forming bullish candlesticks near key support levels.

Indicator in a Downtrend
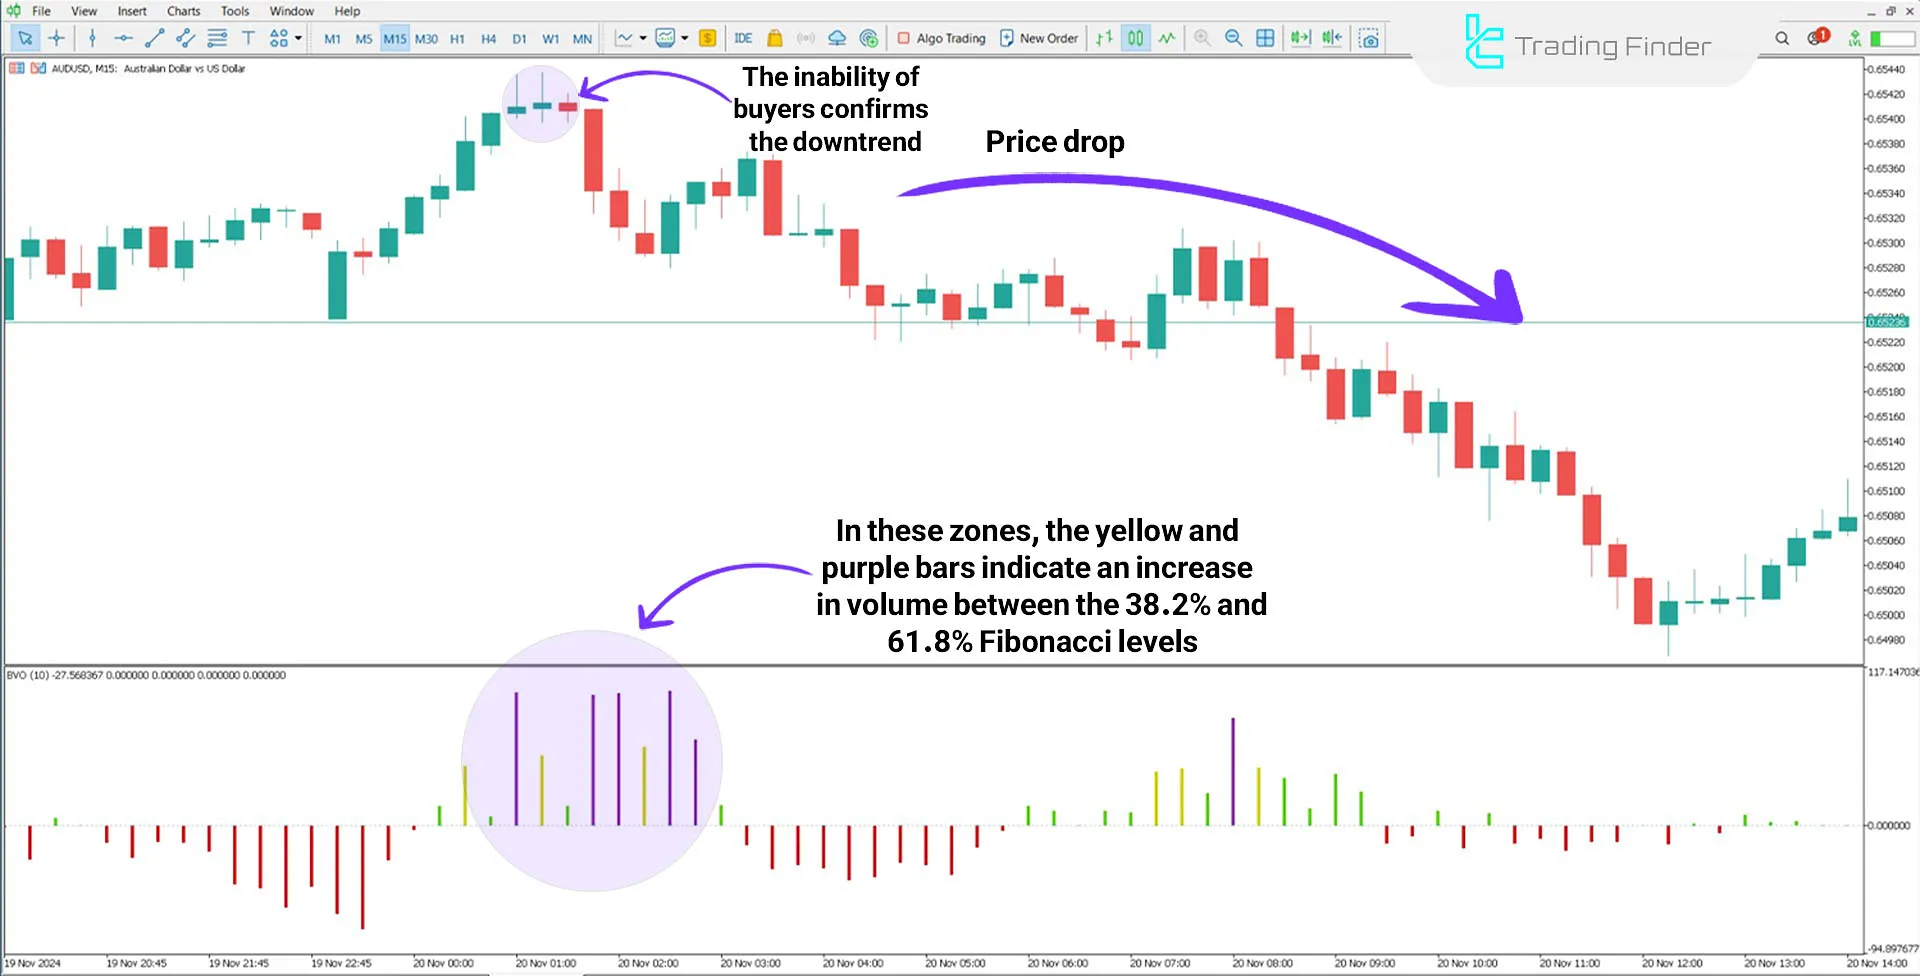
In the price chart of the AUD/USD currency pair in a 15-minute time frame, the price reaches a new high, and the histogram bars change to yellow and purple.
This color change indicates an increase in market volume, signaling the formation of a bearish divergence and increasing the likelihood of a trend reversal.
In such scenarios, traders should await confirmations such as the formation of reversal candlesticks or the price breaking through resistance levels before entering a trade.

Indicator Settings
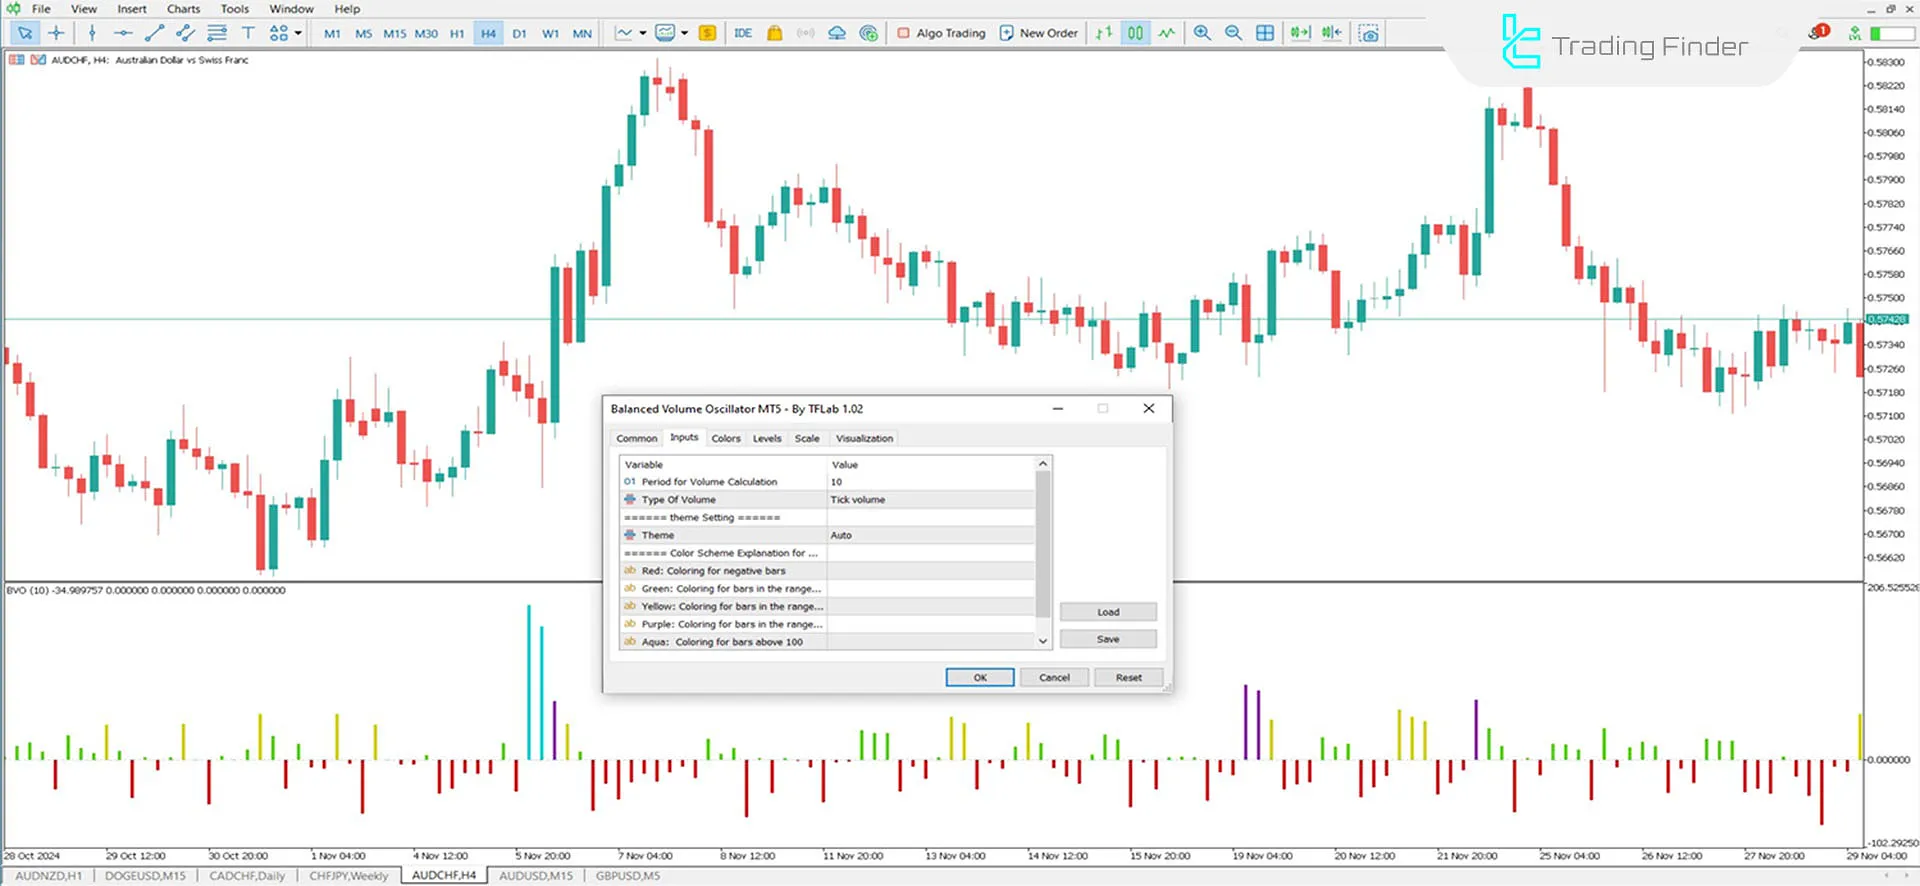
The indicator settings are shown in the image below:

- Period for Volume Calculation: Number of periods for volume calculation
- Theme: Auto theme adjustment for display
- Red Coloring for Negative Bars: Displays negative volume in red
- Green Coloring for Bars in the Range 0 - 38.2: Displays volume between 0 and 38.2 in green
- Yellow Coloring for Bars in the Range 38.2 - 61.8: Displays volume between 38.2 and 61.8 in yellow
- Purple Coloring for Bars in the Range 61.8 - 100: Displays volume between 61.8 and 100 in purple
- Aqua Coloring for Bars Above 100: Displays volume above 100 in light blue
Conclusion
Using its varied color coding, this indicator displays changes in trading volume relative to the periodic average, providing a better understanding of market trends.
The oscillator performs more accurately and efficiently in short time frames, such as 15 minutes.
To achieve more precise analyses, traders can utilize the Auto Fibo indicator as a supplementary tool alongside this indicator.
Balanced Volume Oscillator MT5 PDF
Balanced Volume Oscillator MT5 PDF
Click to download Balanced Volume Oscillator MT5 PDFWhat is the Balanced Volume Oscillator Indicator?
The Balanced Volume Oscillator (BVO) is an analytical tool that combines price changes and trading volume to identify trends and divergences.
Why does the indicator perform better in short time frames?
In short time frames, the indicator better reflects momentary changes in volume.


