![Better DMX Jurik Histogram Indicator for MetaTrader 5 Download - Free - [TFlab]](https://cdn.tradingfinder.com/image/203682/4-41-en-better-dmx-jurik-histogram-mt5-1.webp)
![Better DMX Jurik Histogram Indicator for MetaTrader 5 Download - Free - [TFlab] 0](https://cdn.tradingfinder.com/image/203682/4-41-en-better-dmx-jurik-histogram-mt5-1.webp)
![Better DMX Jurik Histogram Indicator for MetaTrader 5 Download - Free - [TFlab] 1](https://cdn.tradingfinder.com/image/203652/4-41-en-better-dmx-jurik-histogram-mt5-2.webp)
![Better DMX Jurik Histogram Indicator for MetaTrader 5 Download - Free - [TFlab] 2](https://cdn.tradingfinder.com/image/203653/4-41-en-better-dmx-jurik-histogram-mt5-3.webp)
![Better DMX Jurik Histogram Indicator for MetaTrader 5 Download - Free - [TFlab] 3](https://cdn.tradingfinder.com/image/203659/4-41-en-better-dmx-jurik-histogram-mt5-4.webp)
The Better DMX Jurik Histogram Indicator is one of the tools available in MetaTrader 5 indicators, designed by Welles Wilder to identify the directional movement of asset prices. This oscillator combines the Directional Movement Tool with the Jurik-smoothed filter to effectively reduce noise and lag in market trends, making price analysis more straightforward and precise.
This indicator comprises two moving averages (MAs) and a histogram, which are used to identify price movements.The blue moving average represents faster price movements, while the orange moving average indicates slower ones.
Indicator Specifications
The following table highlights the key features of the Better DMX Jurik Histogram Indicator:
Indicator Categories: | Oscillators MT5 Indicators Currency Strength MT5 Indicators Trading Assist MT5 Indicators |
Platforms: | MetaTrader 5 Indicators |
Trading Skills: | Intermediate |
Indicator Types: | Lagging MT5 Indicators Reversal MT5 Indicators |
Timeframe: | Multi-Timeframe MT5 Indicators |
Trading Style: | Intraday MT5 Indicators |
Trading Instruments: | Forex MT5 Indicators Crypto MT5 Indicators Stock MT5 Indicators Indices MT5 Indicators Forward MT5 Indicators Share Stock MT5 Indicators |
Overview
The Better DMX Jurik Histogram is designed to detect the strength and direction of price movements. It simplifies data visualization through the use of the Jurik Histogram (DMX), which filters out unnecessary noise and lag, providing clear signals for identifying market trends.
By oscillating within specific ranges, this indicator also highlights overbought and oversold levels, where values above +60 typically indicate overbought conditions, and values below -60 suggest oversold conditions.
Buy Trades Using Better DMX Jurik Histogram
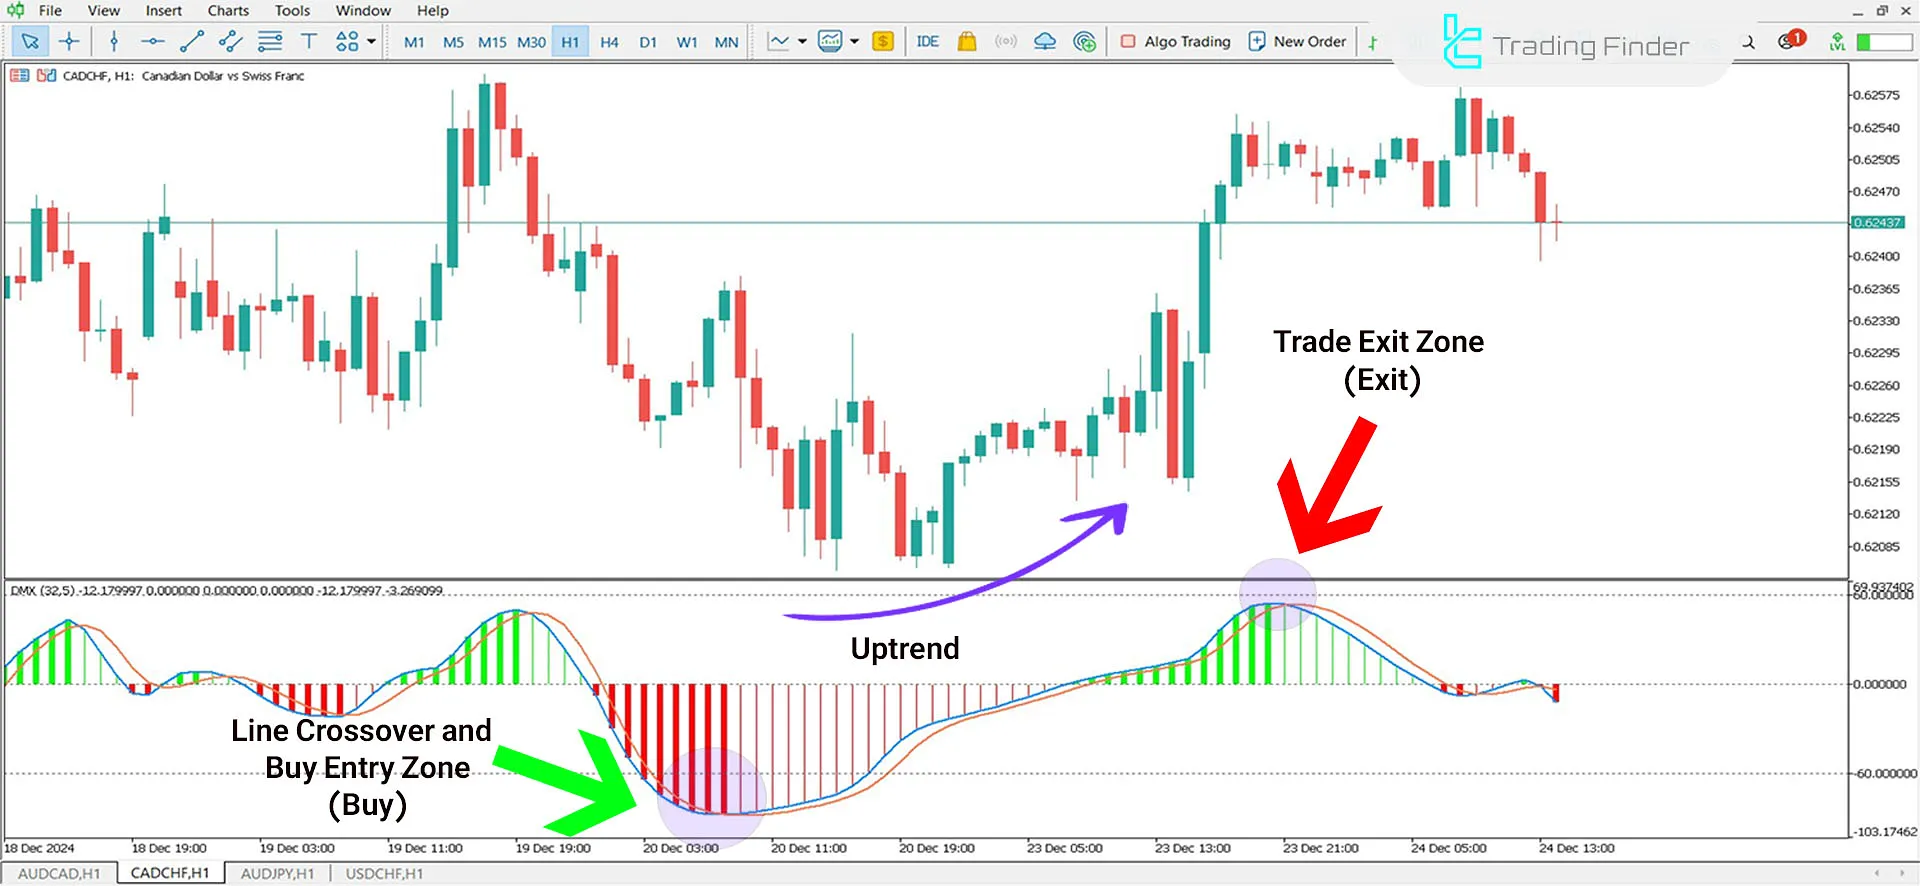
The CAD/CHF currency pair chart in the 1-hour timeframe demonstrates how the market turns bullish.
When theblue line crosses above the orange line near the -60 level, this movement serves as a signal to enter a buy trade.

Sell Trades Using Better DMX Jurik Histogram
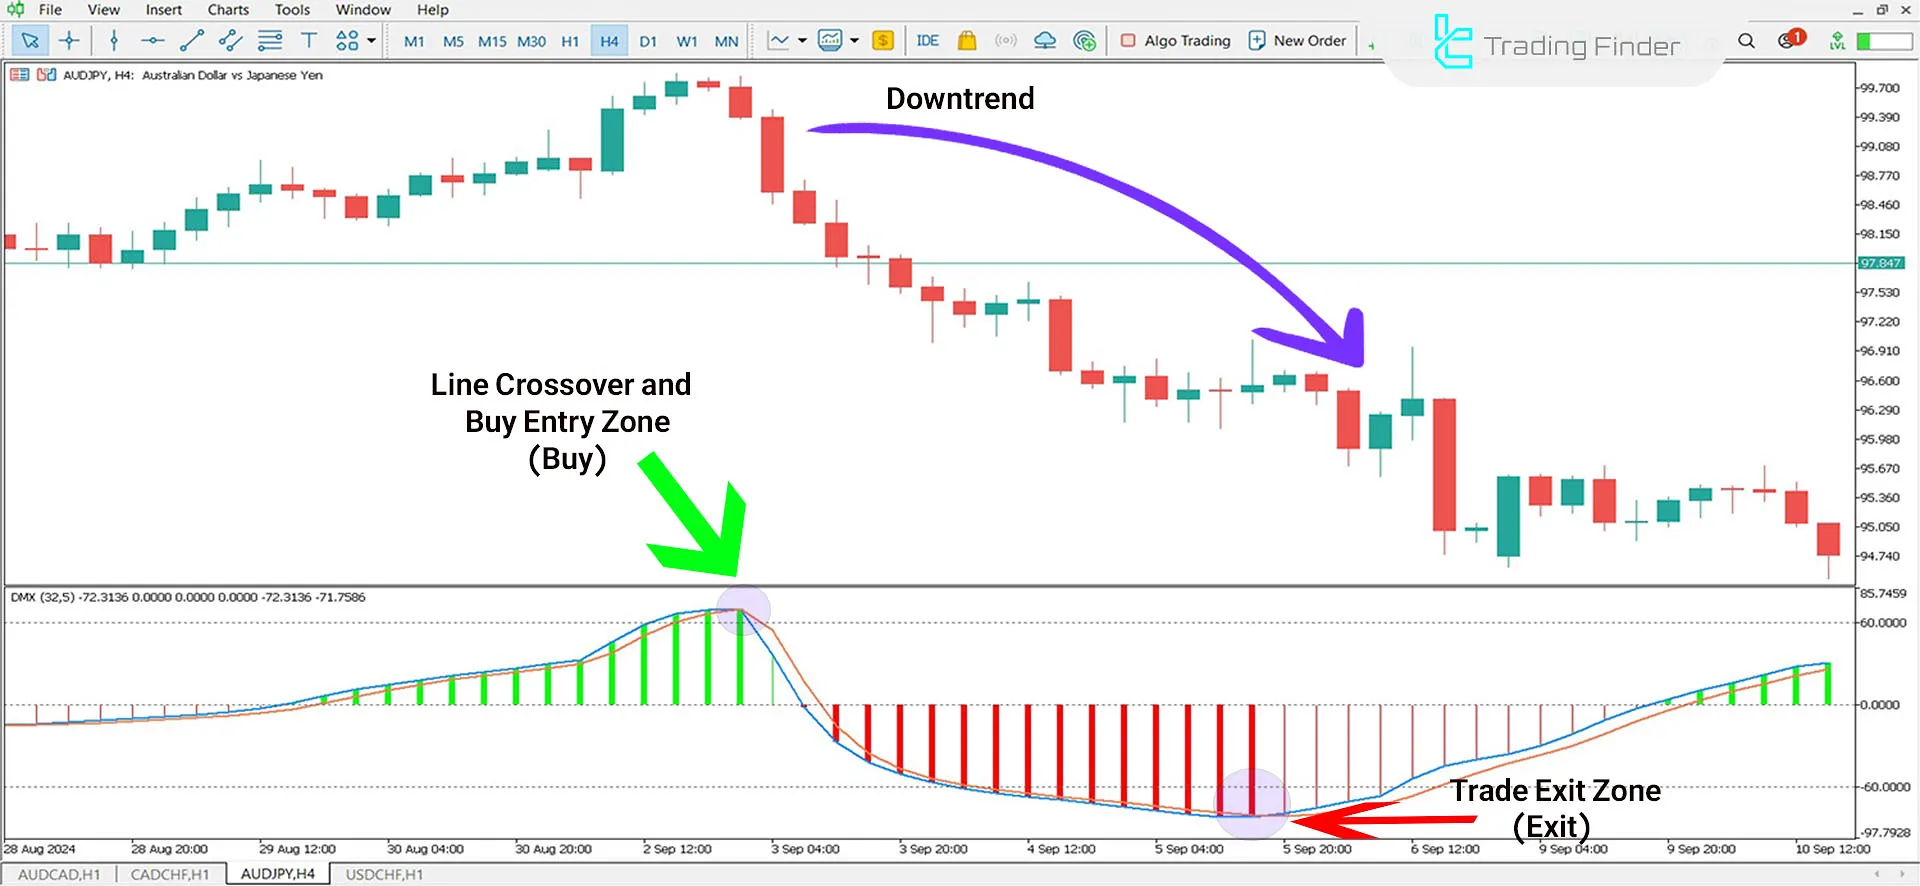
The image below depicts the AUD/JPY currency pair in the 4-hour timeframe.
In the histogram oscillator, when theblue line crosses below the orange line near the +60 level, this crossover is interpreted as a sell signal, prompting traders to take short positions after necessary confirmations.

Indicator Settings
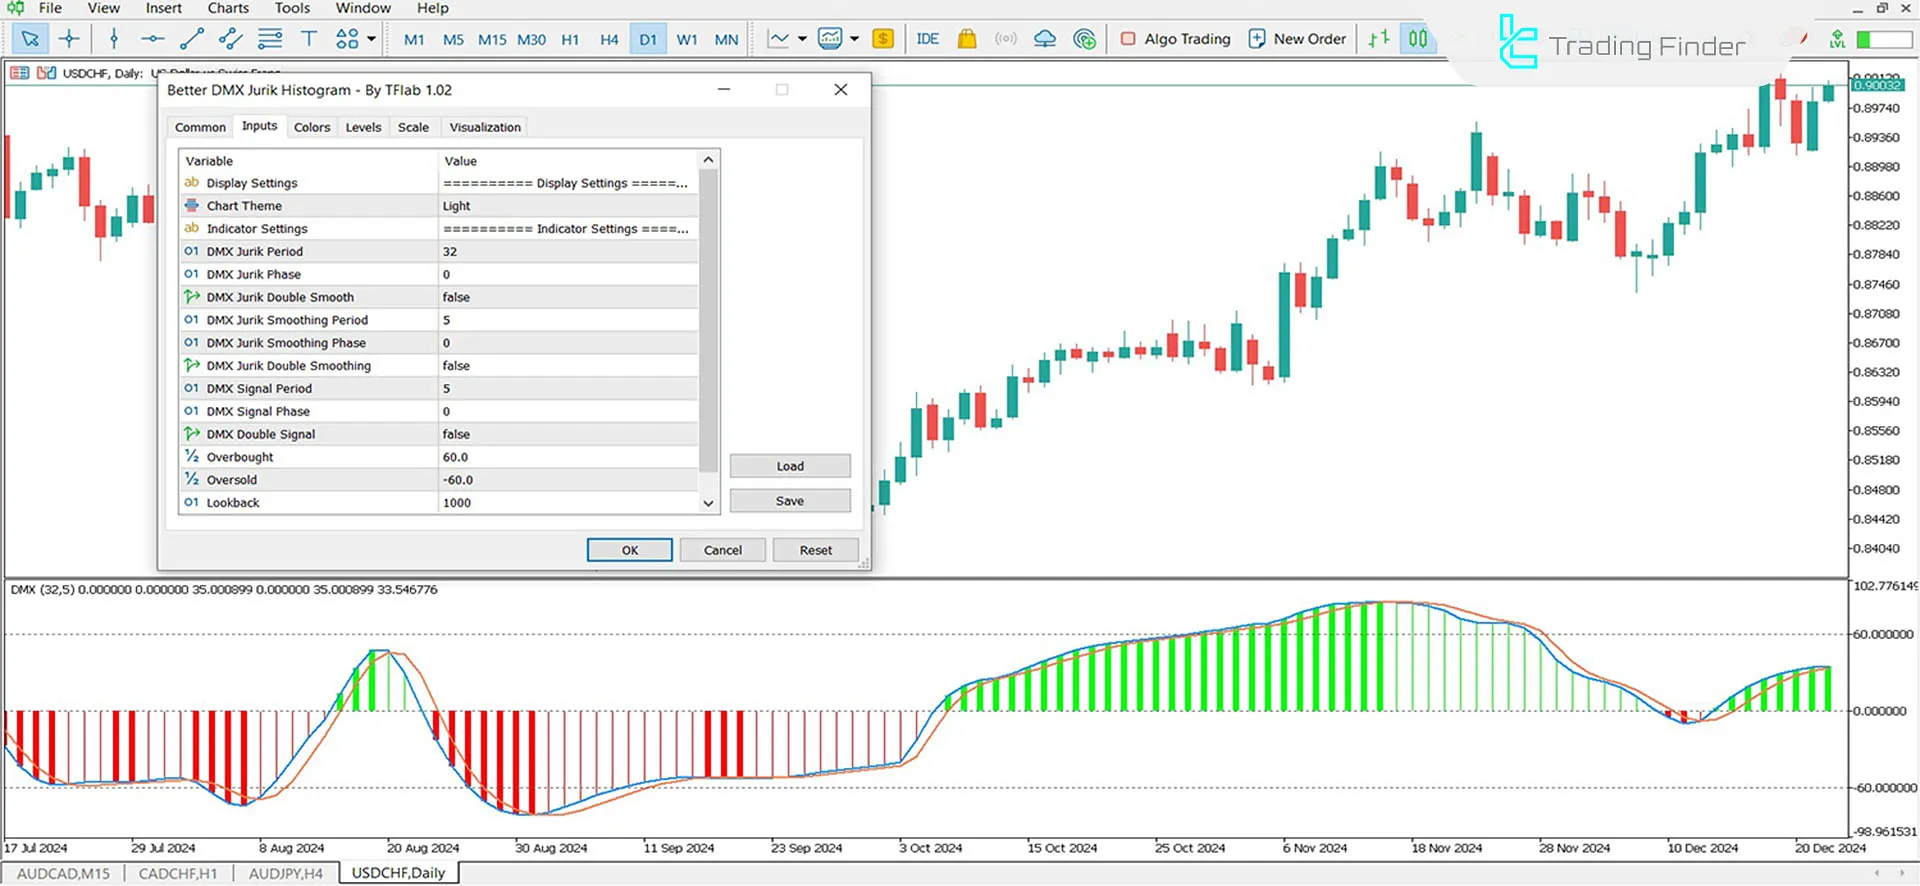
The settings of the indicator are fully illustrated in the image below, divided into the following sections: Display Settings and Indicator Settings.

- Chart Theme: Background theme of the indicator
- DMX Period: Period for indicator calculations
- DMX Phase: Precision adjustment parameter
- DMX Double: Recalculate DMX values
- Smooth Period: Number of periods for smoothing calculations
- Smooth Phase: Phase value for applying smoothing
- Smooth Double: Apply smoothing values in two steps
- Signal Period: Number of periods for signal line calculations
- Signal Phase: Phase value for signal line adjustments
- Signal Double: Two-step signal line calculation
- Overbought: Overbought levels
- Oversold: Oversold levels
- Lookback: Number of candles used in the indicator’s calculations
Conclusion
The Better DMX Jurik Histogram Indicator clearly displays market trend changes through histogram color shifts between green and red.
A change fromgreen to red indicates a trend reversal from bullish to bearish, while a change from red to green signifies a reversal from bearish to bullish.
Using aspecialized filter, this tool minimizes market noise and provides signals with minimal lag.
Better DMX Jurik Histogram MT5 PDF
Better DMX Jurik Histogram MT5 PDF
Click to download Better DMX Jurik Histogram MT5 PDFHow does the Better DMX Jurik Histogram display bullish and bearish flows on the chart?
The indicator plots green histograms for bullish flows and red histograms for bearish flows.
Is the Better DMX Jurik Histogram suitable for all markets?
Yes, this indicator can be used in various financial markets, including forex, stocks, cryptocurrencies, and commodities.


