![Bollinger Bands Bicolor Indicator MT5 Download - Free - [TradingFinder]](https://cdn.tradingfinder.com/image/202601/13-61-en-bollinger-band-bicolor-mt5-01.webp)
![Bollinger Bands Bicolor Indicator MT5 Download - Free - [TradingFinder] 0](https://cdn.tradingfinder.com/image/202601/13-61-en-bollinger-band-bicolor-mt5-01.webp)
![Bollinger Bands Bicolor Indicator MT5 Download - Free - [TradingFinder] 1](https://cdn.tradingfinder.com/image/198340/13-61-en-bollinger-band-bicolor-mt5-02.webp)
![Bollinger Bands Bicolor Indicator MT5 Download - Free - [TradingFinder] 2](https://cdn.tradingfinder.com/image/198342/13-61-en-bollinger-band-bicolor-mt5-03.webp)
![Bollinger Bands Bicolor Indicator MT5 Download - Free - [TradingFinder] 3](https://cdn.tradingfinder.com/image/198339/13-61-en-bollinger-band-bicolor-mt5-04.webp)
The Bollinger Bands Bicolor indicator is an enhanced version of the classic Bollinger Bands in the MT5 platform. This indicator is used to identify breakout points and trend direction and predict price reversal points.
This MT5 bands channels indicator structure includes a moving average line(MA) and two dynamic bands (above and below the candles) that change color in Bullish and Bearish trends.
Bollinger Bands Bicolor Indicator Specifications Table
The specifications of the Bollinger Bands Bicolor indicator are shown in the table below:
Indicator Categories: | Support & Resistance MT5 Indicators Bands & Channels MT5 Indicators Levels MT5 Indicators |
Platforms: | MetaTrader 5 Indicators |
Trading Skills: | Elementary |
Indicator Types: | Leading MT5 Indicators Breakout MT5 Indicators Reversal MT5 Indicators |
Timeframe: | Multi-Timeframe MT5 Indicators |
Trading Style: | Intraday MT5 Indicators Day Trading MT5 Indicators |
Trading Instruments: | Forex MT5 Indicators Crypto MT5 Indicators Indices MT5 Indicators |
Bollinger Bands Bicolor Indicator Overview
This indicator comprises amoving average line (MA) and two dynamic bands above and below the candles.
The bands are calculated using standard deviation to measure Forex market volatility. These levels automatically expand and contract with changing price volatility.
Bullish Trend Conditions
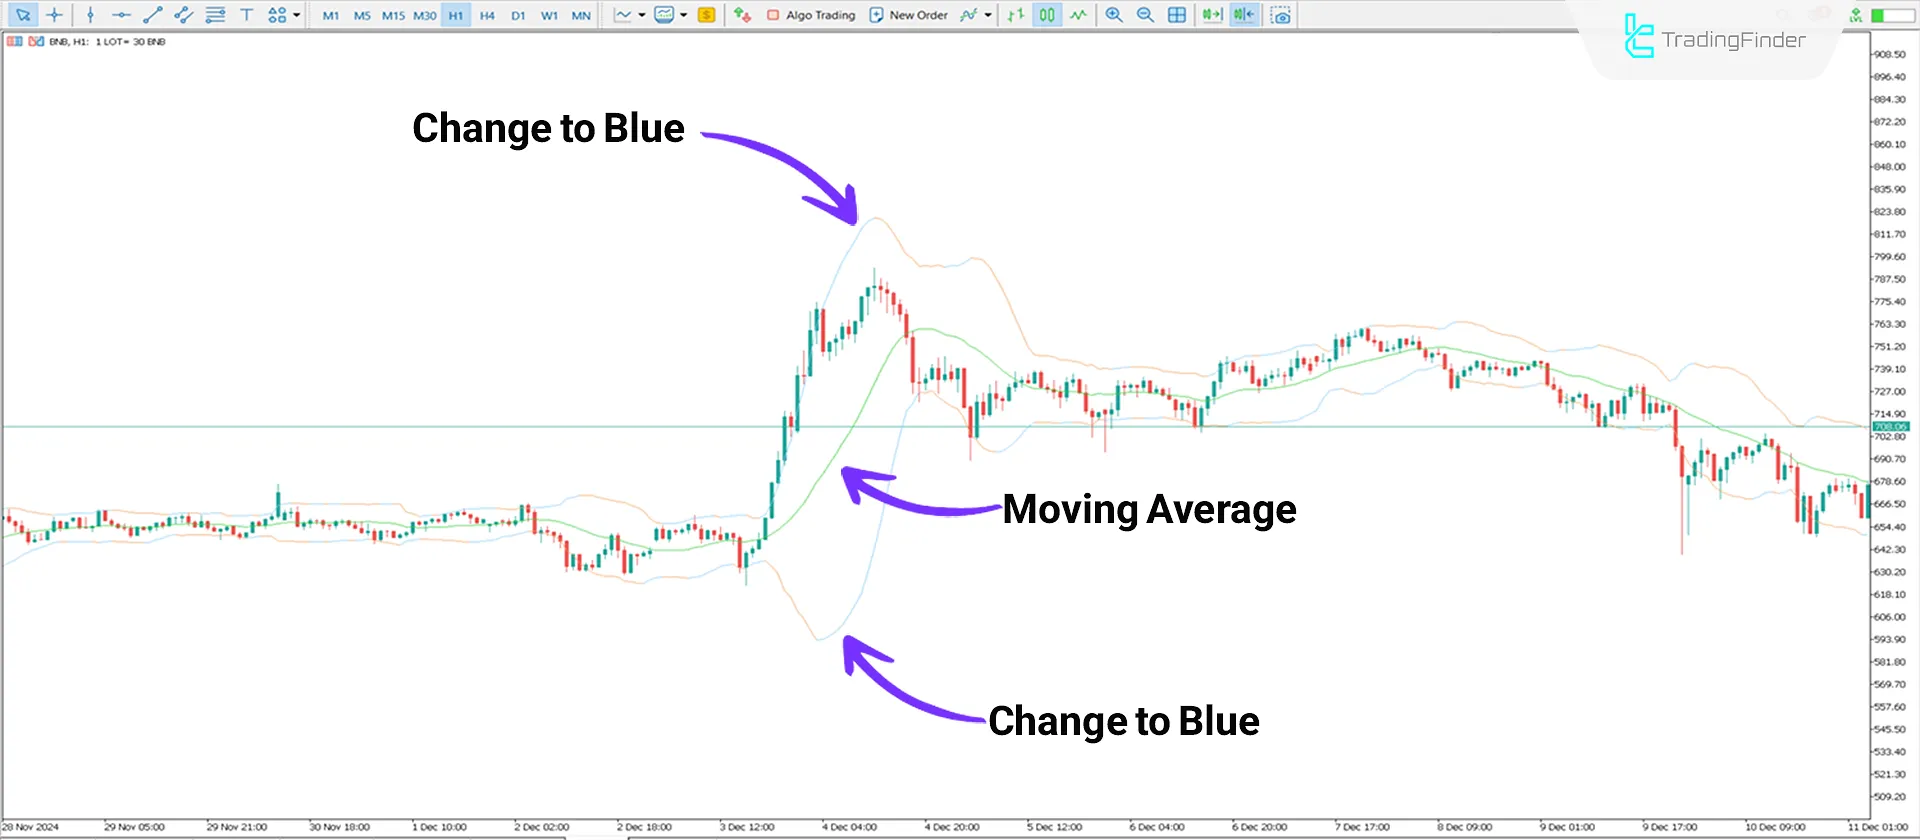
According to the example below, the upper and lower bands change to blue when the price breaks the moving average line upwards.
The color change to blue indicates the start of a bullish trend. The moving average line can be considered a support level in a bullish trend.

Bearish Trend Conditions
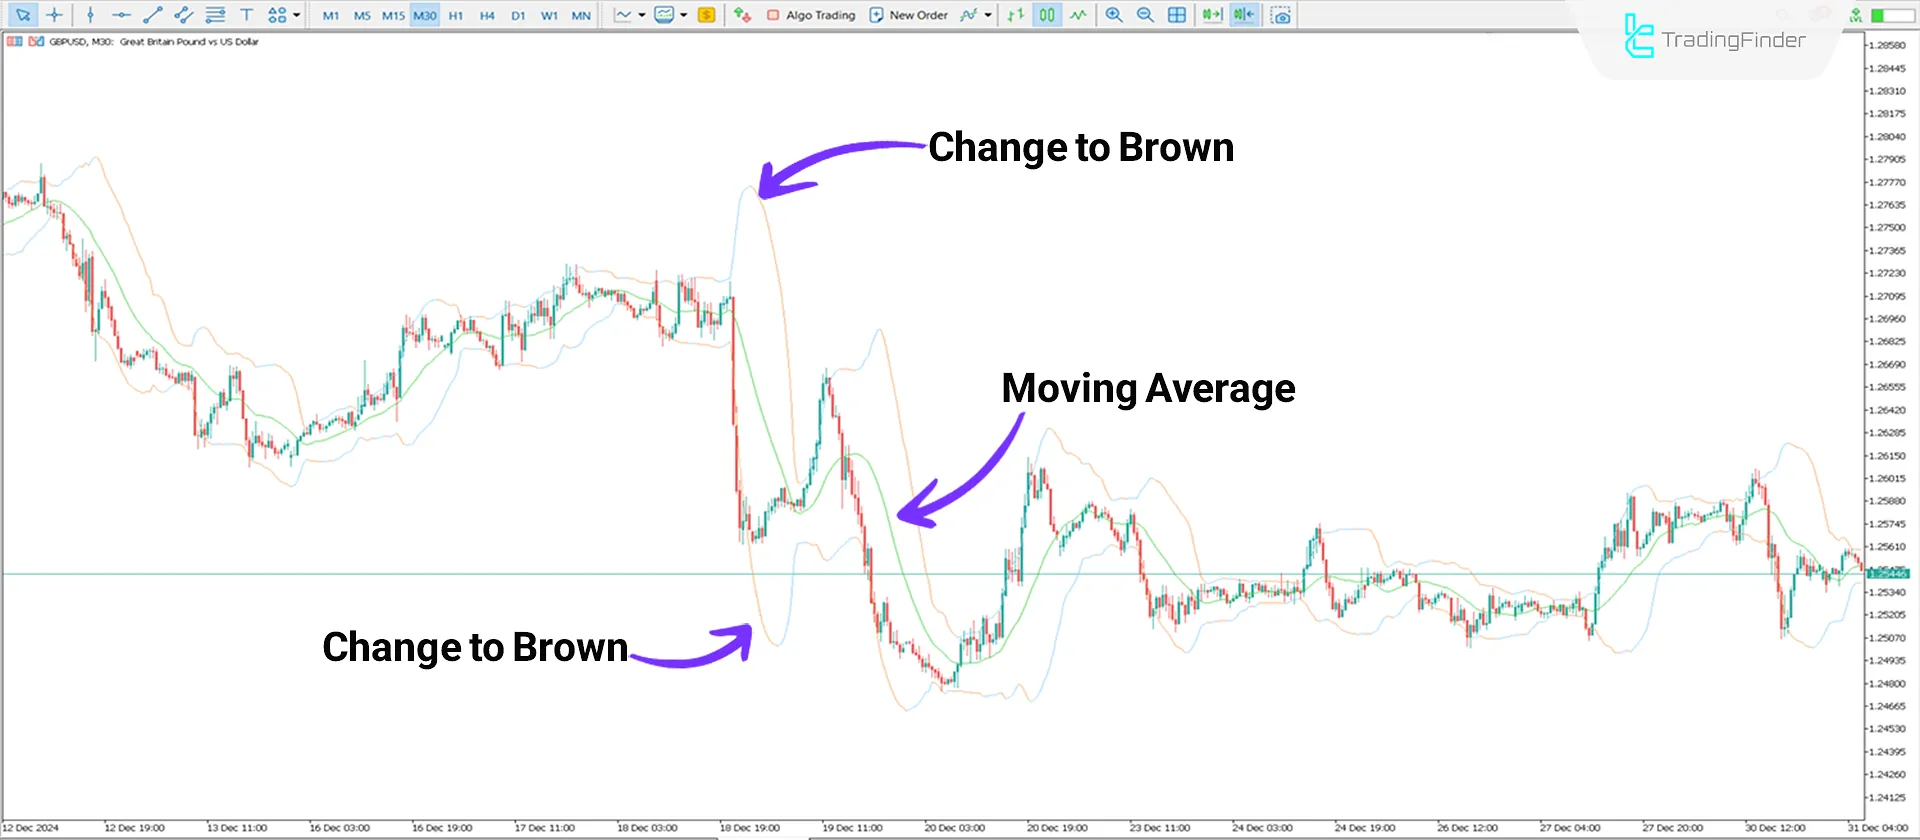
The 1-hour chart of Binance Coin (BNB) cryptocurrency shows the price response to the bands and moving averages in a bearish trend.
As shown below, the price keeps returning to the moving average after each breakout, providing an opportunity to enter sell trades.

Indicator Settings
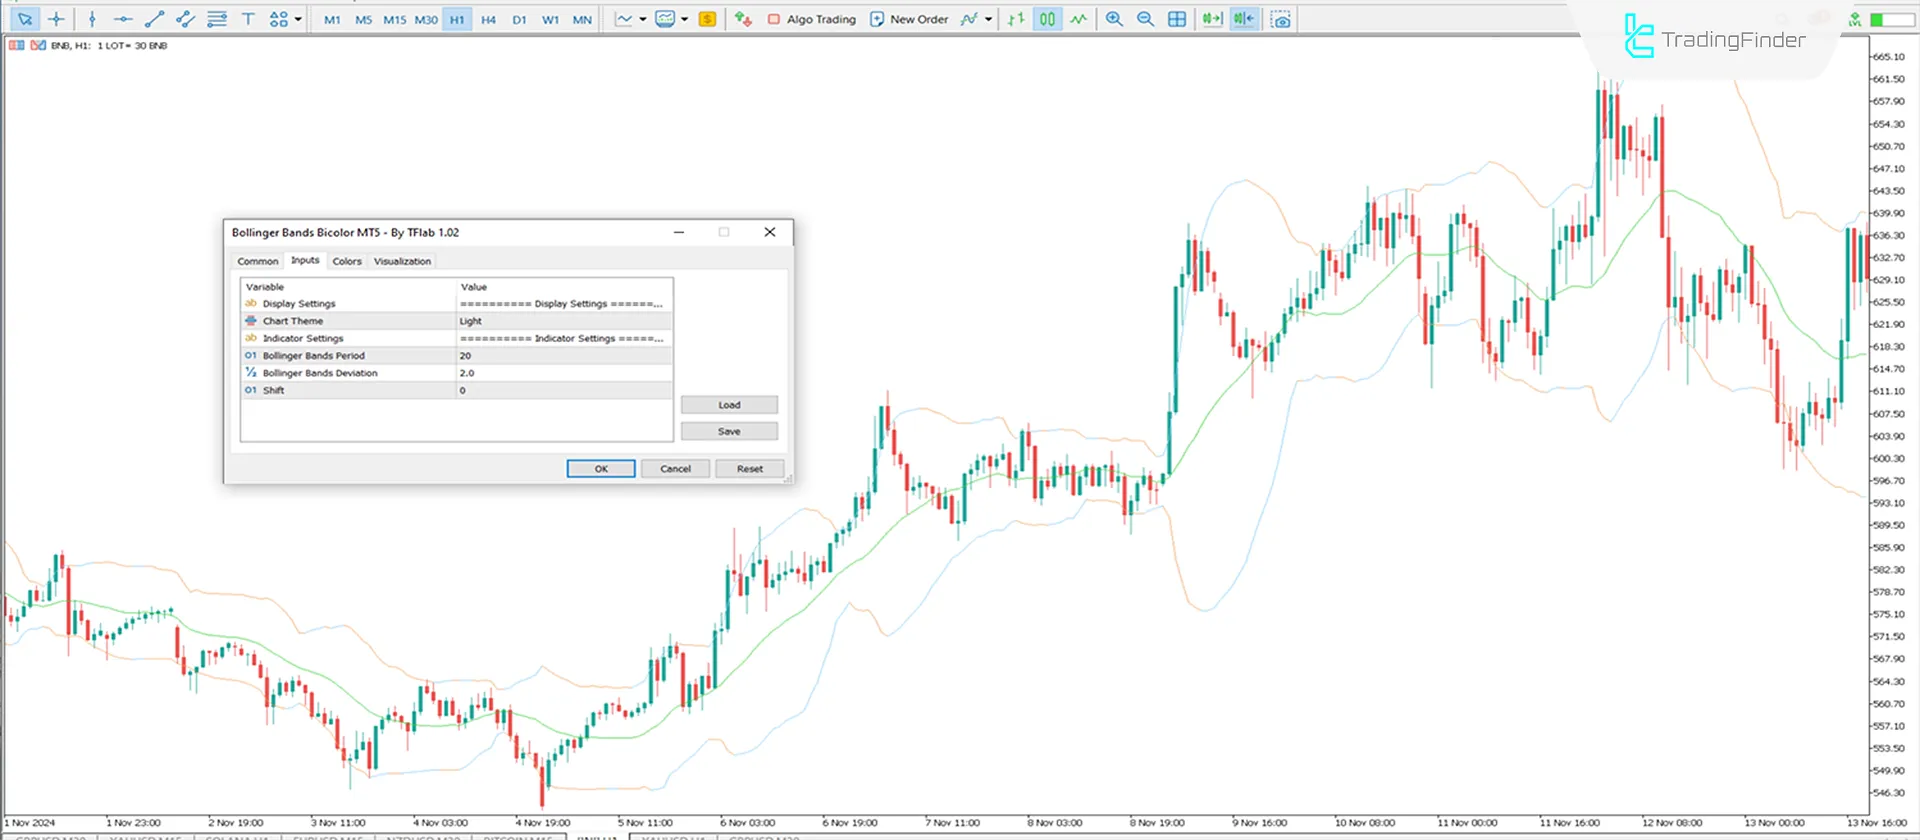
The settings for the Bollinger Bands Bicolor indicator are customizable, as shown below:

- Chart Theme: Chart theme selection;
- Period: Number of periods for calculating the oscillation line 20;
- Deviation: Standard deviation value 2.0;
- Shift: The number of units to shift the indicator forward or backward.
Conclusion
The Bollinger Bands Bicolor indicator detects potential breakouts and price changes by combining a moving average and two dynamic bands.
The main difference between it and the classic version of Bollinger Bands indicator is the color changing bands that indicate bullish and bearish trends.This tool, as an advanced trading indicator, is categorized under the support and resistance indicators of MT5, making it a valuable resource for traders.
Bollinger Bands Bicolor MT5 PDF
Bollinger Bands Bicolor MT5 PDF
Click to download Bollinger Bands Bicolor MT5 PDFWhat is the difference between indicator and the classic version?
The main difference is using two dynamic bands that change color in the Bollinger Bands Bicolor version.
Is this indicator suitable for beginner traders?
This indicator is suitable for beginner traders due to its simplicity and clear display of trend changes.


