![Bollinger Squeeze Basic Indicator for MT5 - Free Download [TradingFinder]](https://cdn.tradingfinder.com/image/456915/2-103-en-bollinger-squeeze-basic-mt5-1.webp)
![Bollinger Squeeze Basic Indicator for MT5 - Free Download [TradingFinder] 0](https://cdn.tradingfinder.com/image/456915/2-103-en-bollinger-squeeze-basic-mt5-1.webp)
![Bollinger Squeeze Basic Indicator for MT5 - Free Download [TradingFinder] 1](https://cdn.tradingfinder.com/image/456909/2-103-en-bollinger-squeeze-basic-mt5-2.webp)
![Bollinger Squeeze Basic Indicator for MT5 - Free Download [TradingFinder] 2](https://cdn.tradingfinder.com/image/456908/2-103-en-bollinger-squeeze-basic-mt5-3.webp)
![Bollinger Squeeze Basic Indicator for MT5 - Free Download [TradingFinder] 3](https://cdn.tradingfinder.com/image/456913/2-103-en-bollinger-squeeze-basic-mt5-4.webp)
The Bollinger Squeeze Basic indicator is built on the concept of market compression. When Bollinger Bands fall within the channels of the Keltner indicator, it may indicate a short-term decline in volatility and the likelihood of a strong price move.
This technical analysis tool visualizes squeeze conditions and volatility changes through colored bars and dots in the oscillator window.
Bollinger Squeeze Basic Indicator Table
The specifications of the Bollinger Squeeze Basic indicator for MetaTrader 5 are shown in the table below.
Indicator Categories: | Oscillators MT5 Indicators Trading Assist MT5 Indicators Momentum Indicators in MT5 |
Platforms: | MetaTrader 5 Indicators |
Trading Skills: | Elementary |
Indicator Types: | Breakout MT5 Indicators |
Timeframe: | Multi-Timeframe MT5 Indicators |
Trading Style: | Intraday MT5 Indicators |
Trading Instruments: | Forex MT5 Indicators Crypto MT5 Indicators Stock MT5 Indicators |
Overview of Bollinger Squeeze Basic
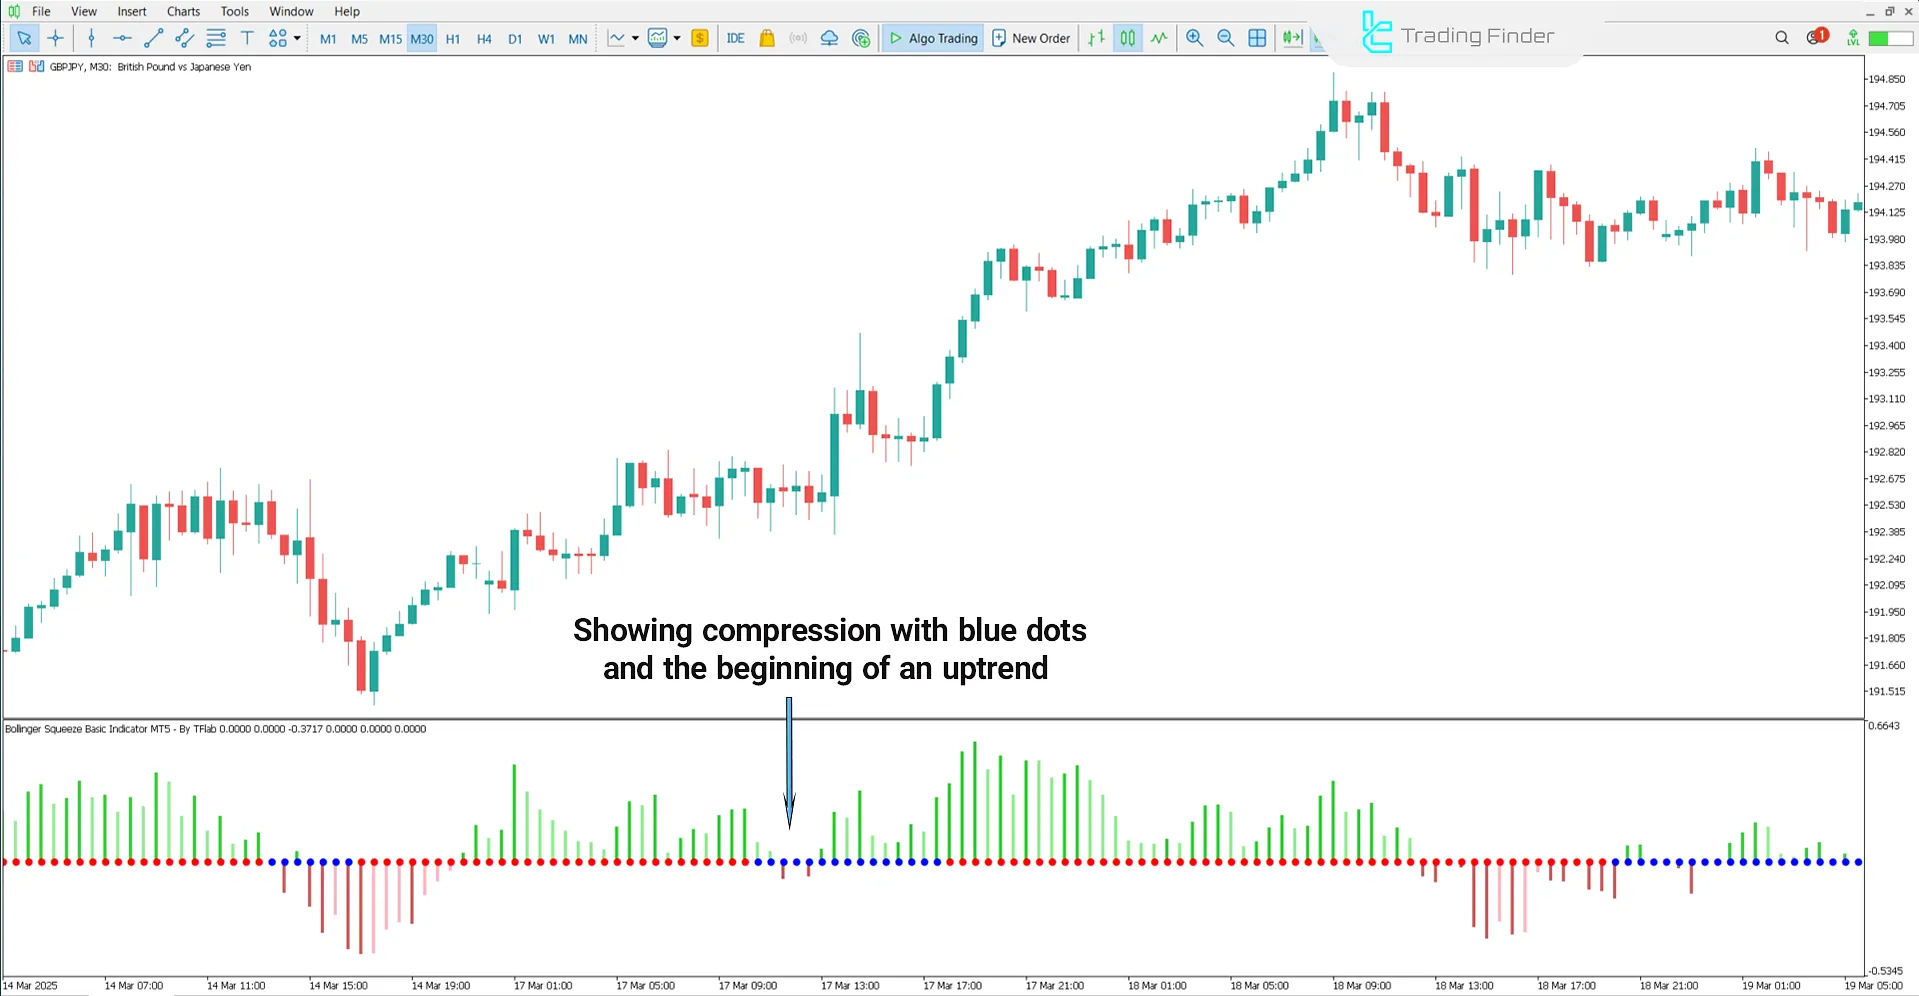
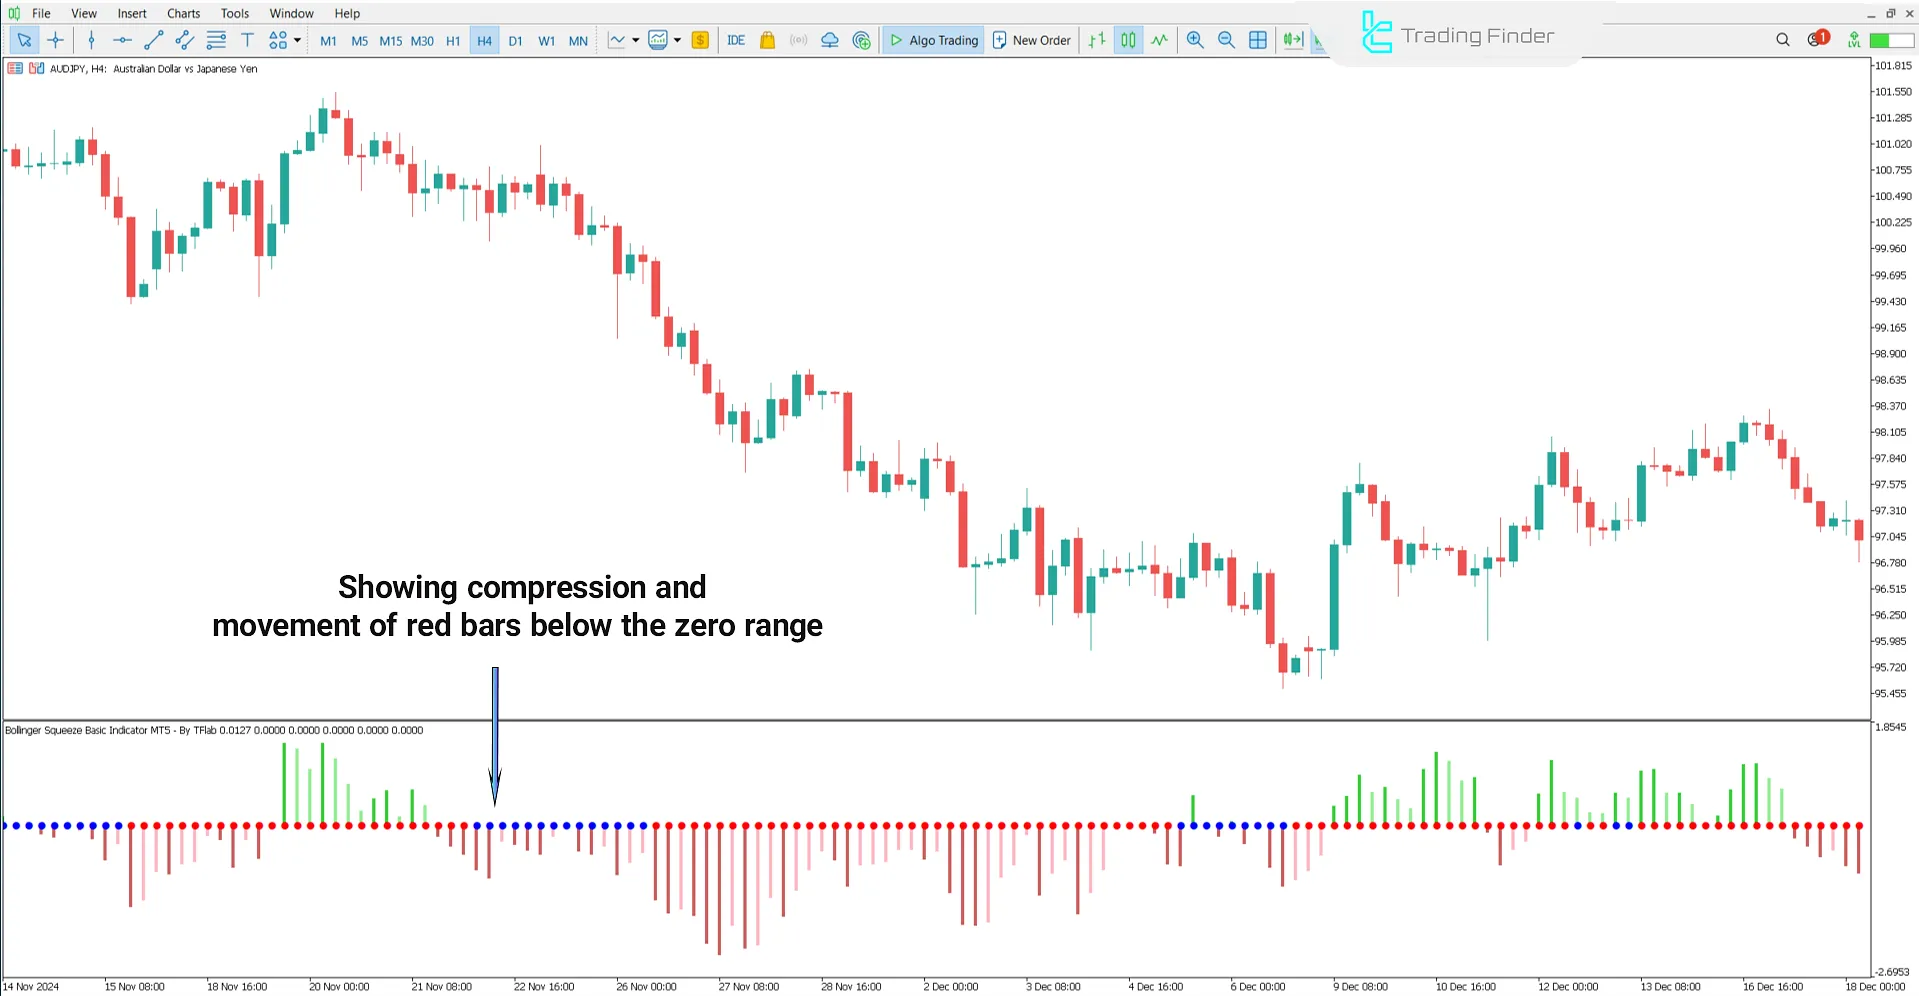
In the Bollinger Squeeze Basic indicator, after the squeeze phase ends and the Bollinger Bands break out again, buy/sell entry signals are generated based on the colors of dots and bars as follows:
- Blue Dots: Indicate the start of the squeeze phase and a higher probability of a new trend formation;
- Red Dots: Indicate the market is no longer compressed and lacks price pressure;
- Green Bars: Indicate strengthening of bullish momentum and increased buying pressure;
- Red Bars: Indicate an intensifying bearish trend and increased selling pressure.
Indicator in an Uptrend
The following chart shows the GBP/JPY currency pair on a 30-minute timeframe. In this oscillator, the appearance of blue dots signifies entry into the squeeze phase and reduced volatility.
Simultaneously, green momentum bars appear, and the momentum index enters the positive zone, creating a potential buy entry area.

Indicator in a Downtrend
The chart below displays the AUD/JPY currency pair on a 4-hour timeframe. In this Trading tool, the presence of blue dots indicates the onset of compression and reduced volatility.
At the same time, red momentum bars below the zero line reflect increased selling pressure and strengthening of the bearish trend.

Bollinger Squeeze Basic Indicator Settings
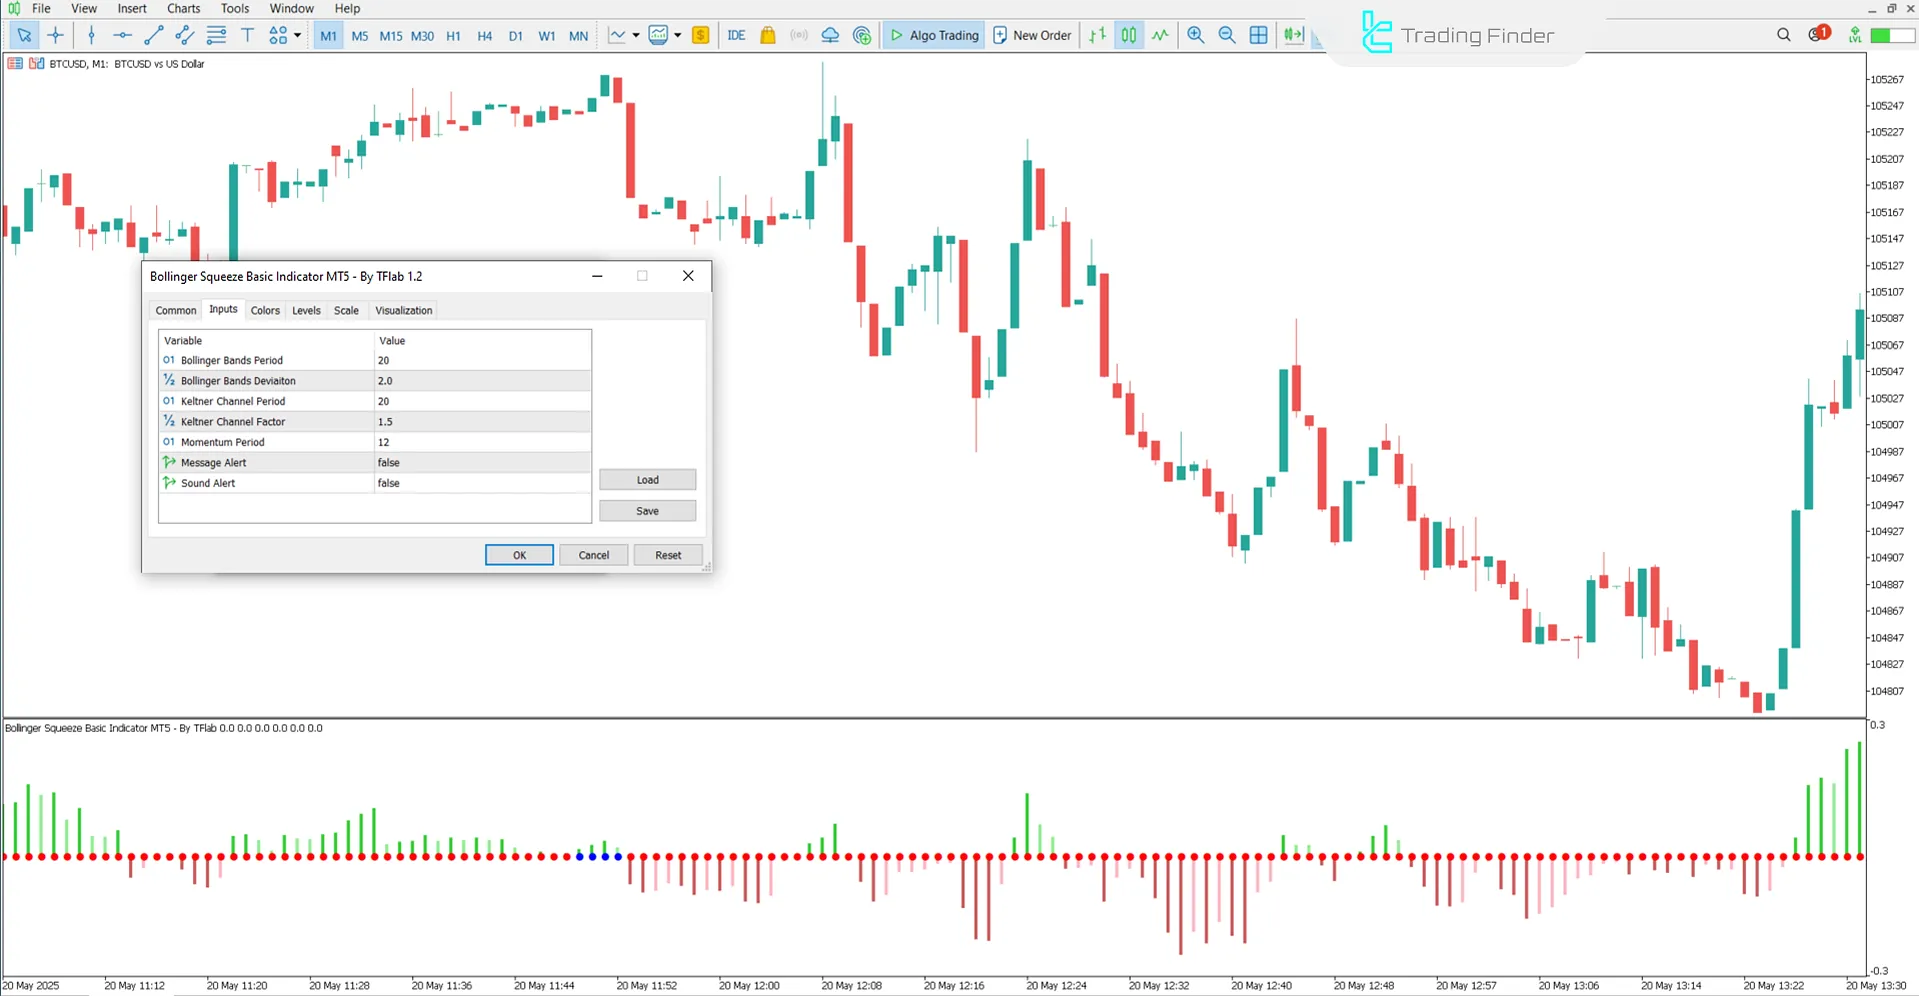
The image below shows the configuration panel of the Bollinger Squeeze Basic indicator:

- Bollinger Bands Period: Bollinger Bands period;
- Bollinger Bands Deviation: Bollinger Bands standard deviation;
- Keltner Channel Period: Keltner Channel period;
- Keltner Channel Factor: Keltner Channel multiplier;
- Momentum Period: Momentum calculation period;
- Message Alert: Text alert;
- Sound Alert: Sound notification.
Conclusion
The Bollinger Squeeze Basic indicator utilizes a combination of Bollinger Bands and the Momentum Index to identify price squeeze phases by analyzing the overlap between Bollinger Bands and the Keltner Channel.
Additionally, it analyzes direction and strength of momentum to display the likelihood of bullish or bearish movement.
Bollinger Squeeze Basic MT5 PDF
Bollinger Squeeze Basic MT5 PDF
Click to download Bollinger Squeeze Basic MT5 PDFWhat is the Bollinger Squeeze Basic indicator?
It is a combination of Bollinger Bands and Keltner Channel, used to detect price squeeze conditions and indicate the likely direction of the next market move using momentum analysis.
What do the blue dots indicate in the Bollinger Squeeze Basic indicator?
Blue dots show that the market has entered a squeeze phase, signaling the potential start of a new trend.


