![BPR + SFP Indicator ICT in MetaTrader 5 - Free - [TradingFinder]](https://cdn.tradingfinder.com/image/191275/1-5-en-bpr-sfp-mt5-1.webp)
![BPR + SFP Indicator ICT in MetaTrader 5 - Free - [TradingFinder] 0](https://cdn.tradingfinder.com/image/191275/1-5-en-bpr-sfp-mt5-1.webp)
![BPR + SFP Indicator ICT in MetaTrader 5 - Free - [TradingFinder] 1](https://cdn.tradingfinder.com/image/191277/1-5-en-bpr-sfp-mt5-2.webp)
![BPR + SFP Indicator ICT in MetaTrader 5 - Free - [TradingFinder] 2](https://cdn.tradingfinder.com/image/191276/1-5-en-bpr-sfp-mt5-3.webp)
![BPR + SFP Indicator ICT in MetaTrader 5 - Free - [TradingFinder] 3](https://cdn.tradingfinder.com/image/191274/1-5-en-bpr-sfp-mt5-4.webp)
The BPR + SFP Oscillation Breakout Indicator combines the BPR and SFP patterns in technical analysis to identify market trends and pinpoint suitable entry points.
This combination is based on market behavior and traders’ reactions to key price levels such as MT5 Support and resistance indicator, liquidity accumulation zones, breakout and pullback levels, and market highs and lows.
This tool analyzes oscillation breakouts, validates breakouts and pullbacks to specified levels (displayed with green and red arrows), and provides entry signals and trend changes for traders.
BPR + SFP Specification Table
Details of the BPR + SFP Indicator are displayed in the table below:
Indicator Categories: | Smart Money MT5 Indicators Liquidity Indicators MT5 Indicators ICT MT5 Indicators |
Platforms: | MetaTrader 5 Indicators |
Trading Skills: | Advanced |
Indicator Types: | Reversal MT5 Indicators |
Timeframe: | Multi-Timeframe MT5 Indicators |
Trading Style: | Intraday MT5 Indicators |
Trading Instruments: | Forex MT5 Indicators Crypto MT5 Indicators Stock MT5 Indicators Indices MT5 Indicators Forward MT5 Indicators Share Stock MT5 Indicators |
Indicator Overview
The combination of oscillation breakout and BPR patterns in the ICT style enables traders to identify range zones.
These zones are often recognized as key market levels, used for making critical trading decisions.This tool assists traders in entering volatile markets and locating suitable entryand exit points.
Uptrend Conditions
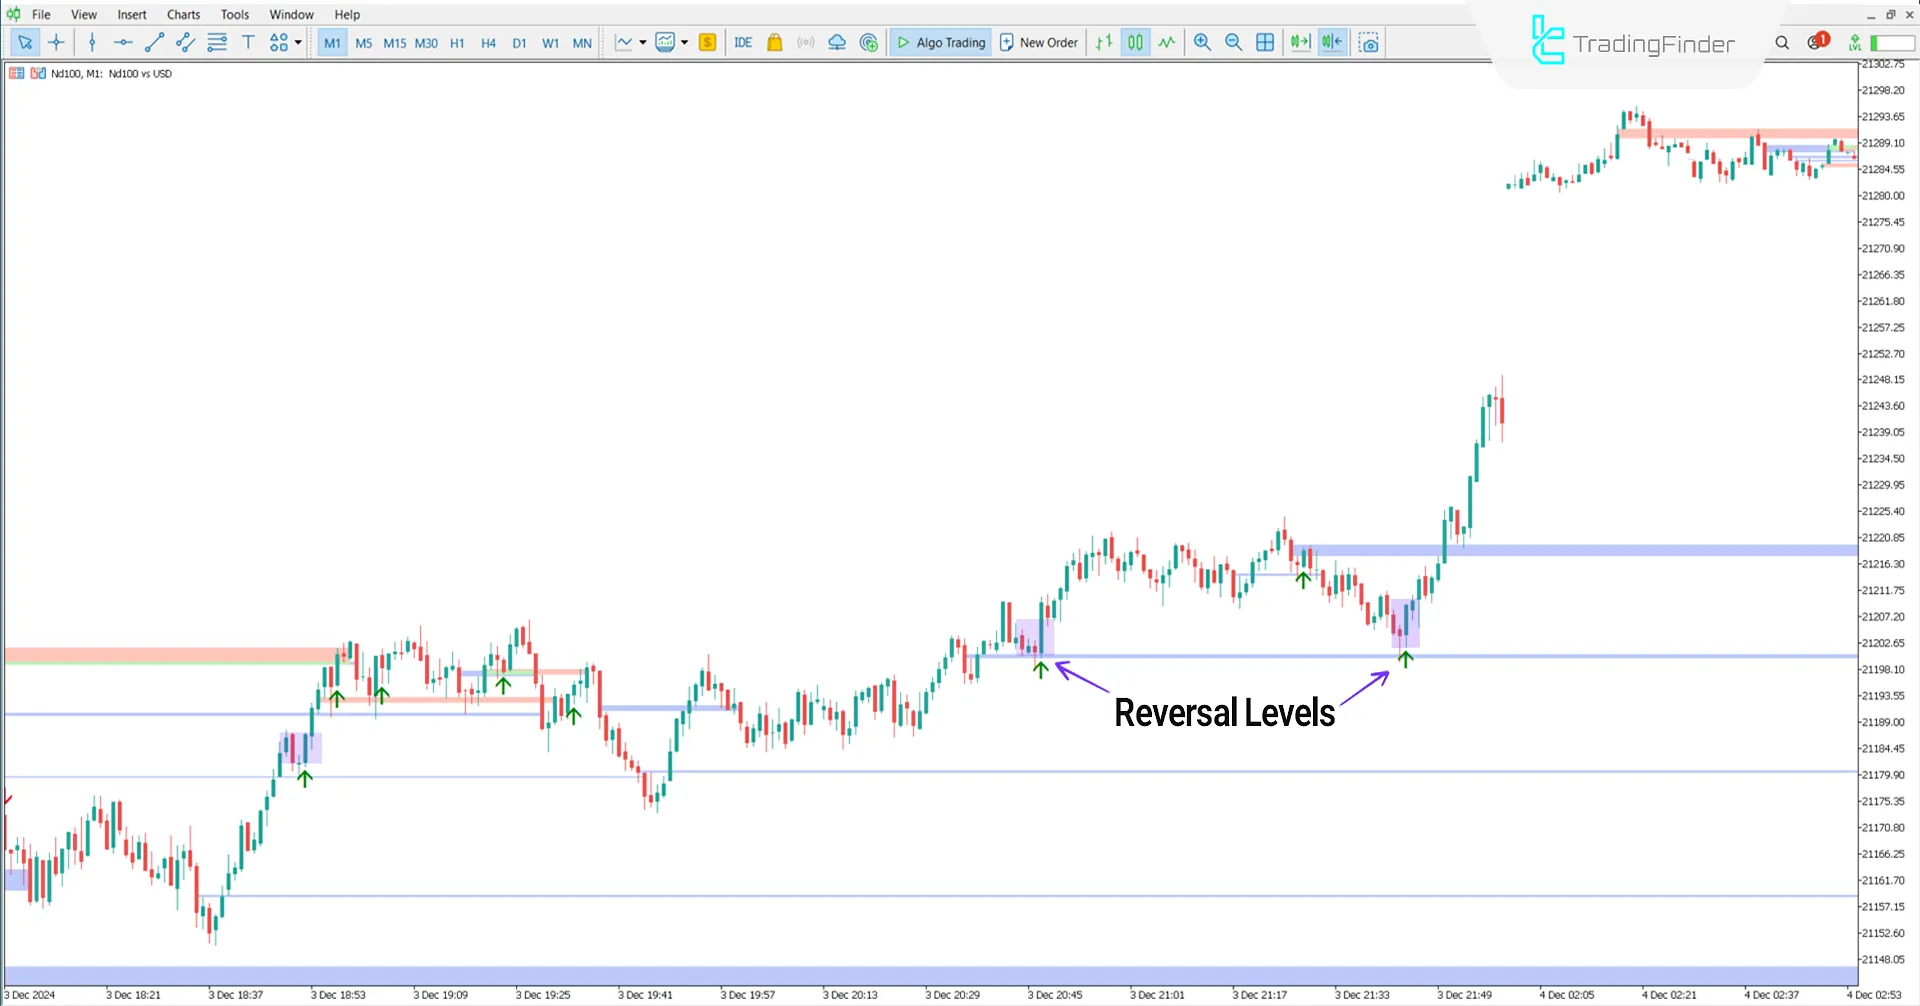
The price chart below displays the Nasdaq 100 Index in a 1-minute timeframe; gray lines represent key price levels.
When the price reaches these levels, a trend change and reversal to a bullish trend are indicated by a green arrow for traders.

Downtrend Conditions
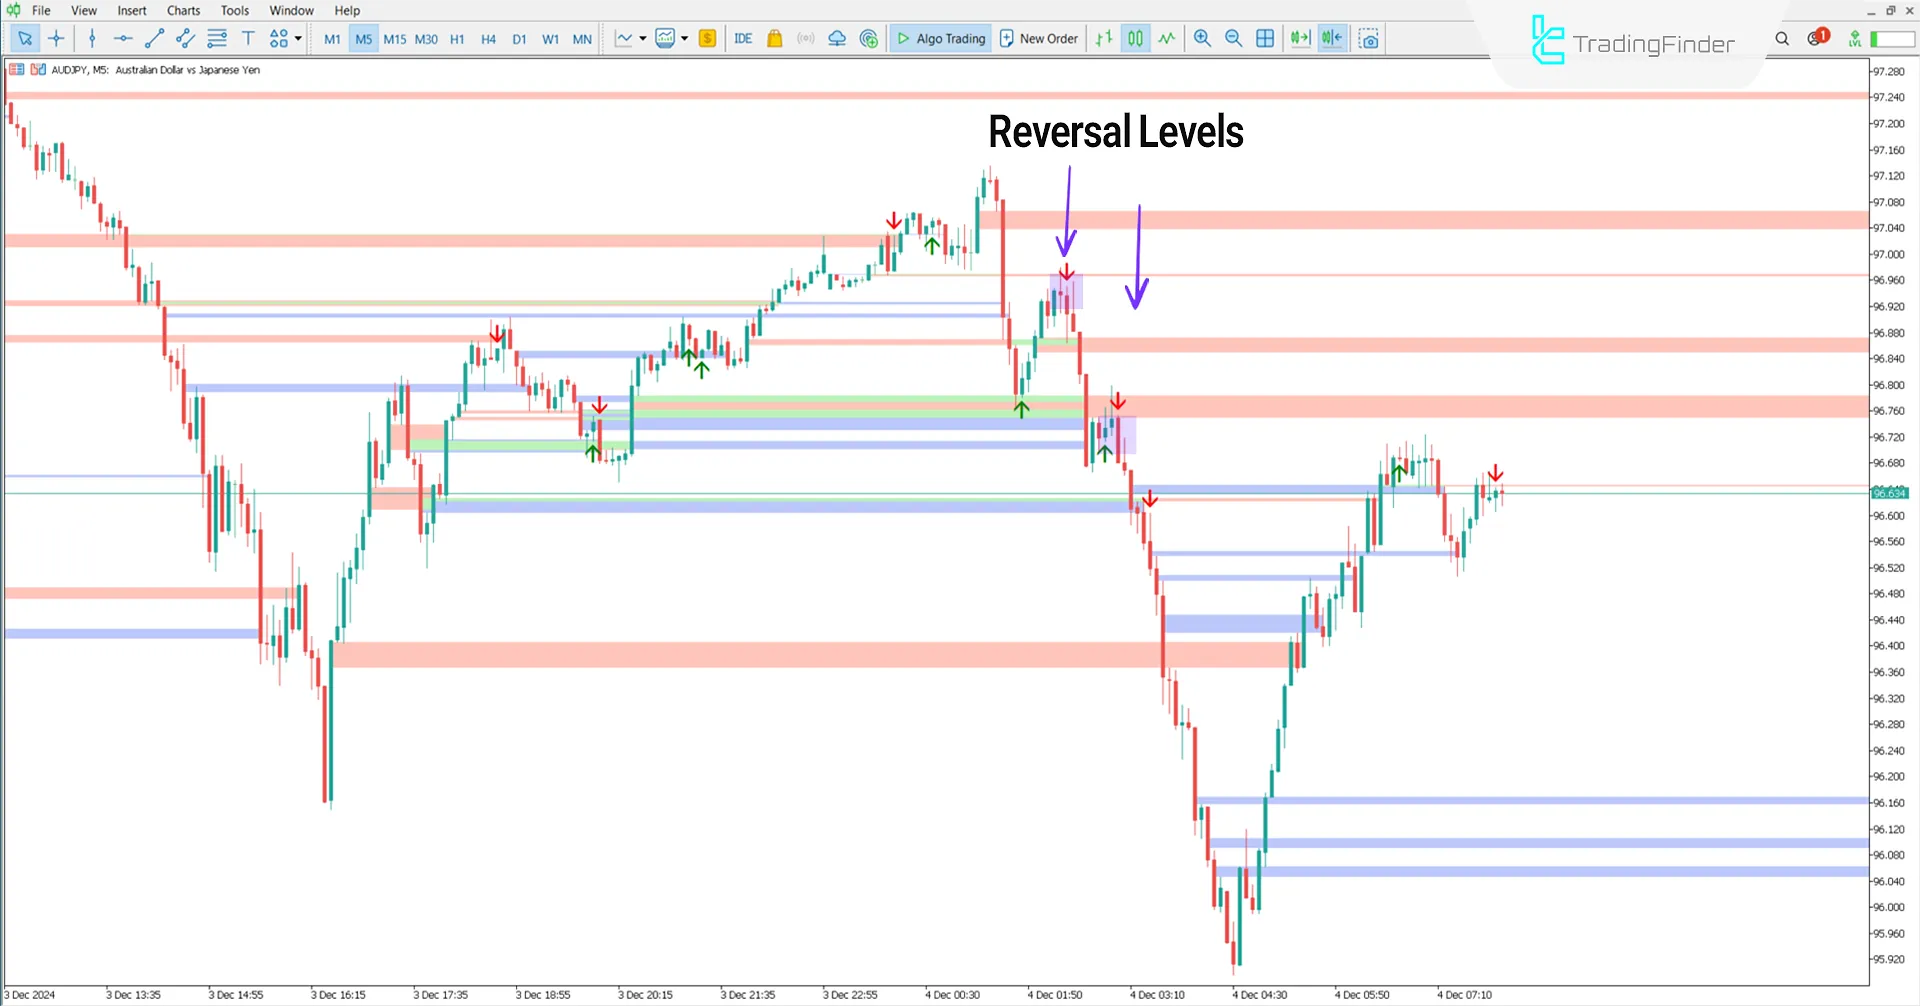
The image below shows the price chart of Australian Dollar against Japanese Yen (AUD/JPY) in a 5-minute timeframe.
Gray lines represent key price levels; when the price reaches these levels, trend change, breakout, and reversal to a bearish trend are indicated by a red arrow for traders.

Indicator Settings
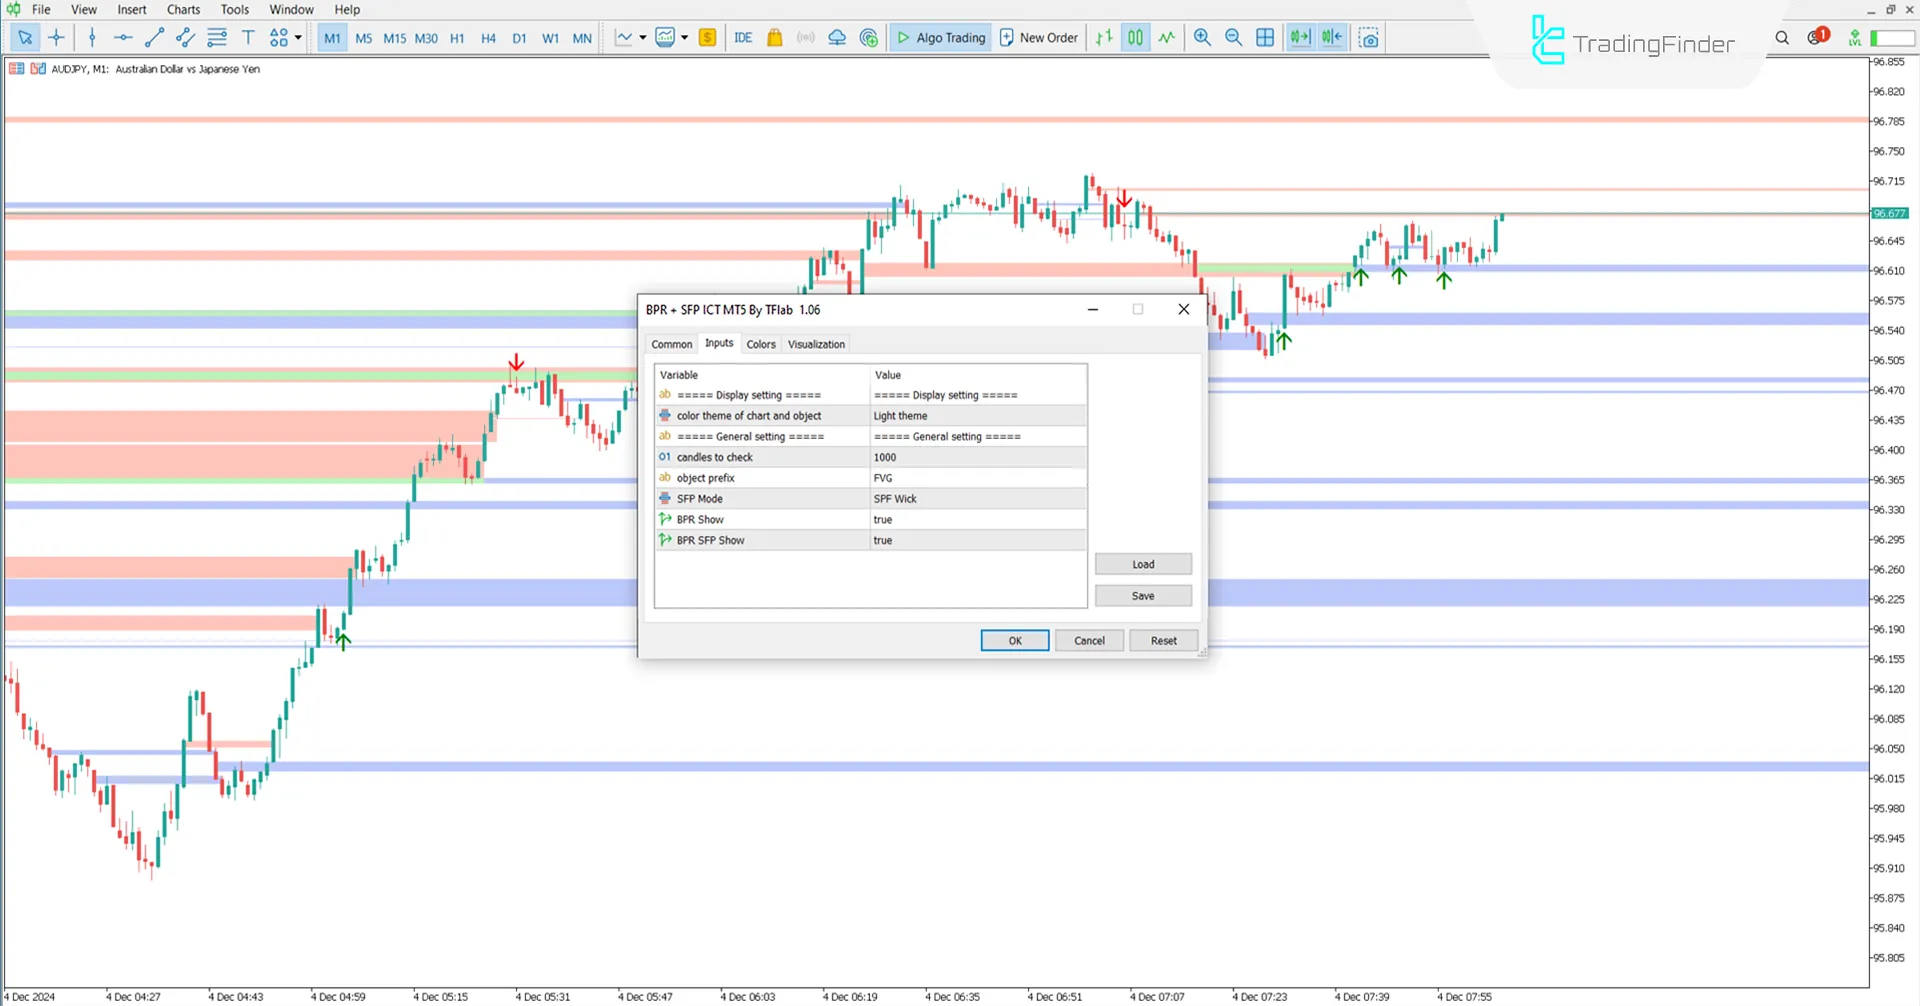
Table below includes information related to the settings of the BPR + SFP Indicator:

- Color theme of chart and object: Chart color theme;
- Candles to check: Candle analysis;
- Object prefix: Classification code;
- SFP mode: SFP mode;
- BPR show: Display BPR;
- BPR SFT show: Display BPR SFT.
Conclusion
The combined BPR and SFP Indicator, incorporating a MT5 Liquidity indicator, is a powerful tool for analyzing key price levels andliquidity, identifying reversal points, oscillation breakouts, and suitable entry and exit points.
BPR SFP ICT Meta MT5 PDF
BPR SFP ICT Meta MT5 PDF
Click to download BPR SFP ICT Meta MT5 PDFHow does the indicator display breakout and reversal levels?
This tool identifies breakout or trend reversal levels using green and red arrows.
Which timeframe is the BPR + Oscillation Breakout Indicator applicable to?
This indicator supports multi-timeframe analysis, allowing traders to use it across different timeframes, including 4-hour and daily charts.


