


![Buy Sell Pressure Indicator MT5 Download – Free – [TradingFinder]](https://cdn.tradingfinder.com/image/572435/13-226-en-bsp-mt5-01.webp)
![Buy Sell Pressure Indicator MT5 Download – Free – [TradingFinder] 1](https://cdn.tradingfinder.com/image/572430/13-226-en-bsp-mt5-02.webp)
![Buy Sell Pressure Indicator MT5 Download – Free – [TradingFinder] 2](https://cdn.tradingfinder.com/image/572439/13-226-en-bsp-mt5-03.webp)
![Buy Sell Pressure Indicator MT5 Download – Free – [TradingFinder] 3](https://cdn.tradingfinder.com/image/572434/13-226-en-bsp-mt5-04.webp)
The BSP Oscillator is a practical tool in technical analysis used to measure buying and selling pressure in the market.
This indicator relies on trading volume data and compares buy and sell volumes relative to the total volume, displaying the result as a histogram.
In this structure, positive bars indicate increasing buying power and upward price movement, while negative bars signify the dominance of sellers and the formation of a downward trend.
BSP Oscillator Specification Table
The specifications of Buy Sell Pressure Indicator are as follows:
Indicator Categories: | Volume MT5 Indicators Oscillators MT5 Indicators Currency Strength MT5 Indicators |
Platforms: | MetaTrader 5 Indicators |
Trading Skills: | Elementary |
Indicator Types: | Reversal MT5 Indicators |
Timeframe: | Multi-Timeframe MT5 Indicators |
Trading Style: | Swing Trading MT5 Indicators Scalper MT5 Indicators Day Trading MT5 Indicators |
Trading Instruments: | Forex MT5 Indicators Crypto MT5 Indicators Stock MT5 Indicators Commodity MT5 Indicators Indices MT5 Indicators Share Stock MT5 Indicators |
Buy Sell Pressure Indicator at a Glance
In the BSP Oscillator, histogram colors indicate the strength of bullish or bearish trends. The color changes of the bars indicate trend strength as follows:
- Dark Blue Histogram: Indicates a strong bullish trend
- Light Blue Histogram: Indicates a weak bullish trend
- Dark Red Histogram: Indicates a strong bearish trend
- Light Red Histogram: Indicates a weak bearish trend
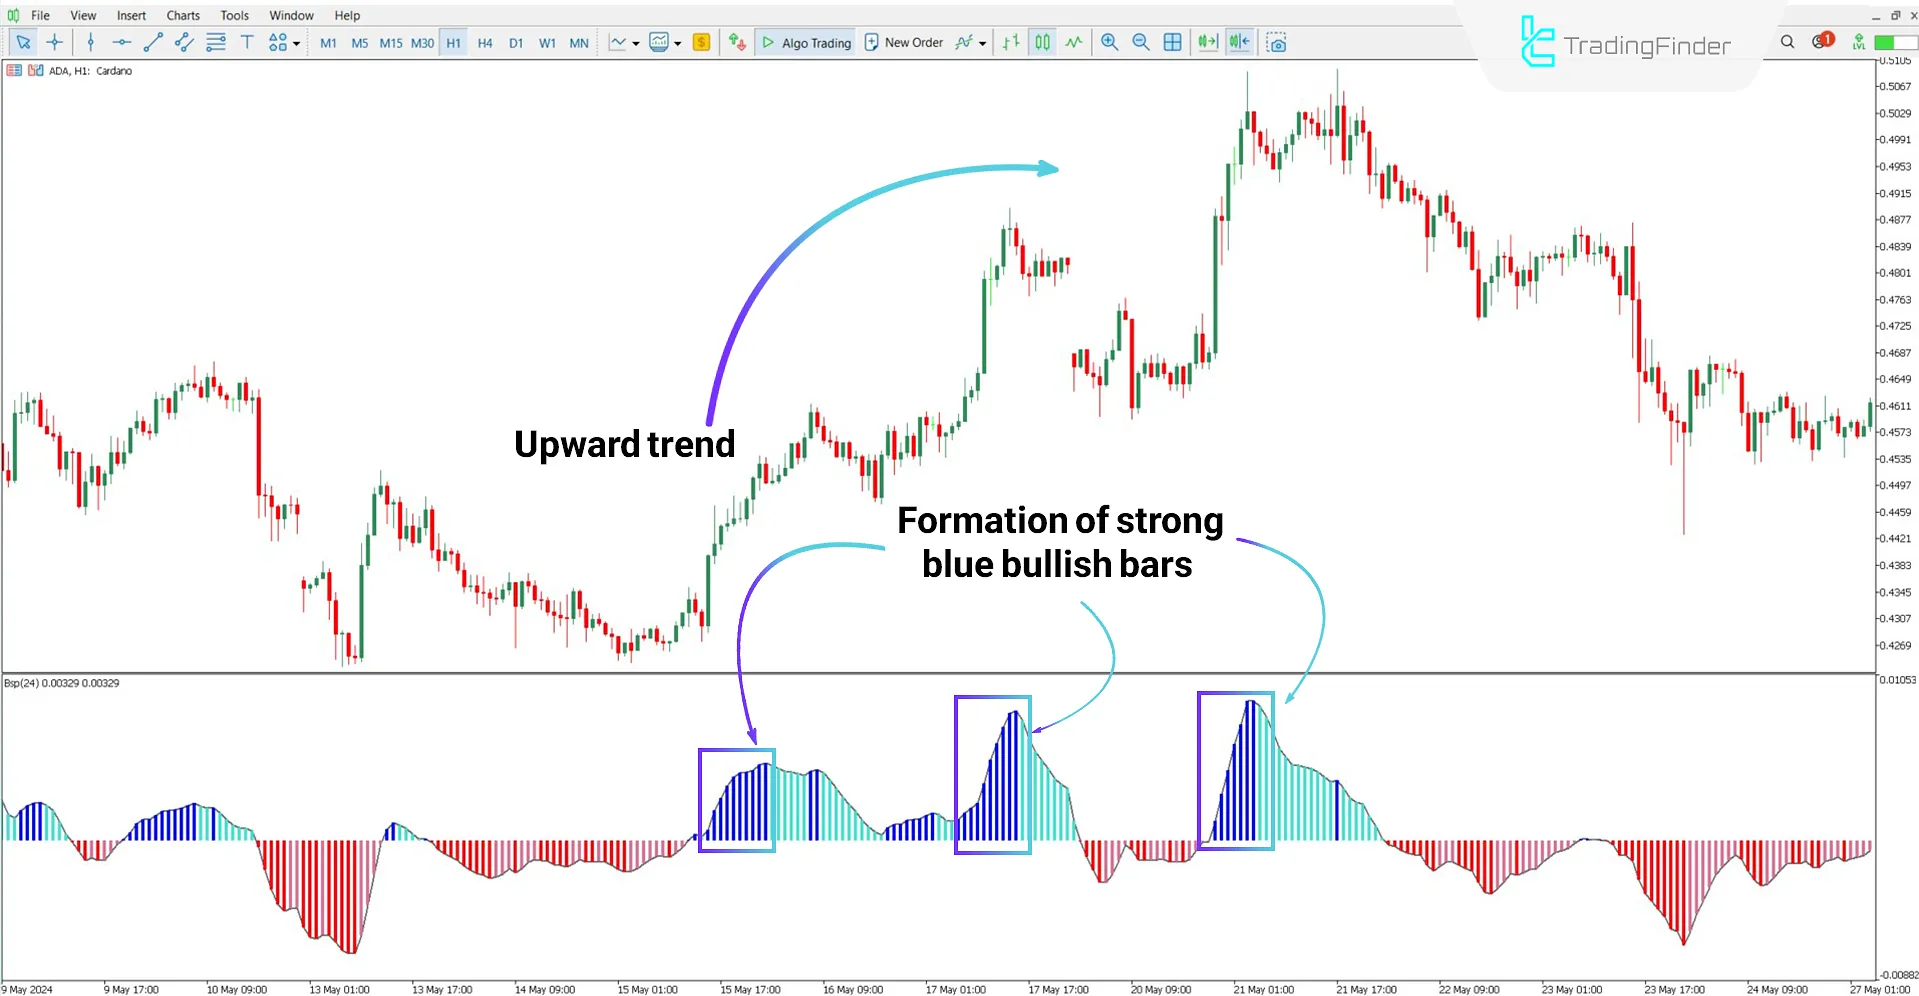
Bullish Trend Conditions
According to the Cardano (ADA) cryptocurrency chart in the 1-hour timeframe, the formation of positive bars in the BSP Oscillator signals the start of upward market movement.
At the same time, darker blue bars indicate increasing buying power and a stronger bullish trend.
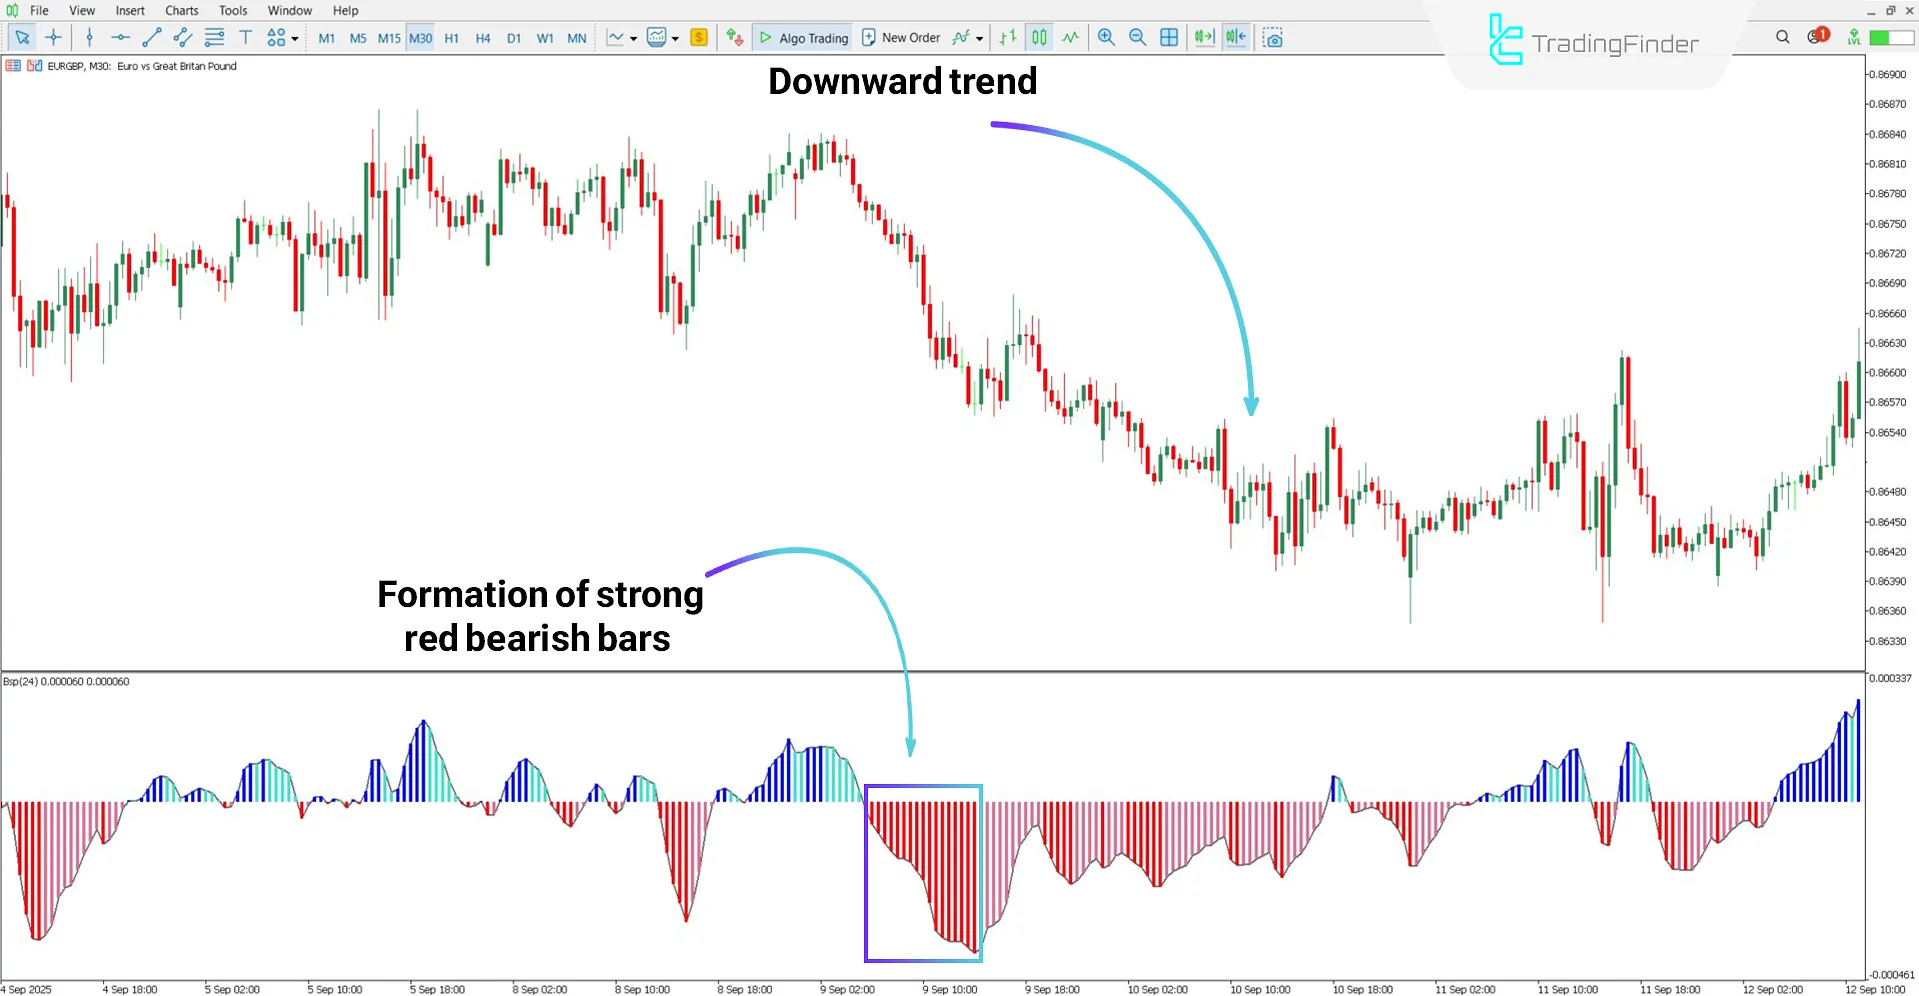
Bearish Trend Conditions
Based on the EUR/GBP chart in the 30-minute timeframe, the formation of dark red negative bars in the BSP Oscillator signals the start of a strong bearish trend.
In this situation, traders may consider entering sell positions if the negative bars continue to form.
Buy Sell Pressure Indicator Settings
The configurable settings in the BSP Oscillator are as follows:
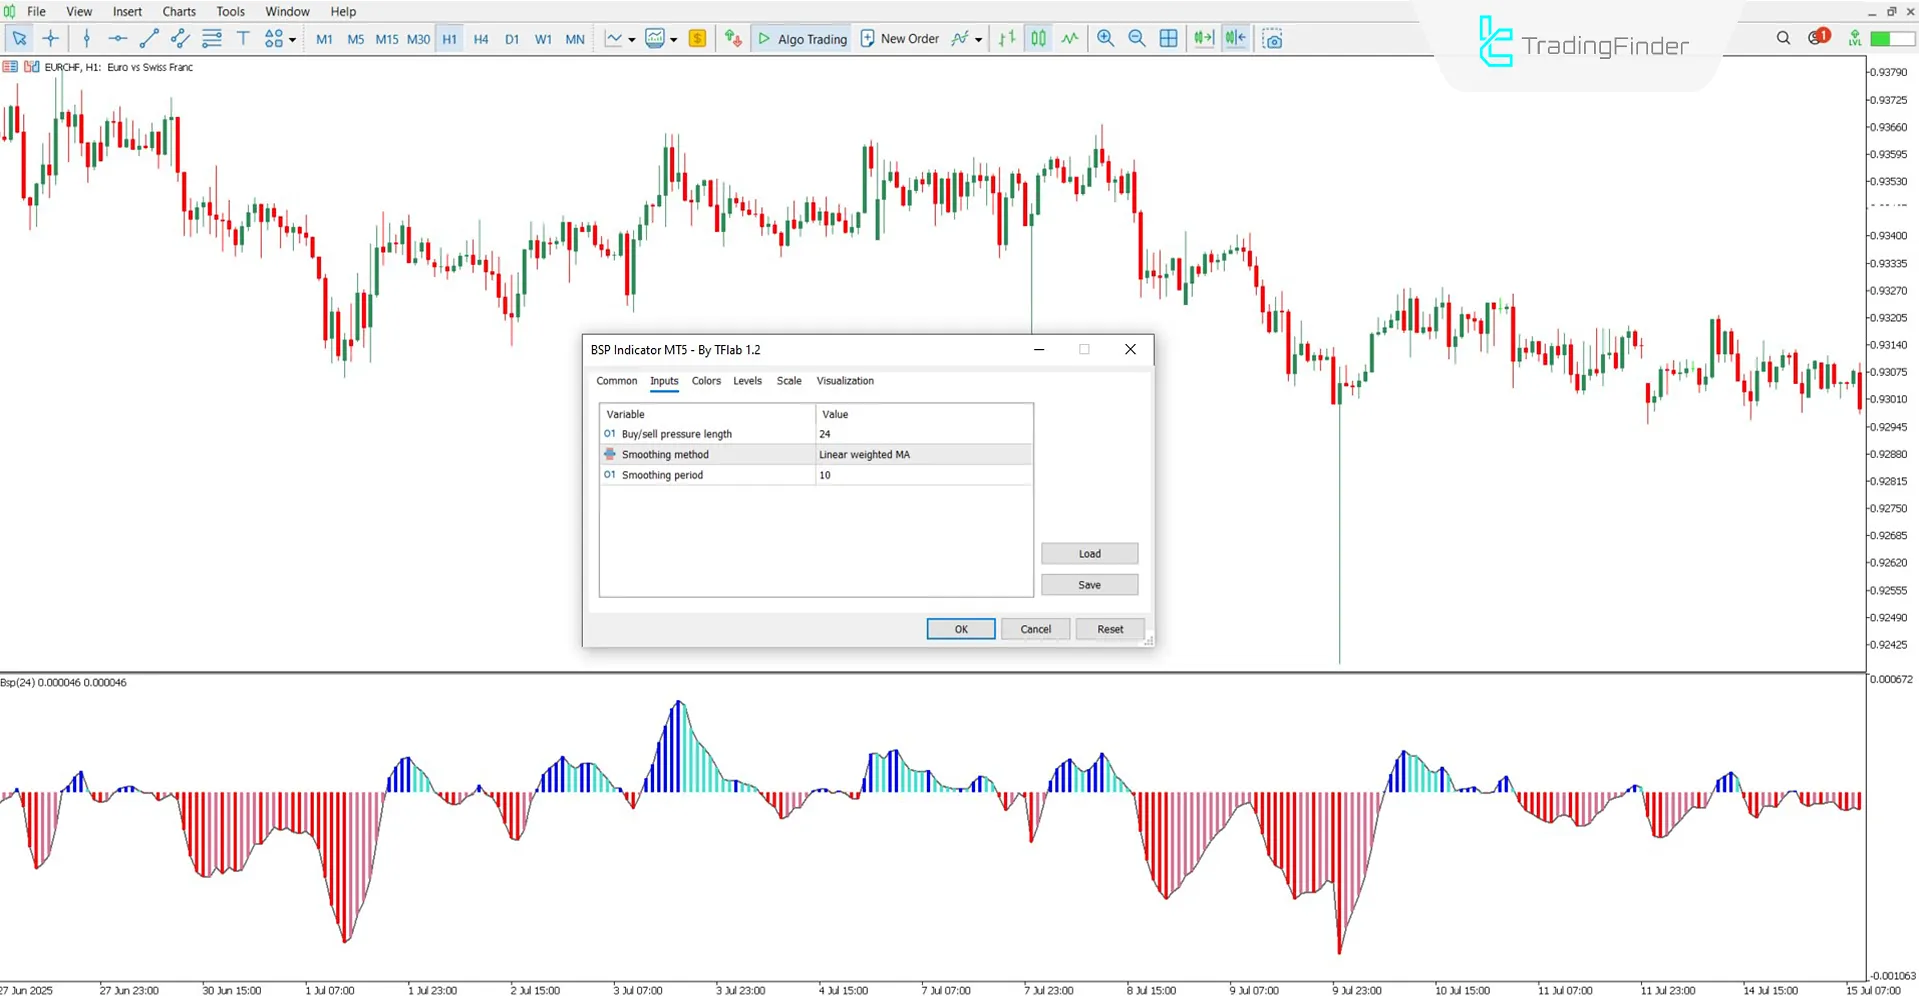
- Calculation Period: Indicator calculation period
- Smoothing Period: Smoothing period
- Smoothing Method: Weighted linear moving average method
- Strong Bullish Color: Strong bullish histogram color
- Weak Bullish Color: Weak bullish histogram color
- Strong Bearish Color: Strong bearish histogram color
- Weak Bearish Color: Weak bearish histogram color
Conclusion
The Buy Sell Pressure Indicator is used to measure buying and selling pressure in technical analysis.
This indicator analyzes trading volume and uses colored bars to show trend direction.
Additionally, bar color and size act as indicators of trend strength or weakness, determining the power of upward or downward market movement.
Buy Sell Pressure Indicator MT5 PDF
Buy Sell Pressure Indicator MT5 PDF
Click to download Buy Sell Pressure Indicator MT5 PDFWhat does the formation of negative bars indicate?
The formation of negative bars by the Buy Sell Pressure Indicator indicates the start of a bearish trend.
Which timeframes is this indicator suitable for?
The BSP Oscillator is multi-timeframe and can be applied and used in all timeframes.


