![Bulls Eye Forecaster Indicator for MetaTrader 5 Download - [TradingFinder]](https://cdn.tradingfinder.com/image/434969/2-94-en-bulls-eye-forecaster-indicator-mt5-1.webp)
![Bulls Eye Forecaster Indicator for MetaTrader 5 Download - [TradingFinder] 0](https://cdn.tradingfinder.com/image/434969/2-94-en-bulls-eye-forecaster-indicator-mt5-1.webp)
![Bulls Eye Forecaster Indicator for MetaTrader 5 Download - [TradingFinder] 1](https://cdn.tradingfinder.com/image/434958/2-94-en-bulls-eye-forecaster-indicator-mt5-2.webp)
![Bulls Eye Forecaster Indicator for MetaTrader 5 Download - [TradingFinder] 2](https://cdn.tradingfinder.com/image/434947/2-94-en-bulls-eye-forecaster-indicator-mt5-3.webp)
The Bulls Eye Forecaster trend prediction indicator is a technical tool used to analyze price behavior in markets such as Forex and cryptocurrencies. It helps identify trend reversals and assess price movement strength (momentum).
This MetaTrader 5 indicator draws red dotted lines on the chart to highlight potential price reversal zones, trend continuation areas, and optimal entry and exit points for trades.
Bulls Eye Forecaster Indicator Table
The table below presents the general specifications of the Bulls Eye Forecaster Trend Prediction Indicator:
Indicator Categories: | Currency Strength MT5 Indicators Trading Assist MT5 Indicators Momentum Indicators in MT5 |
Platforms: | MetaTrader 5 Indicators |
Trading Skills: | Intermediate |
Indicator Types: | Reversal MT5 Indicators |
Timeframe: | Multi-Timeframe MT5 Indicators |
Trading Style: | Intraday MT5 Indicators |
Trading Instruments: | Forex MT5 Indicators Crypto MT5 Indicators Stock MT5 Indicators Commodity MT5 Indicators Indices MT5 Indicators Share Stock MT5 Indicators |
Indicator Overview
The Bulls Eye Forecaster indicator is designed based on price behavior analysis and the reactions of buyers and sellers.
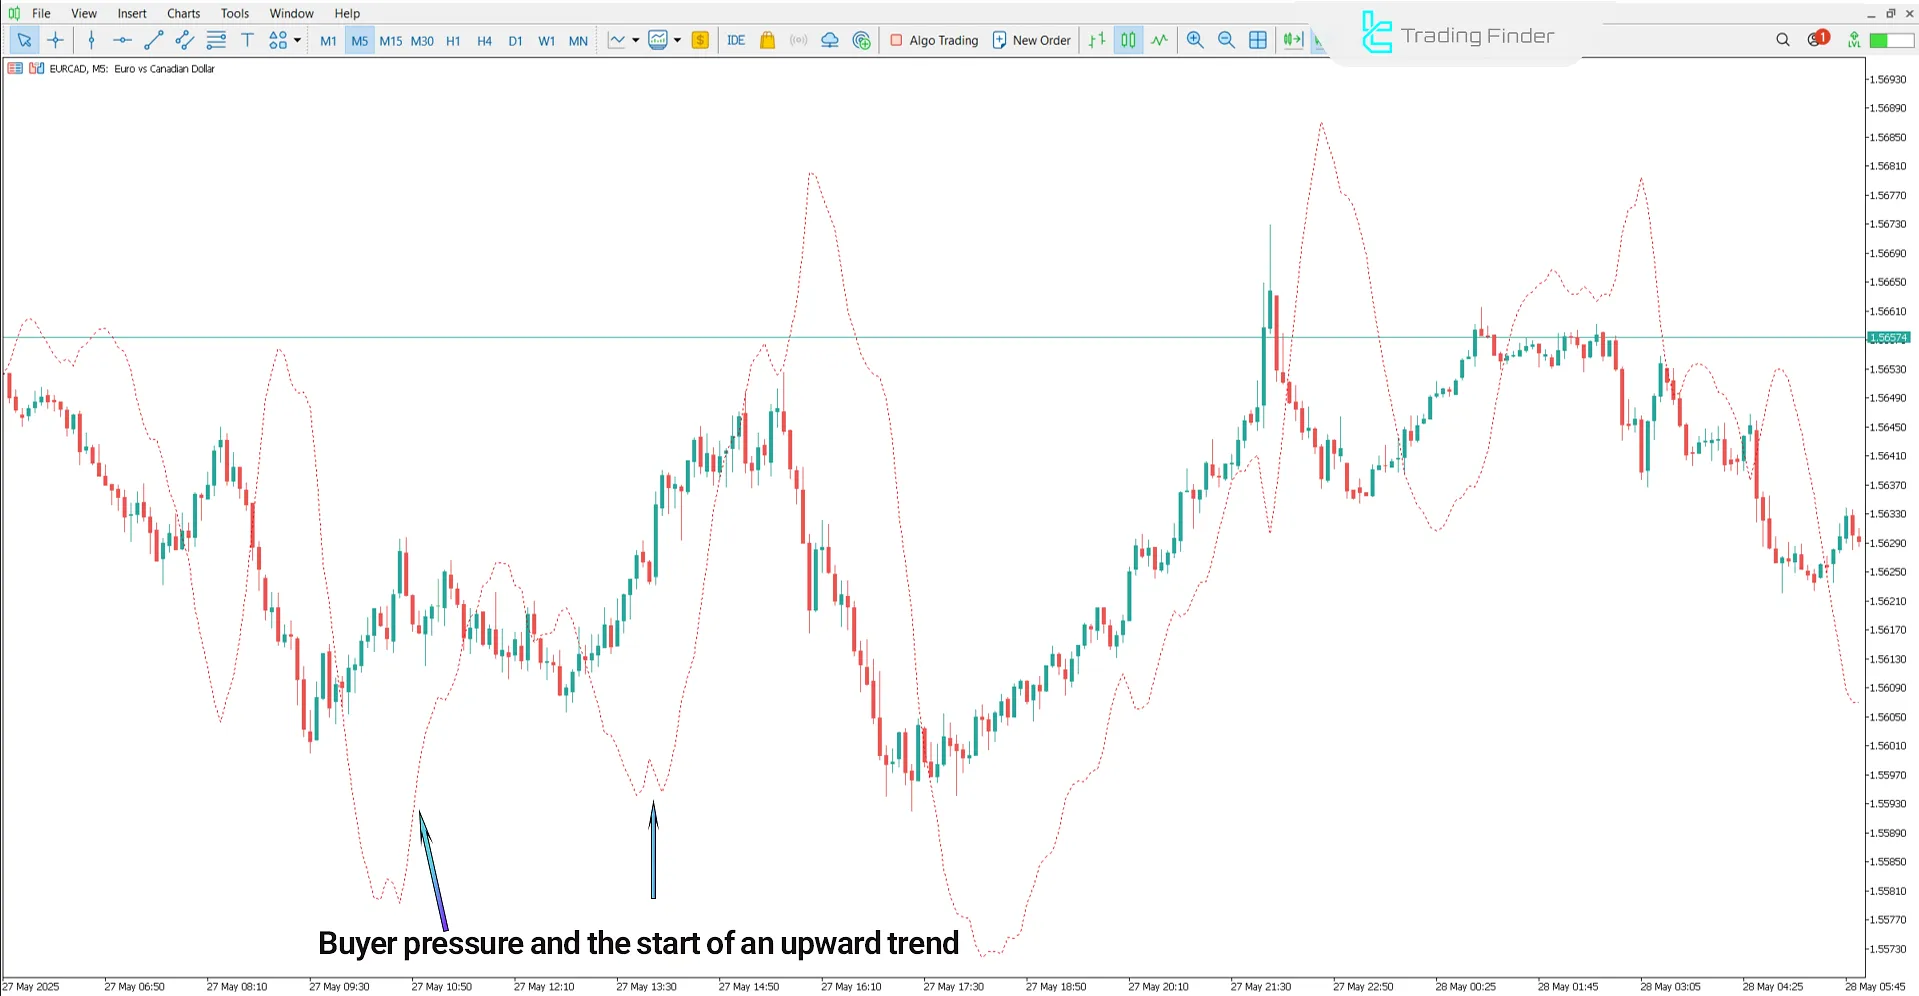
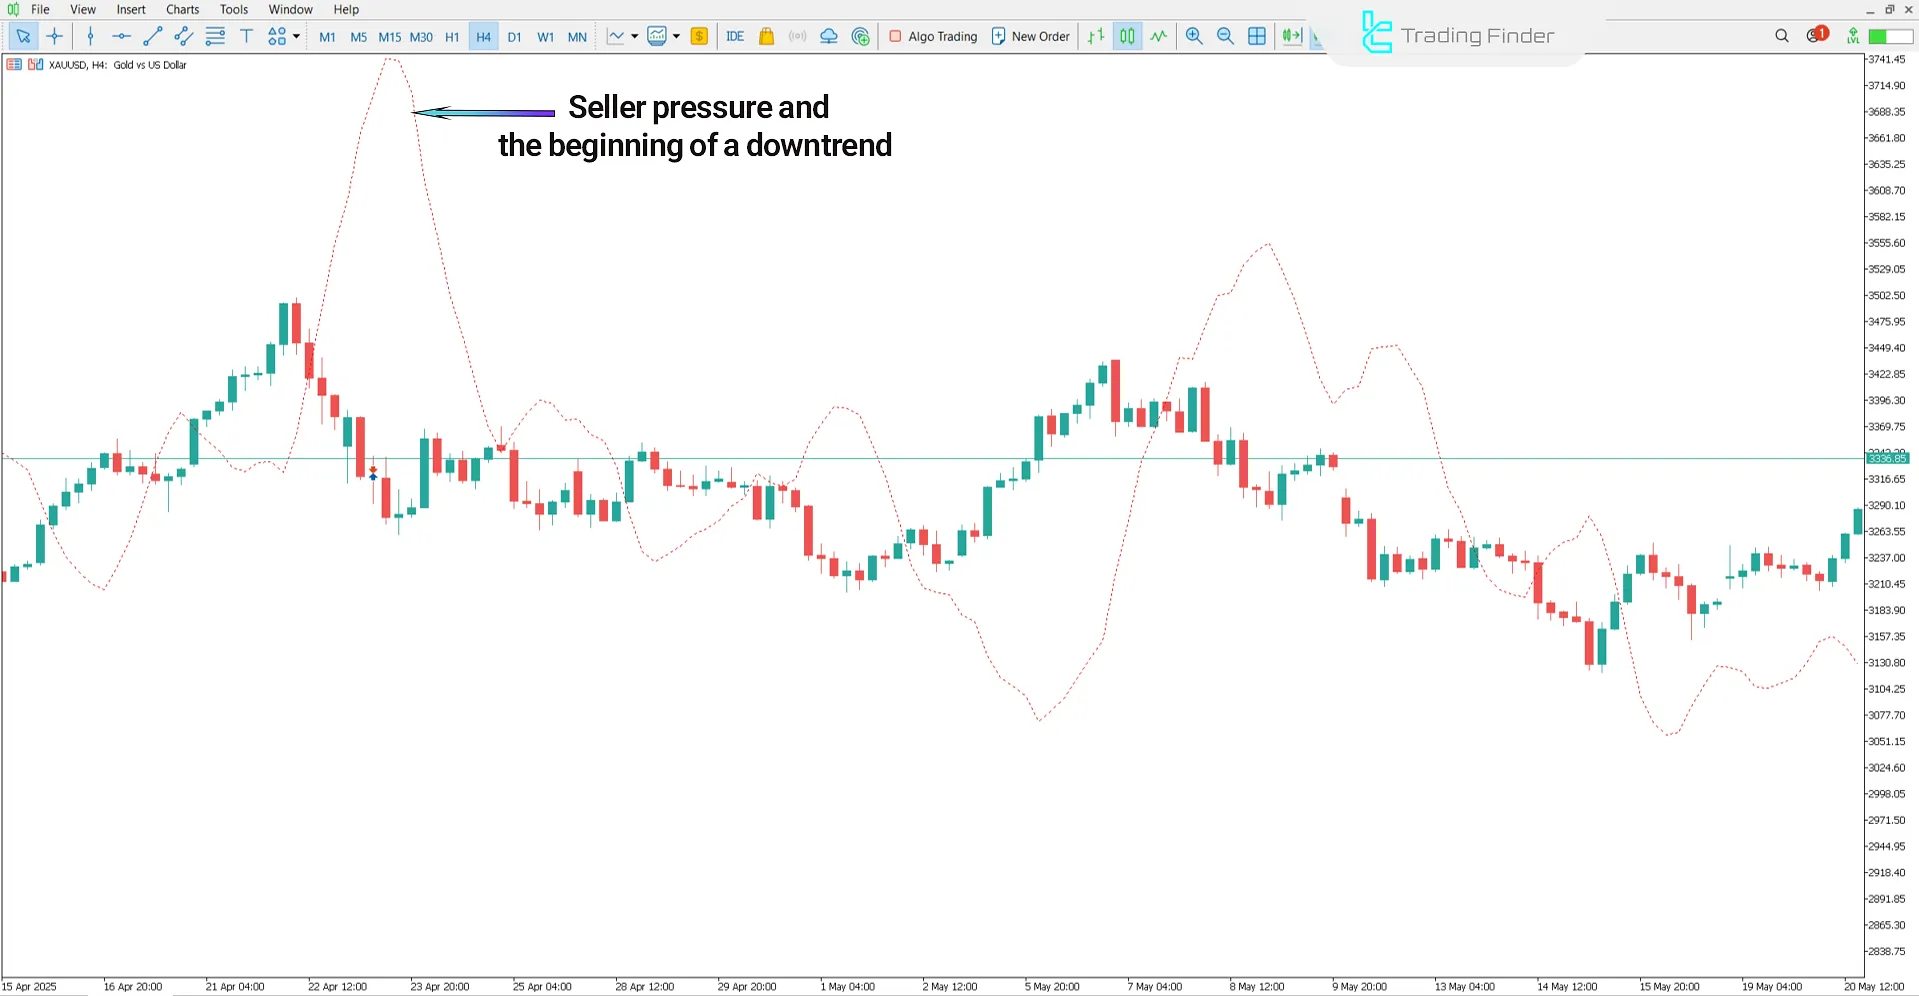
When the red dotted lines are below the price chart, they form a bullish trend. In contrast, when these lines are above the price, it signals increased selling pressure and the beginning of a bearish trend.
Uptrend Conditions
The chart below displays the EUR/CAD currency pair in a 5-minute timeframe.
When the red dotted line of the indicator appears below the candles and its depth or distance from price increases, it reflects the strength of buyers and the persistence of the bullish trend.

Downtrend Conditions
The following chart shows the 4-hour timeframe of the global gold price (XAU/USD).
When the red dotted line appears above the candles and its distance from price gradually increases, it indicates strengthening bearish momentum and increasing selling pressure.
This scenario marks an ideal zone for initiating sell trades.

Conclusion
The Bulls Eye Forecaster is a practical technical analysis tool that helps identify potential trend reversal points and market momentum changes by analyzing the position of the lines in relation to price.
Additionally, this indicator highlights key zones on the chart to assist in identifying suitable entry and exit levels and to support various trading strategies.
Bulls Eye Forecaster MT5 PDF
Bulls Eye Forecaster MT5 PDF
Click to download Bulls Eye Forecaster MT5 PDFOn what basis does the Bulls Eye Forecaster Indicator operate?
It analyzes the position of the red dotted lines in relation to price candles to interpret market behavior and detect trend reversal points and momentum changes.
Is the Bulls Eye Forecaster Indicator usable across all timeframes?
Yes; this trading tool is applicable in all timeframes, from 1-minute to long-term charts.


