The Buy Sell Pressure Indicator is one of the momentum analysis tools available in MetaTrader 5 indicators, designed to identify and display buying and selling pressure zones in the market.
This indicator provides real-time visualization of entry and exit points in the oscillator window, highlighting key areas for traders. Additionally, due to its ability to detect price trends, it is particularly useful for scalpers and intraday traders seeking precise market signals.
Indicator Specifications
The details of this indicator are fully presented in the table below:
Indicator Categories:
Price Action MT5 Indicators
Oscillators MT5 Indicators
Currency Strength MT5 Indicators
Platforms:
MetaTrader 5 Indicators
Trading Skills:
Elementary
Indicator Types:
Trend MT5 Indicators
Reversal MT5 Indicators
Timeframe:
Daily-Weekly Timeframe MT5 Indicators
Trading Style:
Day Trading MT5 Indicators
Trading Instruments:
Forex MT5 Indicators
Crypto MT5 Indicators
Stock MT5 Indicators
Forward MT5 Indicators
Share Stock MT5 Indicators
Overview of the Indicator
In this indicator, buy pressure are displayed in blue, and sell pressure are shown in red. Traders can use these zones to identify suitable Entry and Exit points for their trading strategies.
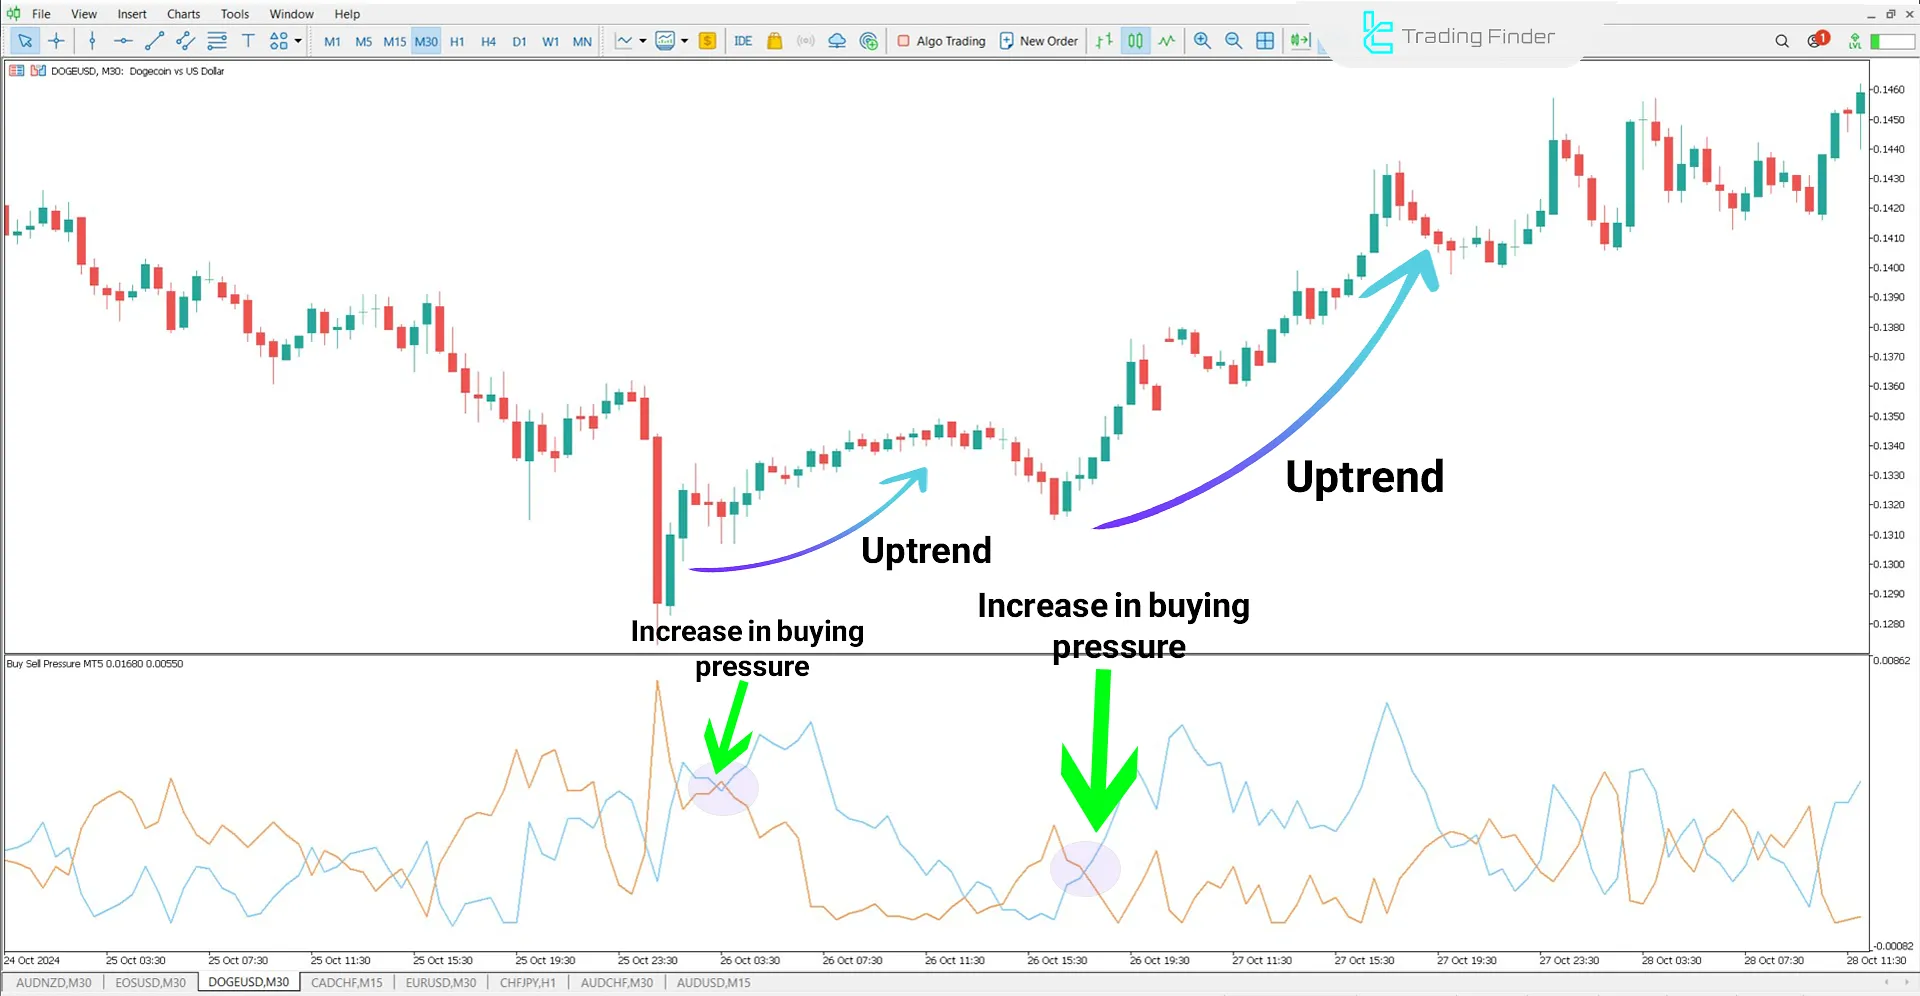
The Indicator in an Uptrend
In the Buy Sell Pressure Indicator, a continuous increase in buying pressure (blue line) can be an indication of the beginning of an uptrend. The chart below illustrates the price movement of Dogecoin (DOGE) in a 30-minute time frame.
In this chart, the blue line crossing above the orange line signals an increase in buying pressure, leading to the formation of an uptrend.
The chart below represents the price pair of Dogecoin to the US Dolla
The Indicator in a Downtrend
The chart below represents the EUR/USD currency pair in a 4-hour time frame. As shown in the image, buying pressure has decreased, indicating a decline in market demand for buying positions.
Traders can utilize additional tools and necessary confirmations to consider entering a sell trade in these zones.
The price chart of EUR/USD in a 4-hour timeframe
Indicator Settings
The indicator settings are displayed in the image below:
Indicator settings for Buy Sell Pressure
Chart Theme: Background color of the chart;
Period: The calculation period for candles (default is 13).
Conclusion
TheBuy Sell Pressure Indicator is designed for analyzing market momentum movements, providing real-time visualization of buying and selling pressure zones.
This tool is used for identifying market momentum and trends. Additionally, by displaying key areas in a simple and intuitive manner, it helps traders of all levels, from beginners to professionals, to identify entry and exit points effectively.
Buy Sell Pressure MT5 PDF
Buy Sell Pressure MT5 PDF
Click to download Buy Sell Pressure MT5 PDF
5 From 5.0
(7)
Rate this post
FAQs
What is the Buy Sell Pressure Indicator, and what is its use?
The Buy-Sell Pressure Indicator on MetaTrader 5 displays Overbought and Oversold zones in real-time and helps identify Entry and Exit points.
How do you use the colored lines in this indicator?
This indicator displays Overbought zones in blue and Oversold zones in red.


![Buy Sell Pressure Indicator for MetaTrader 5 Download - Free - [TradingFinder]](https://cdn.tradingfinder.com/image/238678/4-19-en-buy-sell-pressure-mt5-1.webp)
![Buy Sell Pressure Indicator for MetaTrader 5 Download - Free - [TradingFinder] 2](https://cdn.tradingfinder.com/image/238719/4-19-en-buy-sell-pressure-mt5-4.webp)
![Buy Sell Pressure Indicator for MetaTrader 5 Download - Free - [TradingFinder] 3](https://cdn.tradingfinder.com/image/238720/4-19-en-buy-sell-pressure-mt5-3.webp)