![Buy Sell Volume Indicator for MetaTrader 5 Download - [TradingFinder]](https://cdn.tradingfinder.com/image/396698/2-71-en-buy-sell-volume-mt5-1.webp)
![Buy Sell Volume Indicator for MetaTrader 5 Download - [TradingFinder] 0](https://cdn.tradingfinder.com/image/396698/2-71-en-buy-sell-volume-mt5-1.webp)
![Buy Sell Volume Indicator for MetaTrader 5 Download - [TradingFinder] 1](https://cdn.tradingfinder.com/image/396703/2-71-en-buy-sell-volume-mt5-2.webp)
![Buy Sell Volume Indicator for MetaTrader 5 Download - [TradingFinder] 2](https://cdn.tradingfinder.com/image/396699/2-71-en-buy-sell-volume-mt5-3.webp)
![Buy Sell Volume Indicator for MetaTrader 5 Download - [TradingFinder] 3](https://cdn.tradingfinder.com/image/396702/2-71-en-buy-sell-volume-mt5-4.webp)
Buy Sell Volume Indicator belongs to the class of trend oscillators. It is designed for technical analysis to detect the direction and strength of supply and demand flows.
This MetaTrader 5 oscillator displays buyer pressure (yellow bars) and seller pressure (pink bars) as a histogram around the zero line. It separates each candle's volume into buy and sell volumes and calculates the difference.
Buy Sell Volume Specifications Table
The following table presents the general specifications of the Buy Sell Volume indicator:
Indicator Categories: | Volume MT5 Indicators Oscillators MT5 Indicators Trading Assist MT5 Indicators |
Platforms: | MetaTrader 5 Indicators |
Trading Skills: | Intermediate |
Indicator Types: | Reversal MT5 Indicators |
Timeframe: | Multi-Timeframe MT5 Indicators |
Trading Style: | Intraday MT5 Indicators |
Trading Instruments: | Forex MT5 Indicators Crypto MT5 Indicators Stock MT5 Indicators Commodity MT5 Indicators Indices MT5 Indicators Forward MT5 Indicators Share Stock MT5 Indicators |
Indicator Overview
In the Buy Sell Volume Indicator, each candle's buy and sell volumes are first calculated separately.
Then, by comparing the two components, positive values are displayed on the histogram when buy volume dominates, and negative values when sell volume dominates, visually revealing the actual market pressure.
Uptrend Conditions
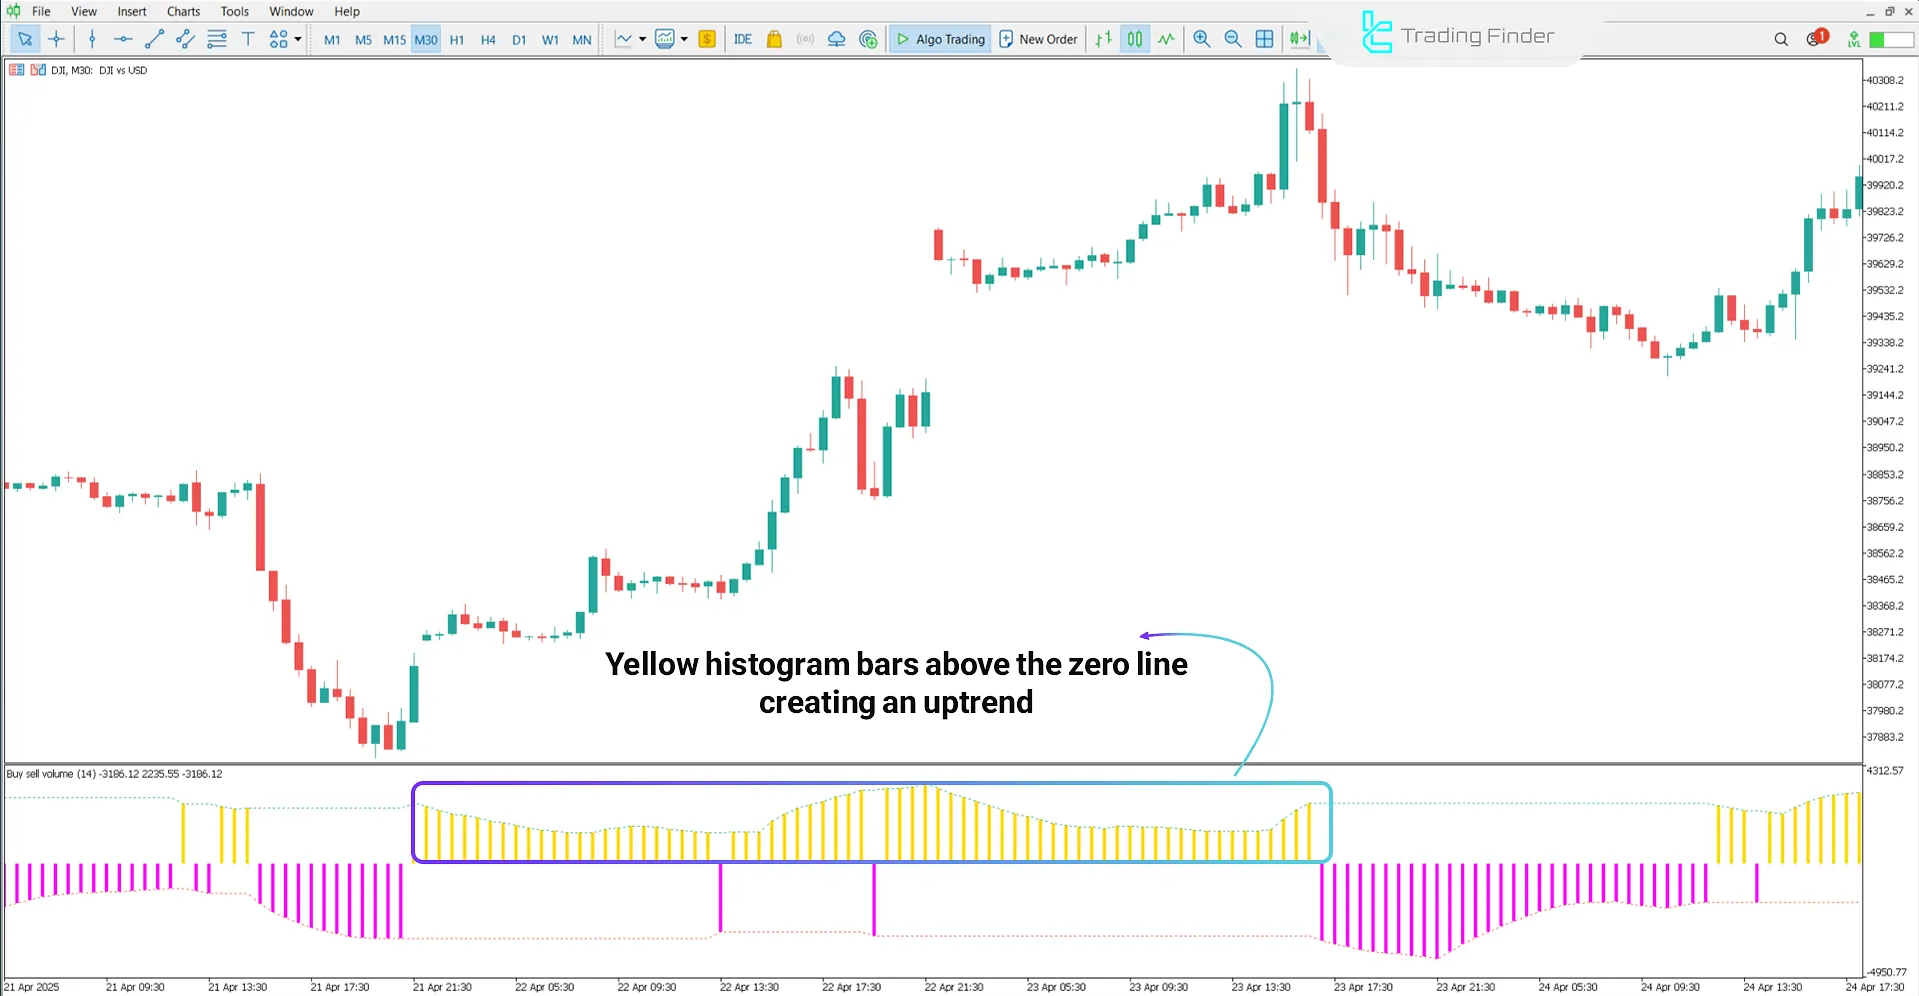
The image below shows the Dow Jones Index (DJI) price chart on a 30-minute time frame.
When the histogram bars move into positive areas with significant volume height, it may be a signal to enter buy positions in Trading Tools.

Downtrend Conditions
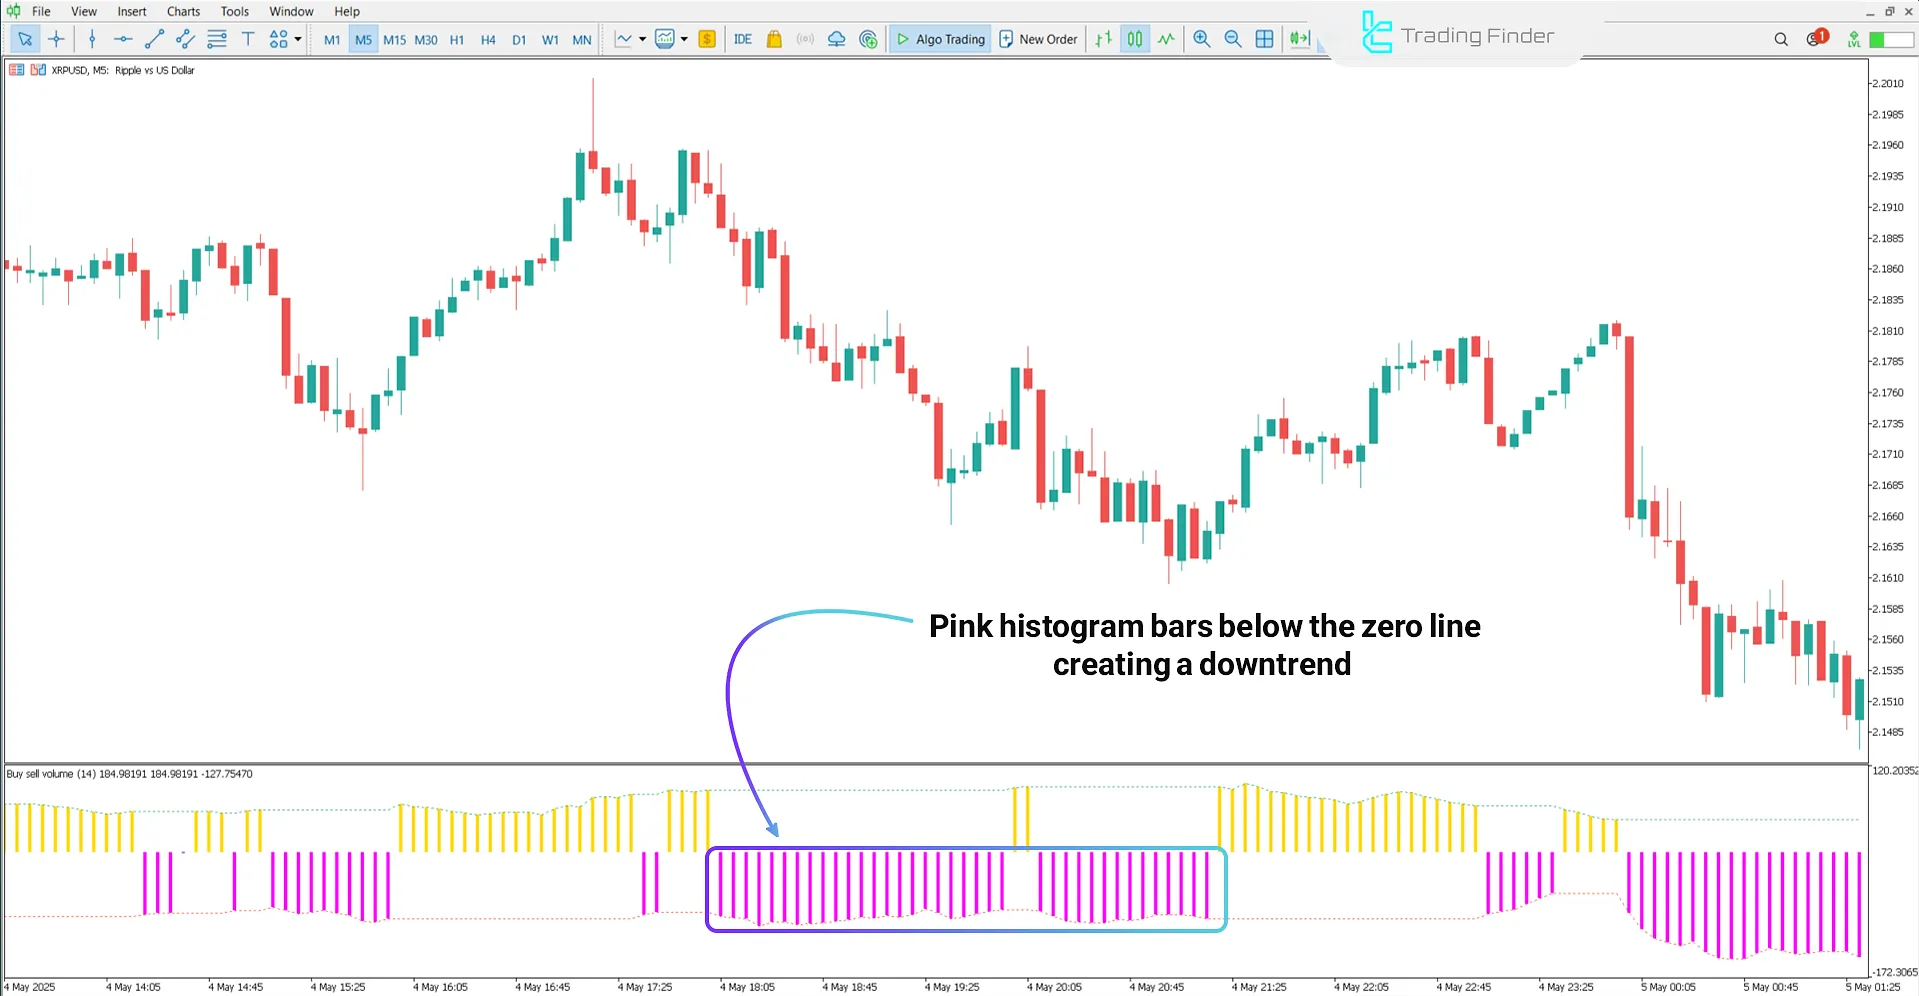
In the 5-minute chart of Ripple (XRP/USD), a sell position opportunity is triggered when the histogram bars drop below the zero line and their height exceeds the average volume of previous periods.

Buy Sell Volume Indicator Settings
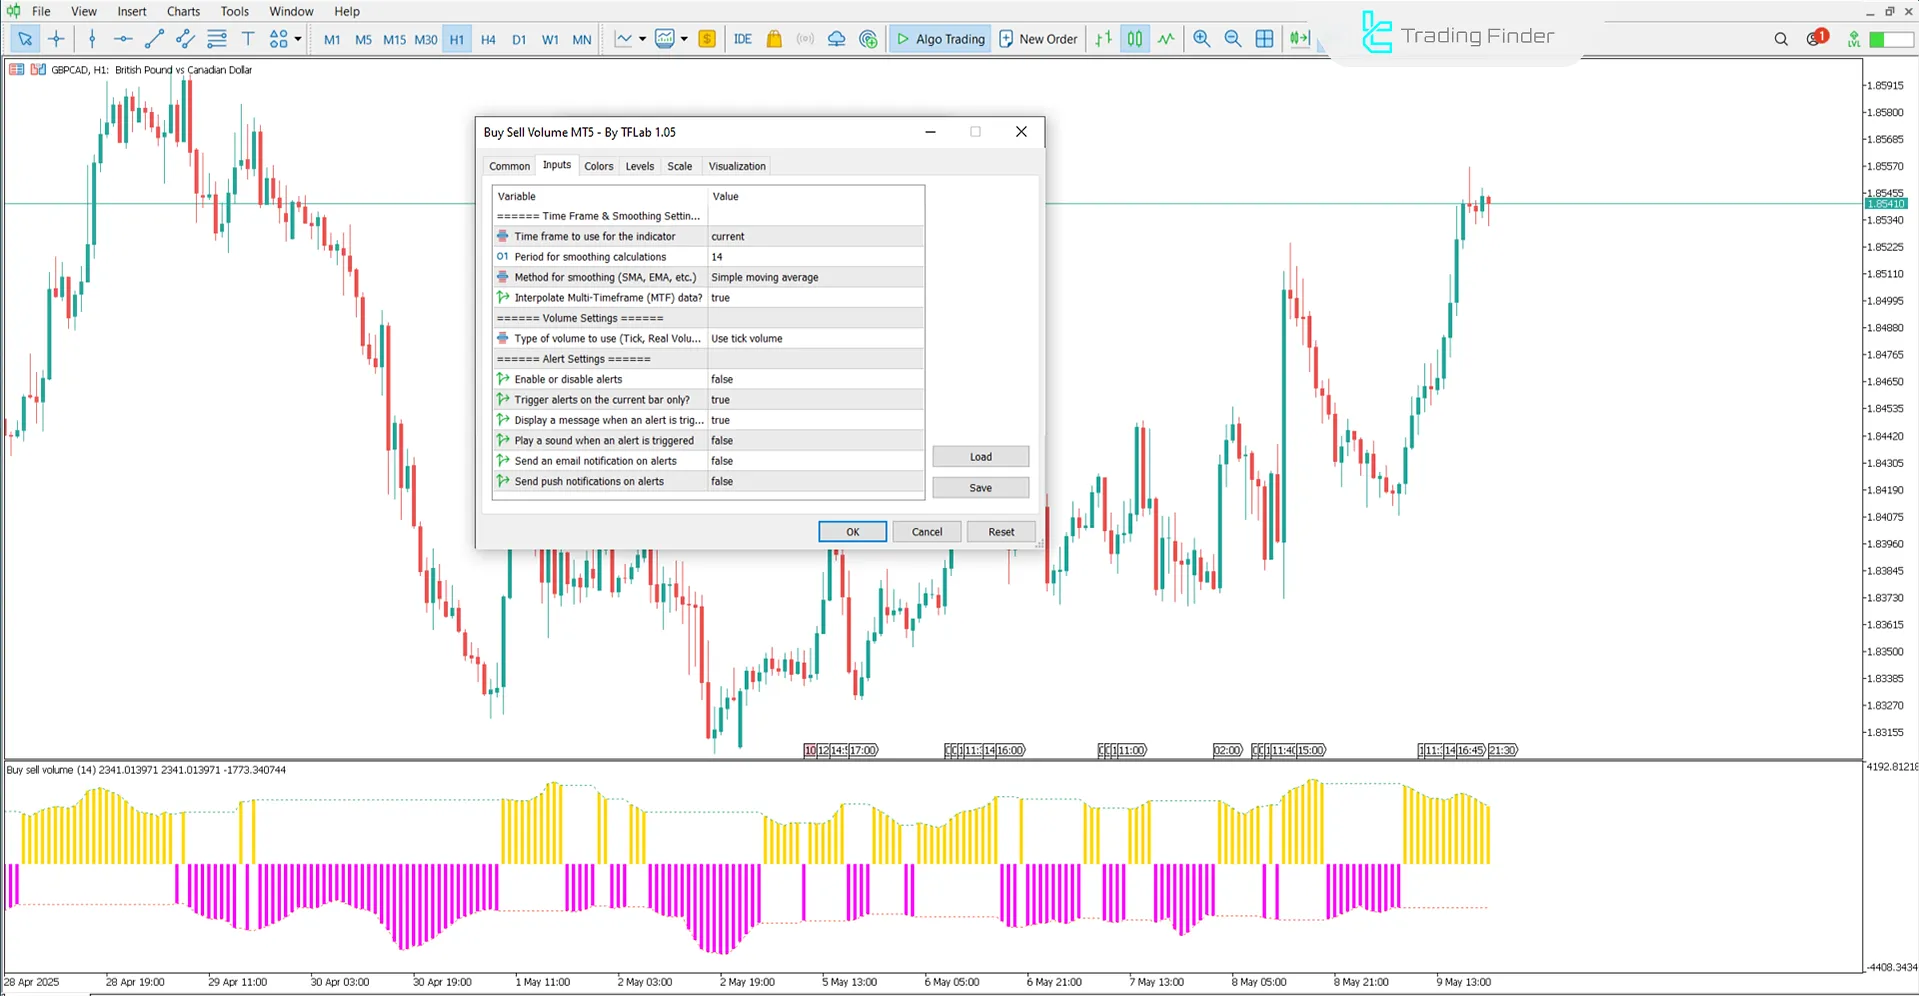
The image below displays the settings panel of the Buy Sell Volume indicator:

- Time frame to use for the indicator: Time frame selected for calculations
- Period for smoothing calculations: Number of periods for smoothing
- Method for smoothing (SMA, EMA, etc.): Smoothing method (e.g., SMA, EMA)
- Type of volume to use (Tick, Real Volume, etc.): Type of volume (Tick, Real Volume, etc.)
- Enable or disable alerts: Turn alerts on or off
- Trigger alerts on the current bar only: Enable alerts for the current candle only
- Display a message when an alert is triggered: Show a message on the alert
- Play a sound when an alert is triggered: Play a sound alert
- Send an email notification on alerts: Email notification on alert
- Send push notifications on alerts: Push notification on alert
Conclusion
The Buy and Sell Volume Indicator separates each candle's volume into buy and sell. It displays the dominance of buyers (positive bars above zero) or sellers (negative bars below zero) as a trend histogram around the zero line.
Buy Sell Volume MT5 PDF
Buy Sell Volume MT5 PDF
Click to download Buy Sell Volume MT5 PDFWhich time frames are suitable for the Buy Sell Volume Indicator?
This MetaTrader 5 trading tool can be used on all time frames.
What is the role of the zero line in this oscillator?
The zero line in the Buy and Sell Volume Indicator is a baseline to measure the balance between buyer and seller pressure.


