![Candle Range in pips Indicator for MetaTrader 5 Download - [TradingFinder]](https://cdn.tradingfinder.com/image/520272/2-127-en-candle-range-in-pips-mt5-1.webp)
![Candle Range in pips Indicator for MetaTrader 5 Download - [TradingFinder] 0](https://cdn.tradingfinder.com/image/520272/2-127-en-candle-range-in-pips-mt5-1.webp)
![Candle Range in pips Indicator for MetaTrader 5 Download - [TradingFinder] 1](https://cdn.tradingfinder.com/image/520262/2-127-en-candle-range-in-pips-mt5-2.webp)
![Candle Range in pips Indicator for MetaTrader 5 Download - [TradingFinder] 2](https://cdn.tradingfinder.com/image/520269/2-127-en-candle-range-in-pips-mt5-3.webp)
The Candle Range in pips indicator is an analytical tool designed to accurately display the actual range of each candlestick, based on the difference between the high and low prices.
This indicator displays market volatility as a bar histogram at the bottom of the chart, where each bar represents the movement range of the same candle.
In this oscillator structure, green bars are used for bullish candles, and red bars for bearish candles.
Candle Range in pips Indicator Table
The table below presents the general features of the Candle Range in pips indicator on the MetaTrader 5 platform.
Indicator Categories: | Oscillators MT5 Indicators Trading Assist MT5 Indicators Momentum Indicators in MT5 |
Platforms: | MetaTrader 5 Indicators |
Trading Skills: | Elementary |
Indicator Types: | Reversal MT5 Indicators |
Timeframe: | Multi-Timeframe MT5 Indicators |
Trading Style: | Intraday MT5 Indicators |
Trading Instruments: | Forex MT5 Indicators Crypto MT5 Indicators Stock MT5 Indicators |
Candle Range in pips at a Glance
In the Candle Range in pips indicator, changes in the size of histogram bars reflect the level of real-time market volatility.
Such conditions may provide signs of price action strength, the probability of breaking key levels, and momentum shifts.
Moreover, this analytical tool is widely used in trading strategies such as Price Action, Scalping, and Breakout methods, serving as a time filter and playing a crucial role in identifying precise entry and exit points.
Indicator in an Uptrend
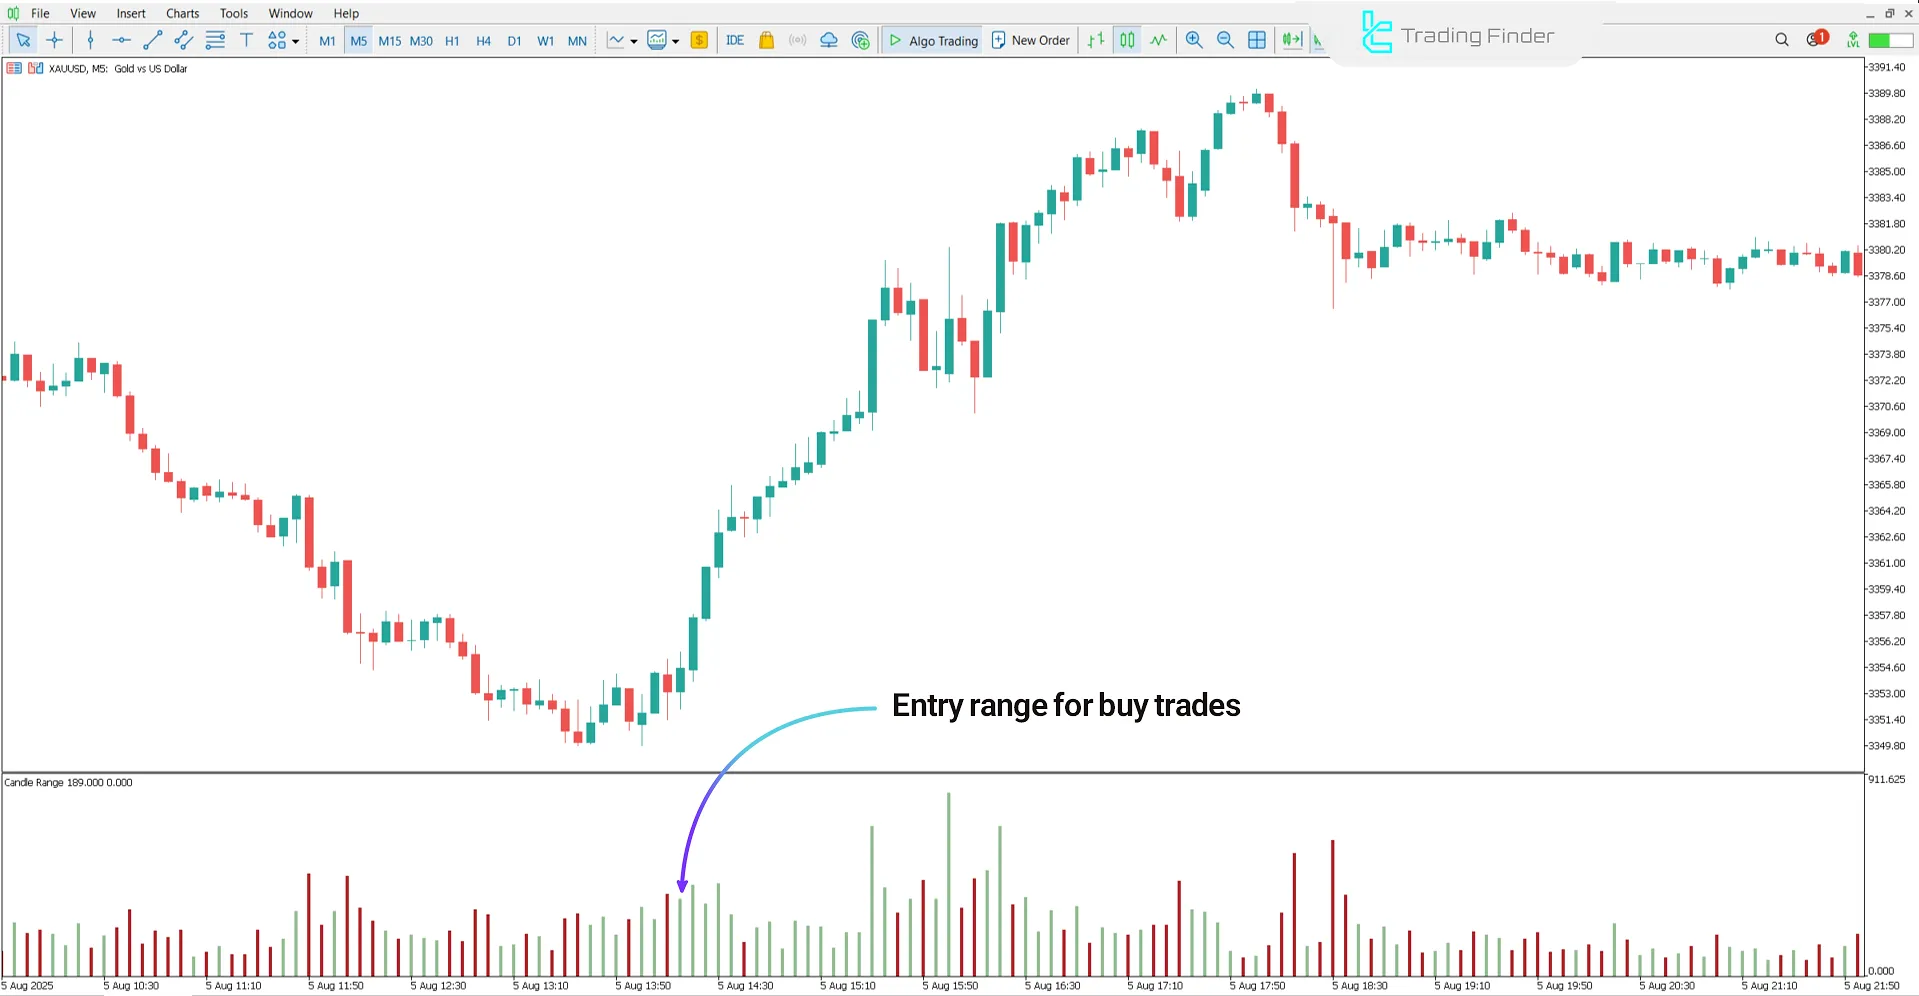
The following chart shows the Gold Spot Index (XAU/USD) on the 5-minute timeframe.
When the histogram bar height gradually increases and price surpasses previous resistance levels—while a bullish breakout is accompanied by an expansion in volatility—this condition signals the strengthening of buyers.

Indicator in a Downtrend
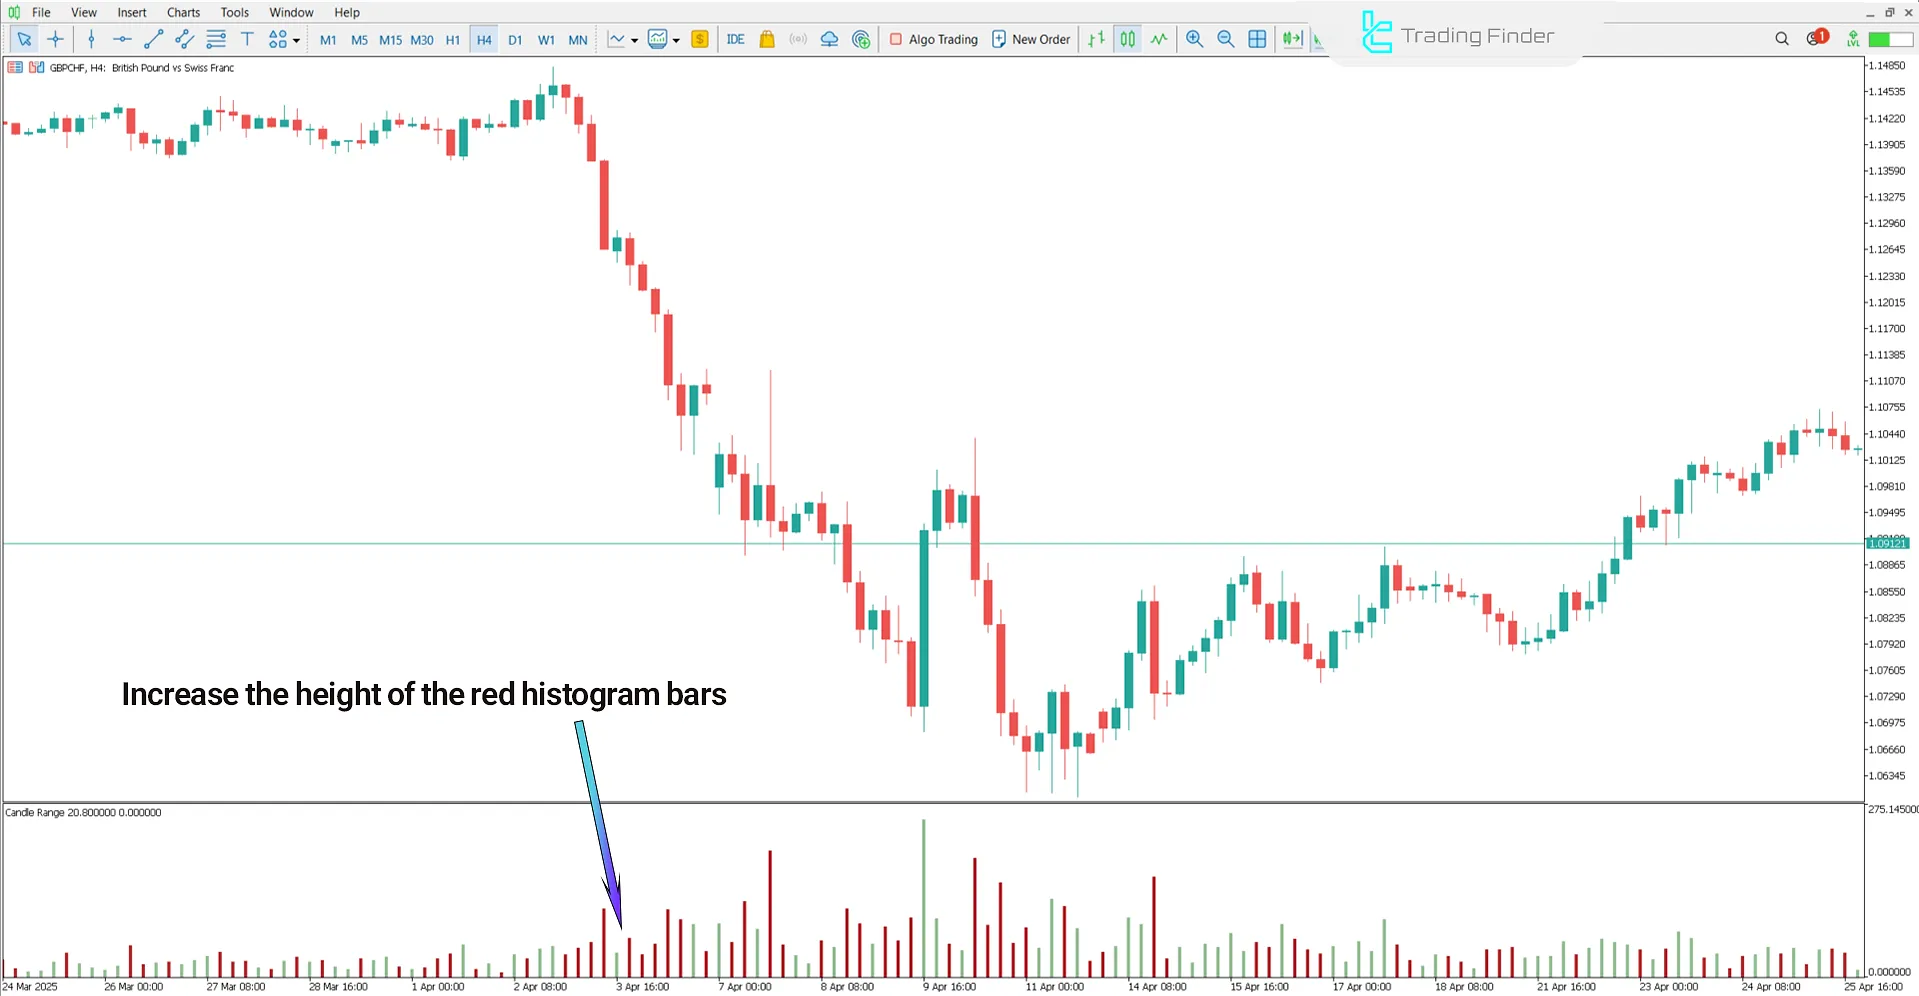
The following chart displays the GBP/CHF index on the 4-hour timeframe. In this indicator, the breakdown of support levels is accompanied by widening volatility ranges and the formation of long candles with upper shadows.
Such conditions can be seen as a sign of increasing selling pressure and may create a favorable situation for entering sell positions.

Conclusion
The Candle Range in pips Oscillator is one of the most suitable tools for measuring the actual volatility of candlesticks.
By analyzing the price movement range within each candle, this trading tool provides a clear perspective on the strength of market momentum and the potential for breaking key levels or reversing trends.
Candle Range in pips Indicator for MetaTrader 5 PDF
Candle Range in pips Indicator for MetaTrader 5 PDF
Click to download Candle Range in pips Indicator for MetaTrader 5 PDFWhat is the application of the Candle Range in the pips indicator?
This trading tool measures the actual candlestick range (the difference between the High and Low) in pips and displays it as a bar histogram.
What information does the Candle Range in pips indicator provide to traders?
This oscillator displays market volatility intensity, momentum changes, and the probability of trend breakouts or reversals through variations in histogram bar sizes.


