![CCI Histogram indicator for MetaTrader 5 Download – [TradingFinder]](https://cdn.tradingfinder.com/image/205321/2-16-en-cci-histogram-mt5-1.webp)
![CCI Histogram indicator for MetaTrader 5 Download – [TradingFinder] 0](https://cdn.tradingfinder.com/image/205321/2-16-en-cci-histogram-mt5-1.webp)
![CCI Histogram indicator for MetaTrader 5 Download – [TradingFinder] 1](https://cdn.tradingfinder.com/image/205323/2-16-en-cci-histogram-mt5-2.webp)
![CCI Histogram indicator for MetaTrader 5 Download – [TradingFinder] 2](https://cdn.tradingfinder.com/image/205320/2-16-en-cci-histogram-mt5-3.webp)
![CCI Histogram indicator for MetaTrader 5 Download – [TradingFinder] 3](https://cdn.tradingfinder.com/image/205322/2-16-en-cci-histogram-mt5-4.webp)
The CCI Histogram indicator is a tool in MetaTrader 5 that calculates and displays the difference between the current and average prices over a specified period.
This tool is a modified version of the standard CCI Oscillator, designed to identify price fluctuations and provide entry and exit signals in financial markets.
CCI Histogram Specification Table
The general specifications of the CCI Histogram indicator are presented in the table below:
Indicator Categories: | Oscillators MT5 Indicators Volatility MT5 Indicators Currency Strength MT5 Indicators |
Platforms: | MetaTrader 5 Indicators |
Trading Skills: | Intermediate |
Indicator Types: | Range MT5 Indicators Breakout MT5 Indicators |
Timeframe: | Multi-Timeframe MT5 Indicators |
Trading Style: | Intraday MT5 Indicators |
Trading Instruments: | Forex MT5 Indicators Crypto MT5 Indicators Stock MT5 Indicators Commodity MT5 Indicators Indices MT5 Indicators Share Stock MT5 Indicators |
Uptrend Conditions
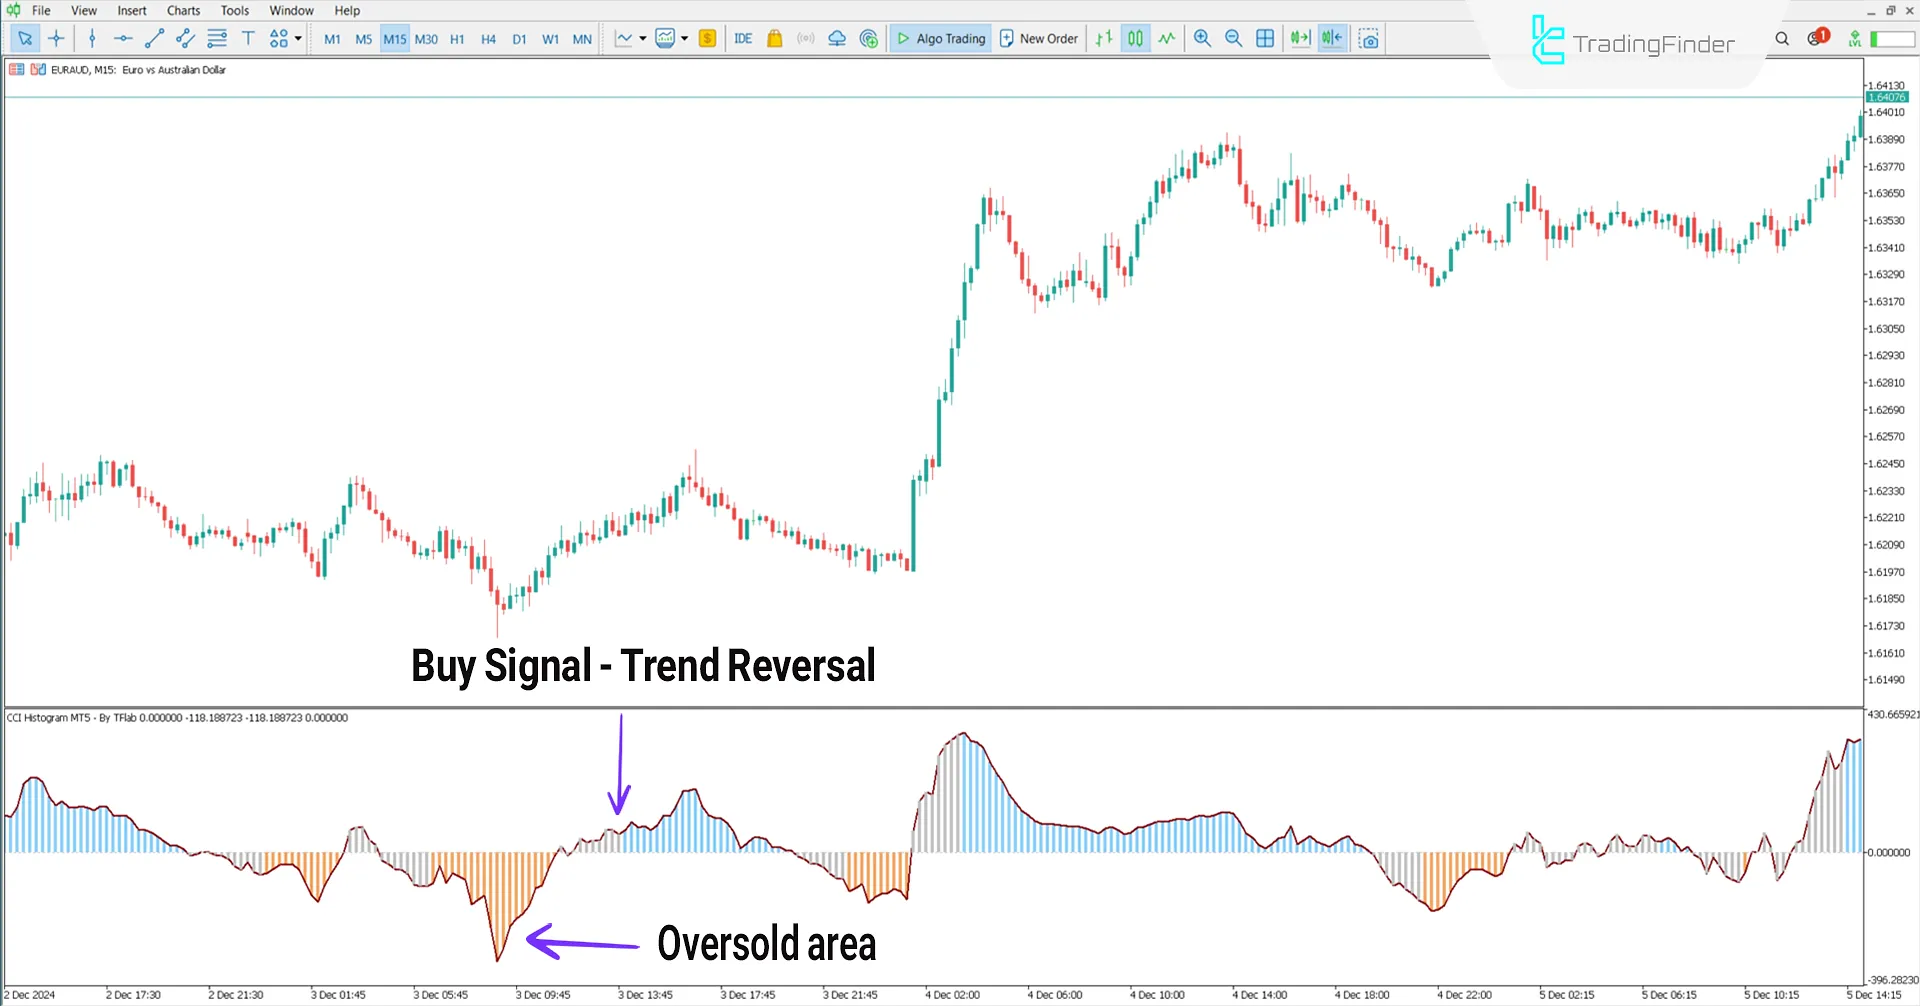
The price chart below shows the EUR/AUD currency pair in a 15-minute timeframe. When the CCI value becomes negative, and the histogram turns orange, it indicates that the market is entering an oversold condition.

Downtrend Conditions
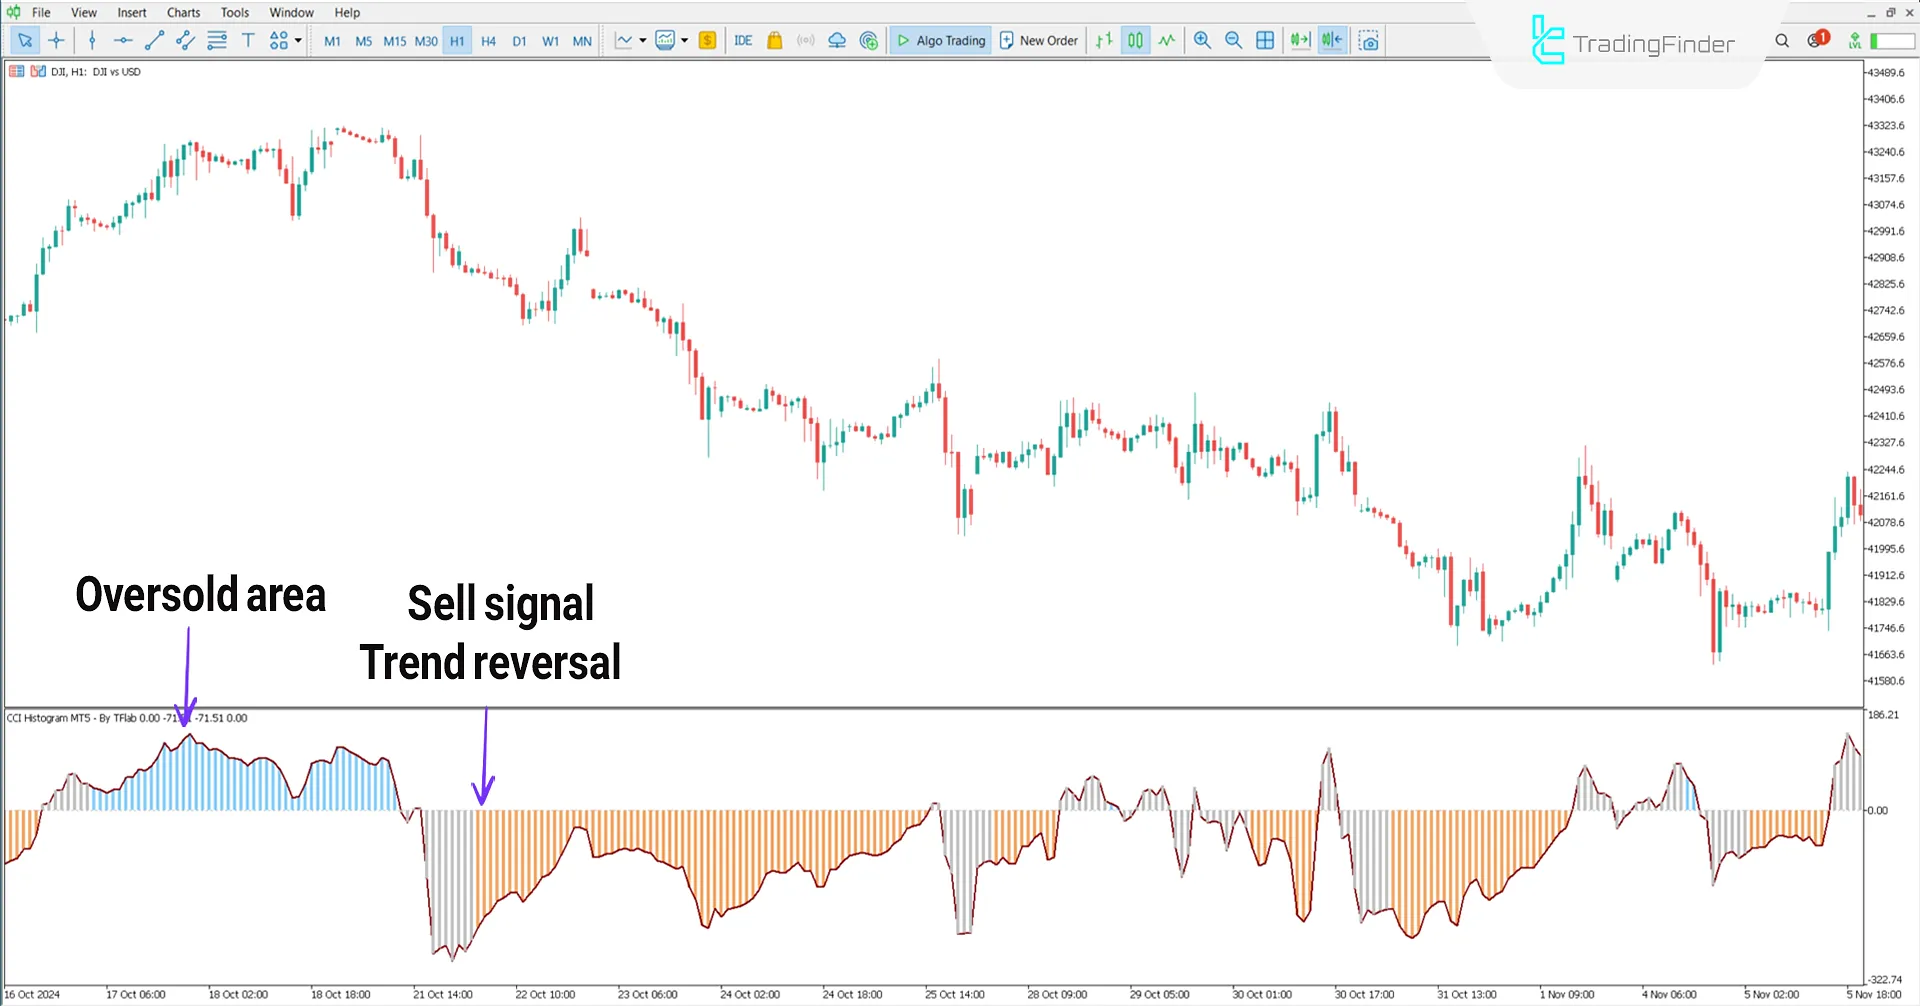
The chart below displays the Dow Jones index (DJI) in a 1-hour timeframe. When the CCI value becomes negative, and the histogram turns orange, it confirms that the market has entered an overbought condition.
If the CCI returns from the positive zone and moves downward, this situation indicates a potential start of a bearish trend and can be considered an entry signal.

Indicator Settings
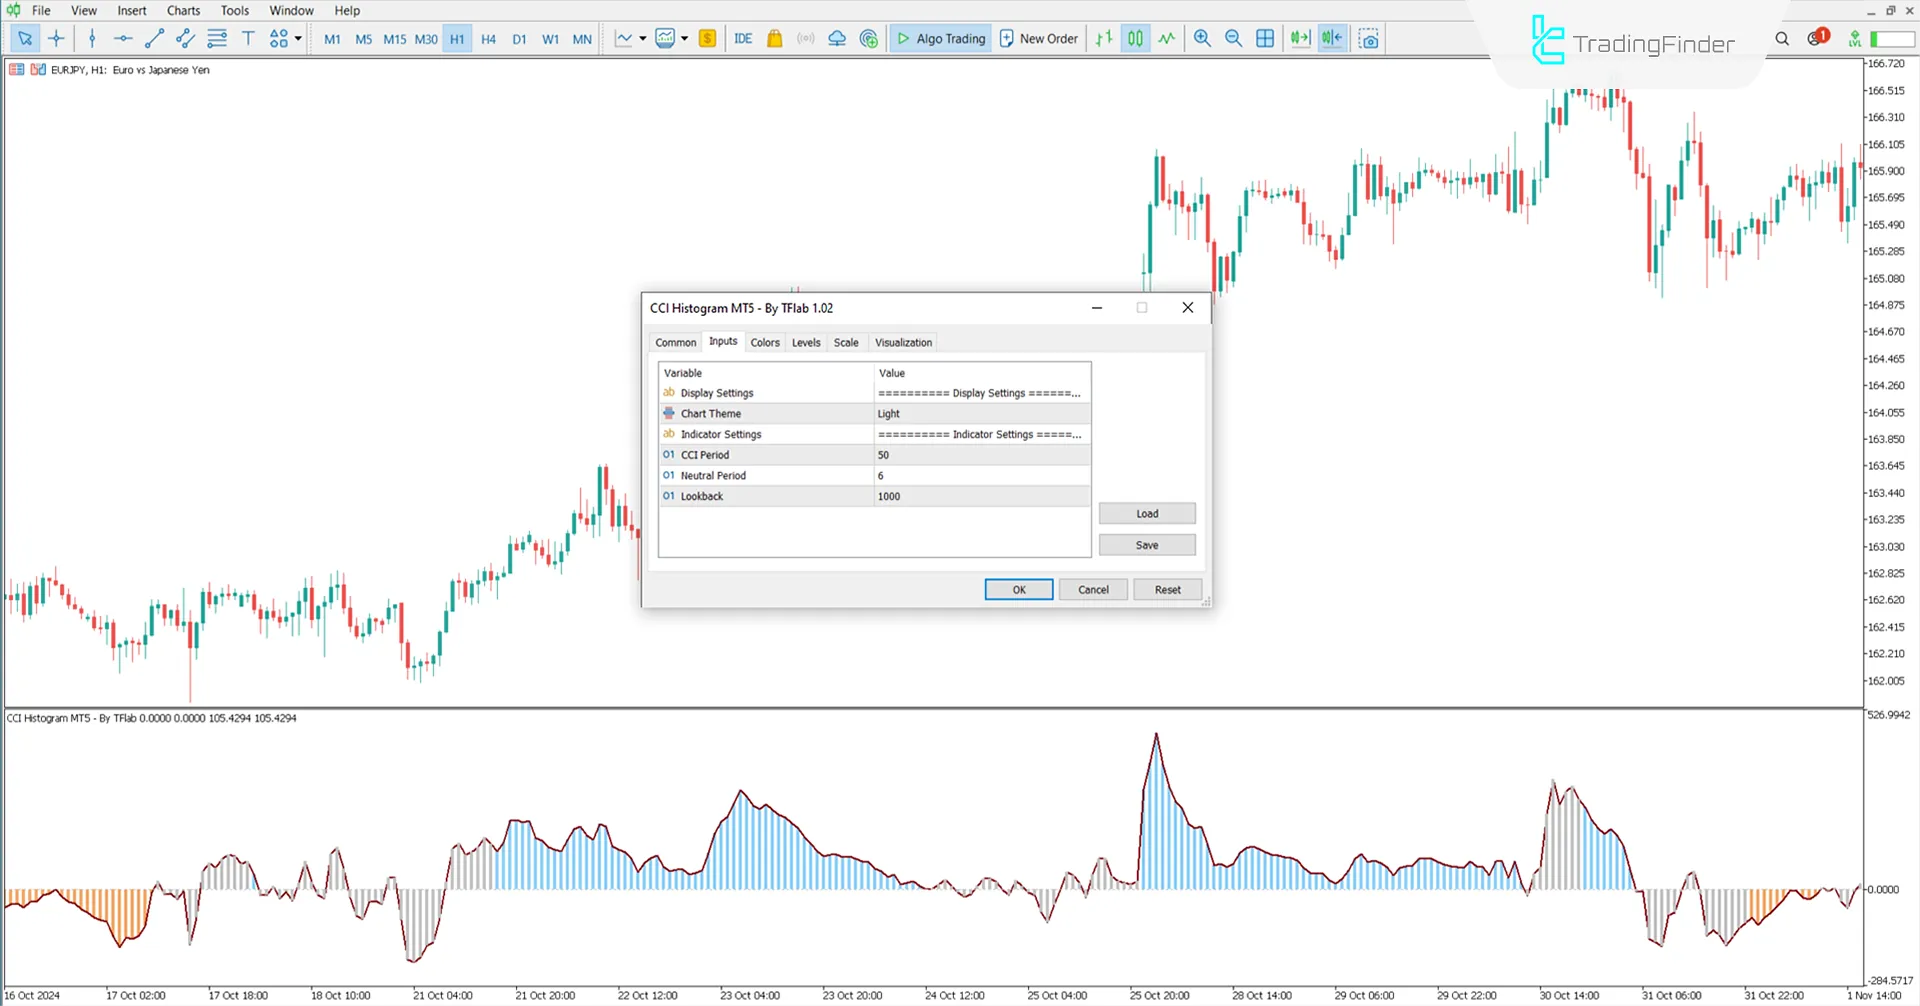
The following are the main adjustable parameters of the CCI Histogram MetaTrader 5 indicator:

- Chart theme: Theme of the chart;
- CCI period: The CCI calculation period;
- Neutral period: The neutral period;
- Lookback: The lookback period.
Conclusion
The CCI Histogram indicator, as an overbought and oversold, facilitates the identification of trend changes, overbought and oversold conditions, and trading signals by comparing the current price with historical averages.This indicator can be used across all timeframes and markets.
CCI Histogram indicator Meta MT5 PDF
CCI Histogram indicator Meta MT5 PDF
Click to download CCI Histogram indicator Meta MT5 PDFHow does the CCI Histogram indicator work?
It is a technical analysis tool that examines the difference between the current price and the average price over a specified period.


