![CISD - CSD + Price Gap Openings Indicator MT5 - Download - [TradingFinder]](https://cdn.tradingfinder.com/image/255522/13-78-en-cisd-csd-opening-gaps-mt5-01.webp)
![CISD - CSD + Price Gap Openings Indicator MT5 - Download - [TradingFinder] 0](https://cdn.tradingfinder.com/image/255522/13-78-en-cisd-csd-opening-gaps-mt5-01.webp)
![CISD - CSD + Price Gap Openings Indicator MT5 - Download - [TradingFinder] 1](https://cdn.tradingfinder.com/image/255517/13-78-en-cisd-csd-opening-gaps-mt5-02.webp)
![CISD - CSD + Price Gap Openings Indicator MT5 - Download - [TradingFinder] 2](https://cdn.tradingfinder.com/image/255516/13-78-en-cisd-csd-opening-gaps-mt5-03.webp)
![CISD - CSD + Price Gap Openings Indicator MT5 - Download - [TradingFinder] 3](https://cdn.tradingfinder.com/image/255519/13-78-en-cisd-csd-opening-gaps-mt5-04.webp)
The CISD – CSD + Price Gap Openings indicator uses purple boxes to show new daily price gap openings (NDOG). This MT5 Smart Money indicator identifies the "CISD" levels based on price delivery changes, marking them with colored arrows. The "CISD"levels generally indicate a shift in the direction of price movement.
CISD – CSD + Price Gap Openings Indicator Specifications Table
The table below outlines the specifications and features of the CISD – CSD + Price Gap Openings Indicator.
Indicator Categories: | Smart Money MT5 Indicators Signal & Forecast MT5 Indicators ICT MT5 Indicators |
Platforms: | MetaTrader 5 Indicators |
Trading Skills: | Advanced |
Indicator Types: | Reversal MT5 Indicators |
Timeframe: | Multi-Timeframe MT5 Indicators |
Trading Style: | Day Trading MT5 Indicators |
Trading Instruments: | Forex MT5 Indicators Crypto MT5 Indicators Stock MT5 Indicators |
CISD + Price Gap Openings Indicator Overview
Price Gap areas (OGs) are filled with liquidity, which causes prices to target them. This indicator marks these gaps with purple boxes, and if the validity of these areas is lost, the purple boxes no longer appear during the ongoing trend.
Uptrend Conditions
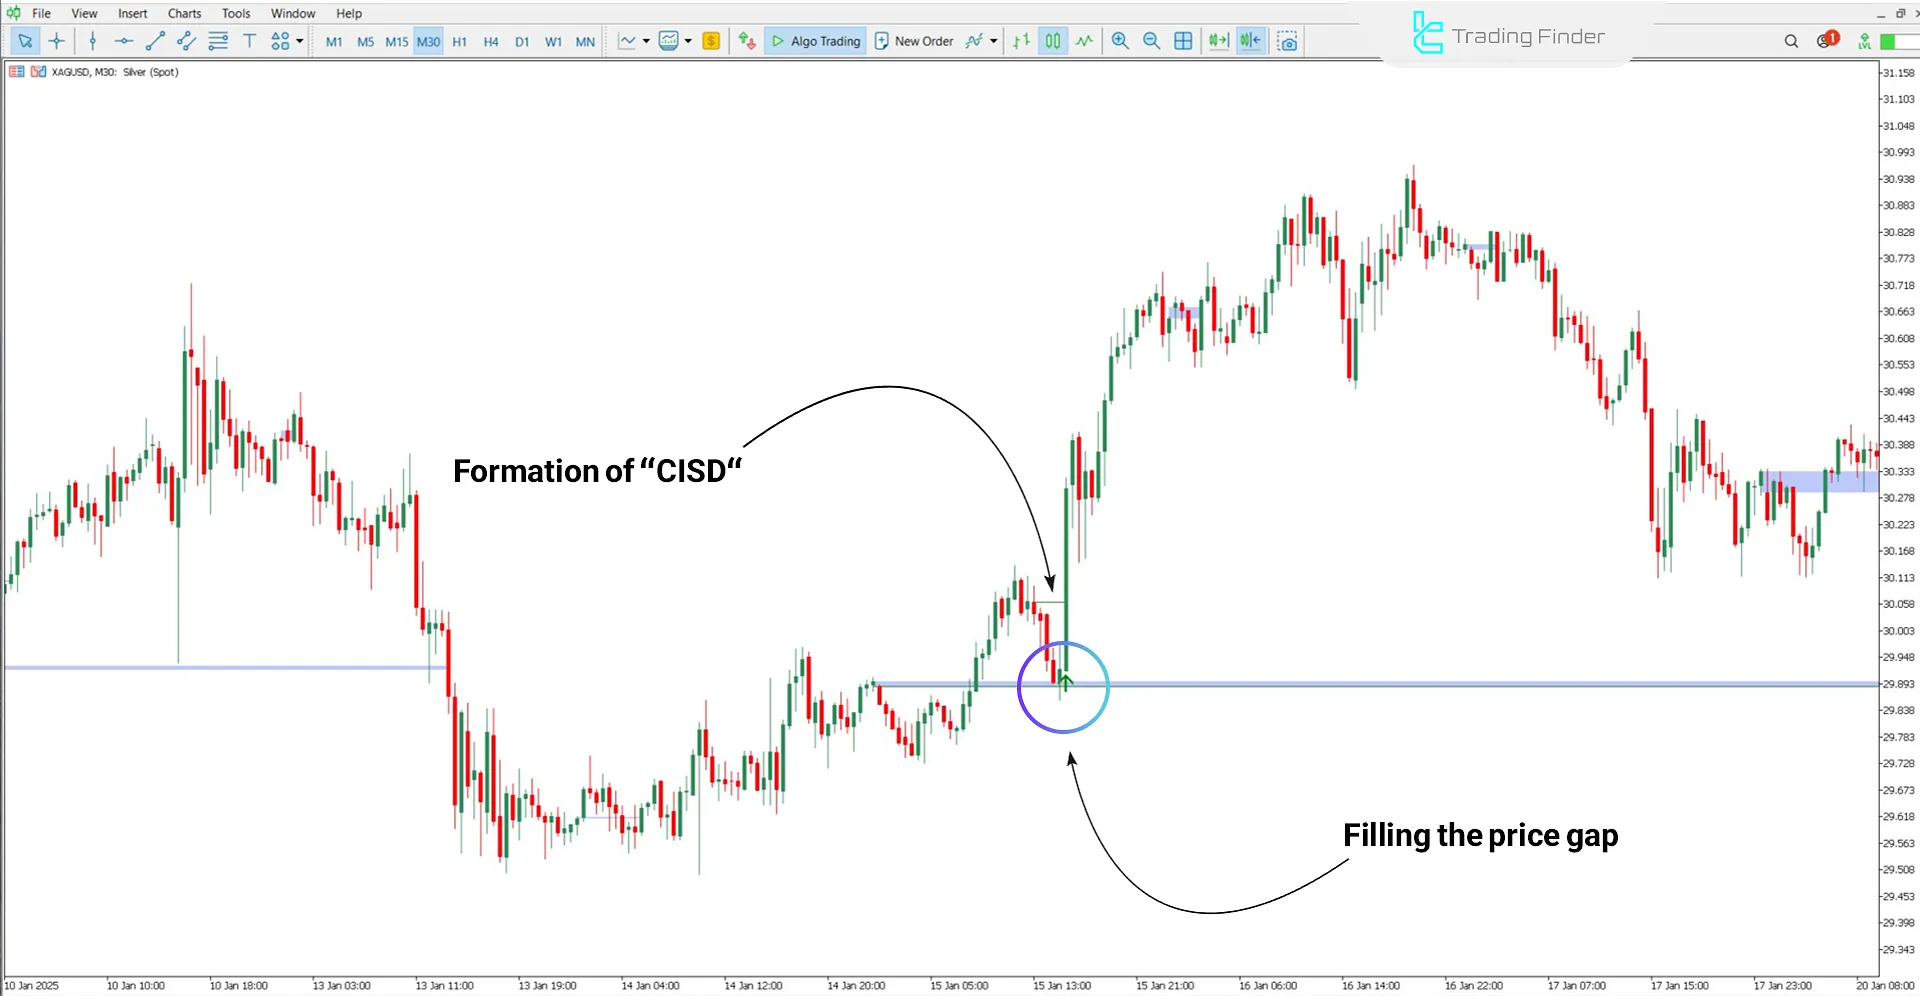
According to the 1-hour chart of Silver against the US Dollar (XAG/USD), the price fills the gap and then retraces upwards, closing a bullish candle above the first opposite colored candle.
The "CISD" level forms in this condition, and the indicator marks it with a green arrow.

Downtrend Conditions
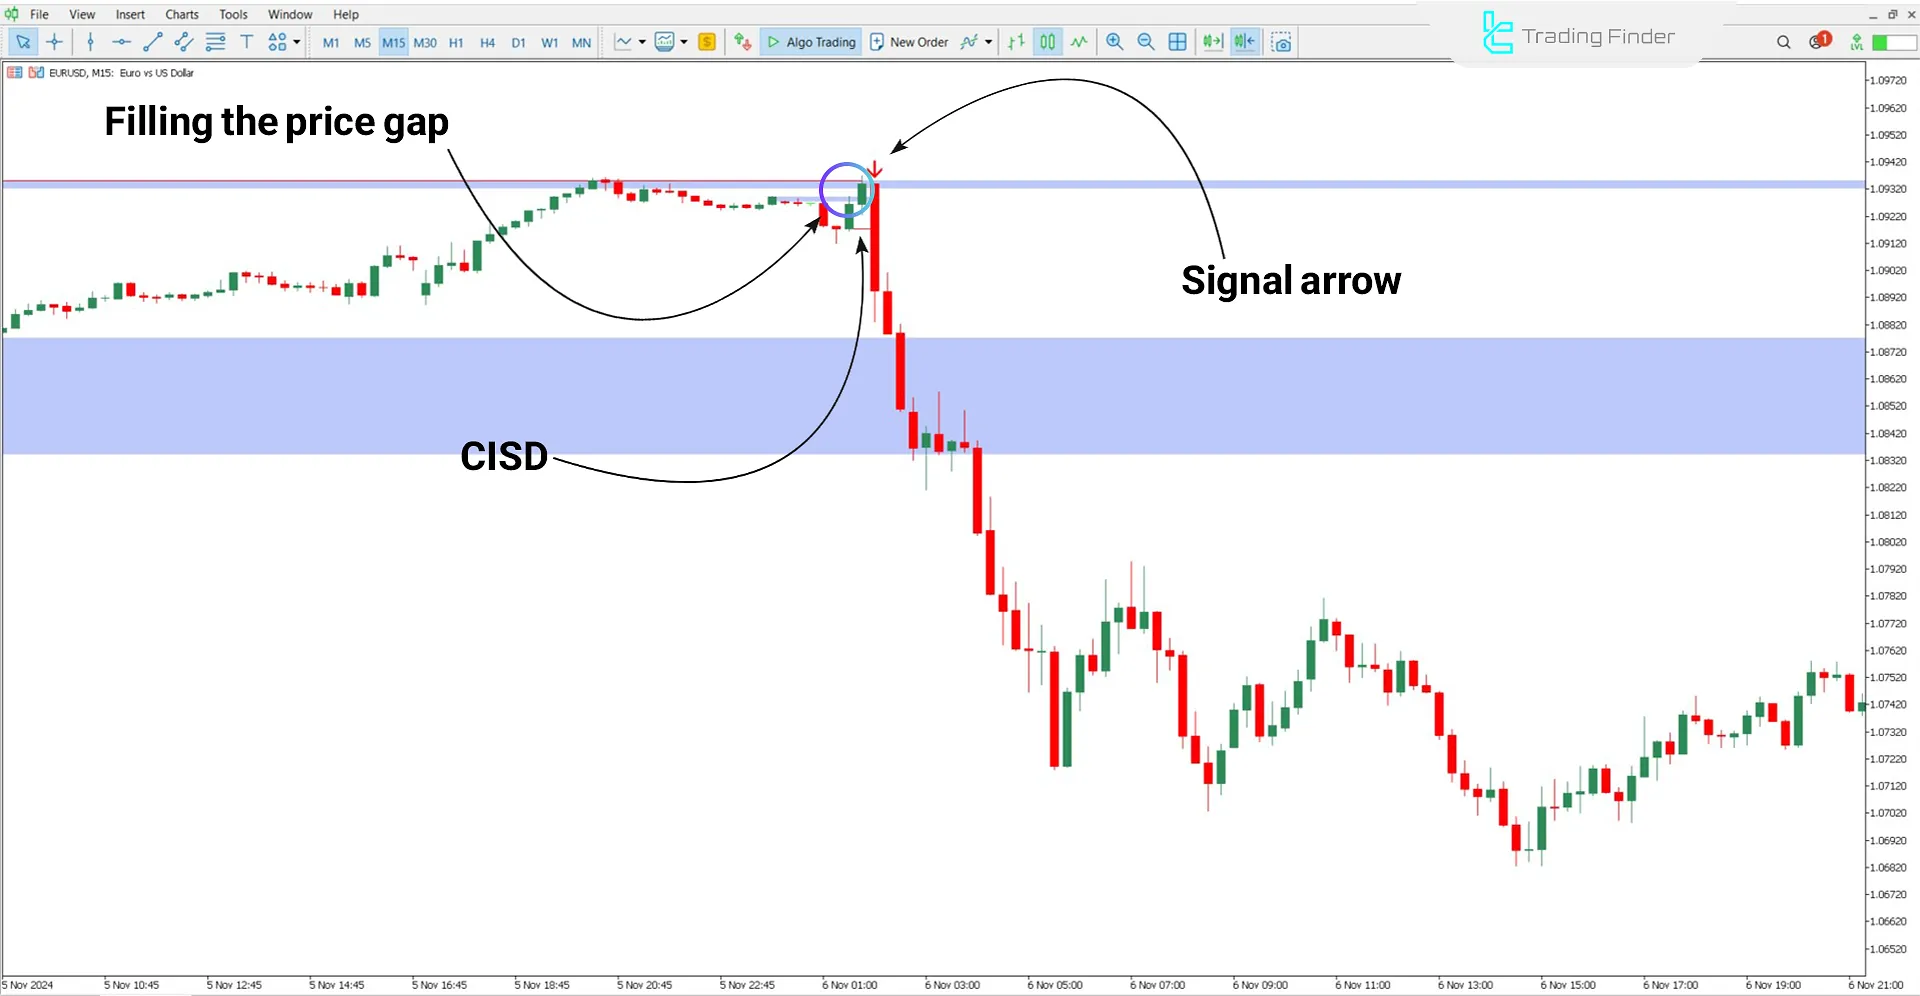
According to the 15-minute chart of the EUR/USD currency pair, the price begins its downward move after filling the price gap and closes a bearish candle lower than the first opposite colored candle.
The CISD level in the downtrend is marked with a red arrow.

CISD – CSD + OGs Indicator Settings
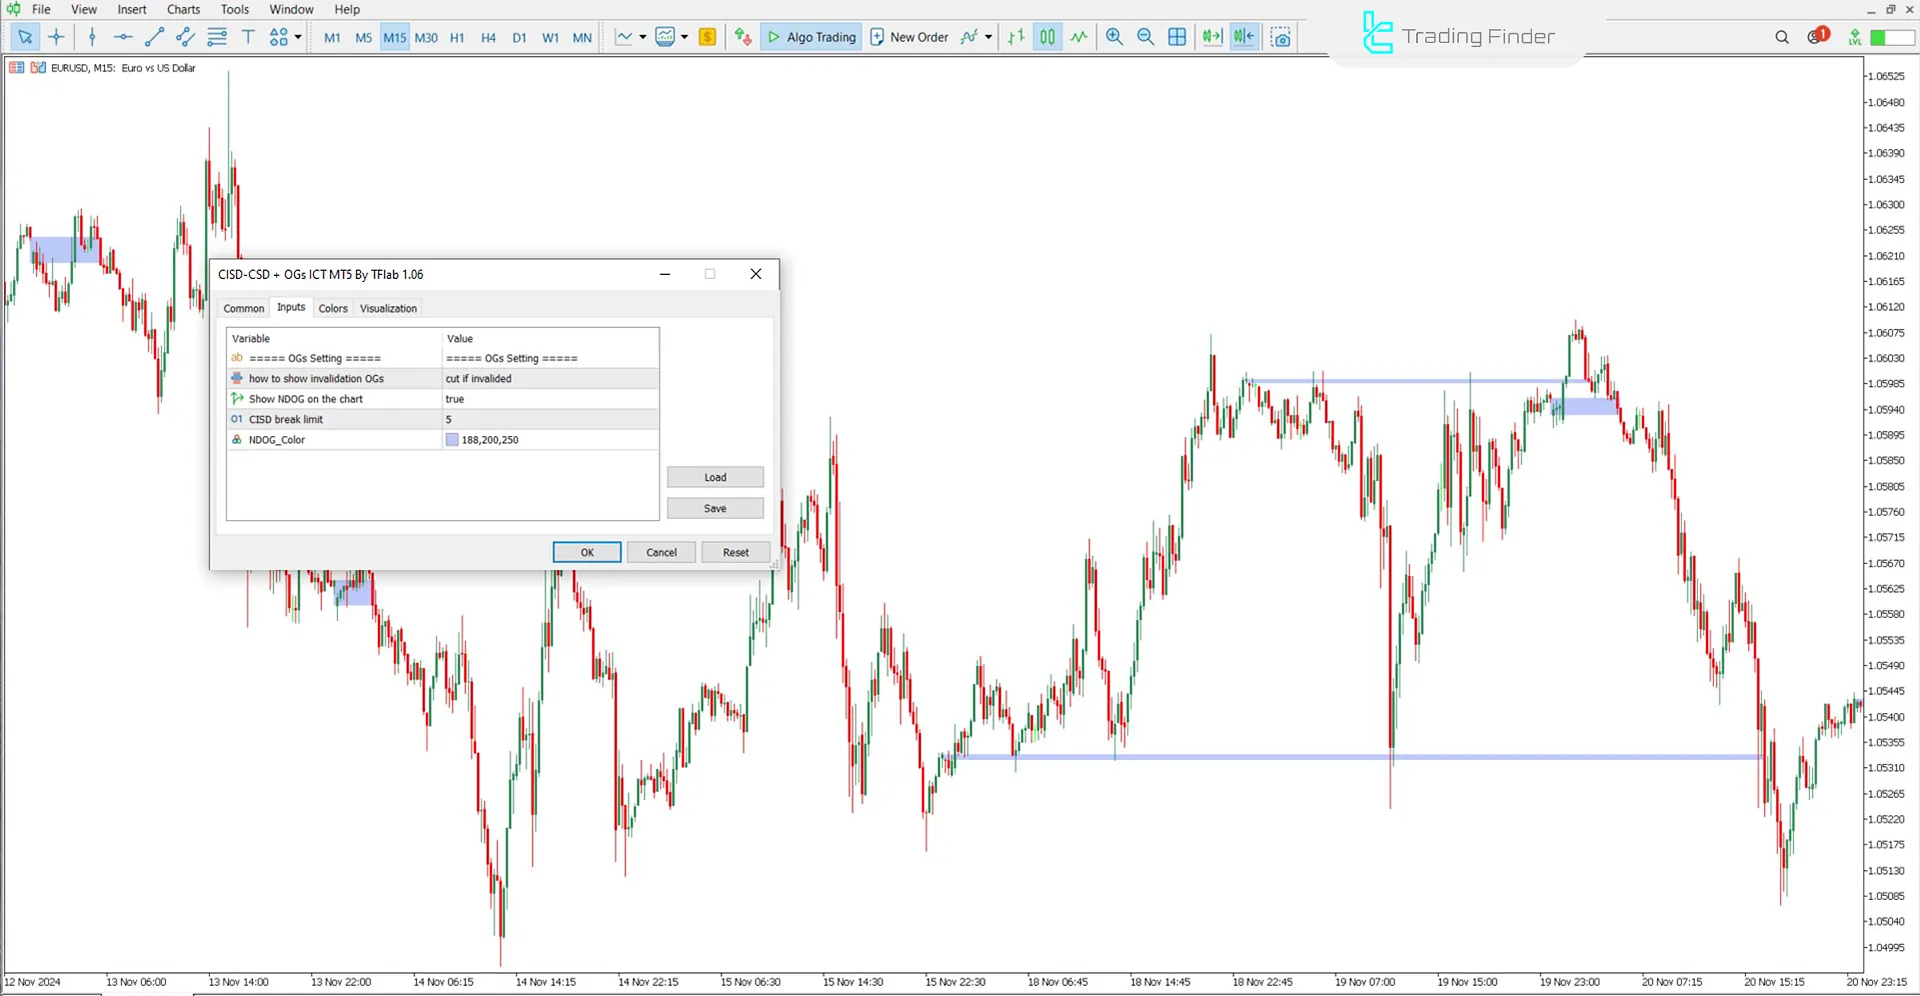
The settings for the CISD – CSD + Price Gap Openings indicator are shown in the image below:

- How to show invalidation OGs: How to display invalidated zones
- Show NDOG on the chart: Show daily price gaps
- CISD break limit: Set the maximum number of allowed breaks for the CISD level before invalidation
- NDOG Color: Set the color of the daily gap zones
Conclusion
The CISD – CSD + Price Gap Openings Indicator identifies the "CISD" levels based on filling daily price gaps. The "CISD" Change in the State of Delivery direction, facilitating the identification of trend reversal zones.
This MetaTrader 5 signal and forecasting indicator marks CISD levels and considers the arrow displays as trade entry signals.
CISD CSD Price Gap MT5 PDF
CISD CSD Price Gap MT5 PDF
Click to download CISD CSD Price Gap MT5 PDFIs this indicator suitable for use in cryptocurrency markets?
Yes, this indicator is applicable and can be used in all markets.
Can the color of the daily price gap areas be changed?
Yes, users can change the color of the zones in the settings section using the "NDOG Color" option.


