


On July 1, 2025, in version 2, alert/notification and signal functionality was added to this indicator
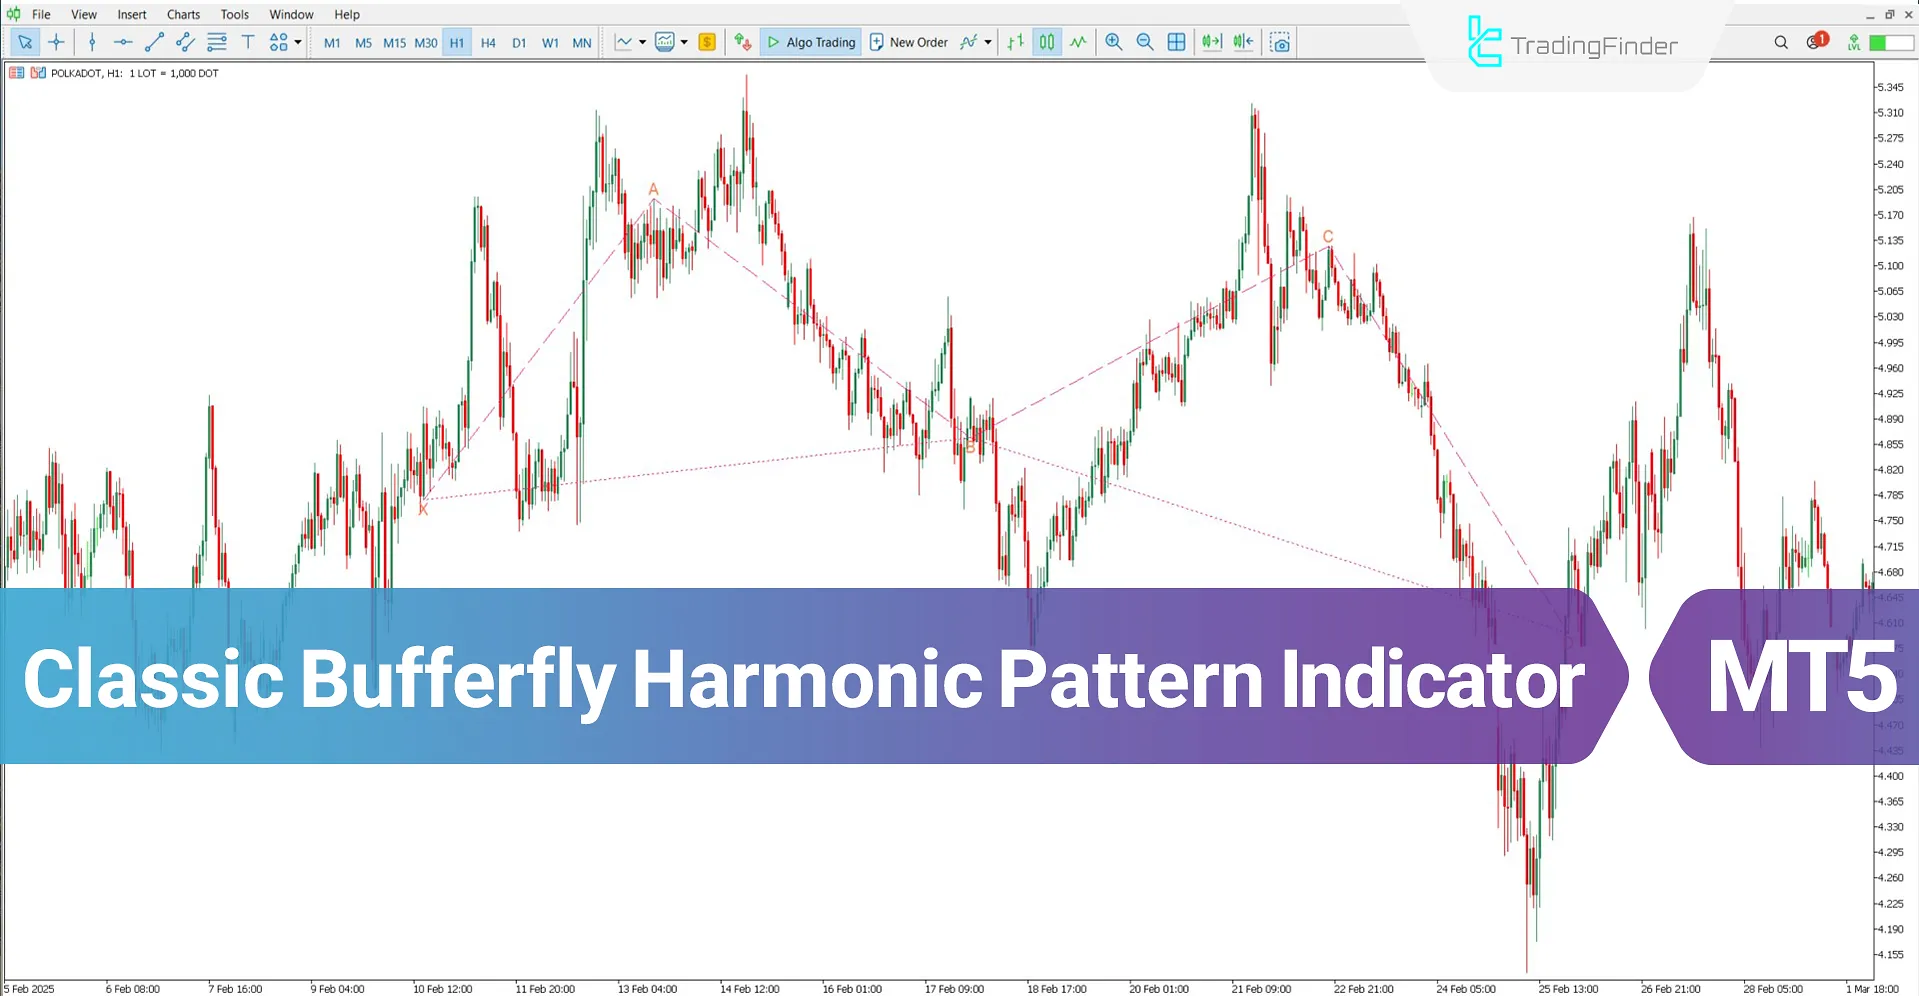
The Classic Butterfly Harmonic Pattern Indicator plots the butterfly pattern structures to identify potential price reversal zones. This pattern's distinctive feature is the extension of point "D" beyond the starting point "X," setting it apart from other harmonic patterns.
The appearance of this pattern often signals the end of the current market move and the beginning of a new price phase. This trading tool displays bullish patterns in pink and bearish patterns in blue for better clarity.
Classic Butterfly Harmonic Pattern Indicator Specification Table
The specifications of the Classic Butterfly Harmonic Pattern Indicator are provided in the table below:
Indicator Categories: | Chart & Classic MT5 Indicators Harmonic MT5 Indicators Candle Sticks MT5 Indicators |
Platforms: | MetaTrader 5 Indicators |
Trading Skills: | Intermediate |
Indicator Types: | Reversal MT5 Indicators |
Timeframe: | Multi-Timeframe MT5 Indicators |
Trading Style: | Intraday MT5 Indicators |
Trading Instruments: | Forex MT5 Indicators Crypto MT5 Indicators Stock MT5 Indicators Commodity MT5 Indicators Indices MT5 Indicators Share Stock MT5 Indicators |
Classic Butterfly Harmonic Pattern Indicator at a Glance
This indicator draws butterfly harmonic patterns based on specific Fibonacci ratios:
- Wave AB: 78.6% Fibonacci retracement of wave XA
- Wave BC: 38.2% to 88.6% Fibonacci retracement of wave AB
- Wave CD: 127.2% or 161.8% Fibonacci extension of wave XA
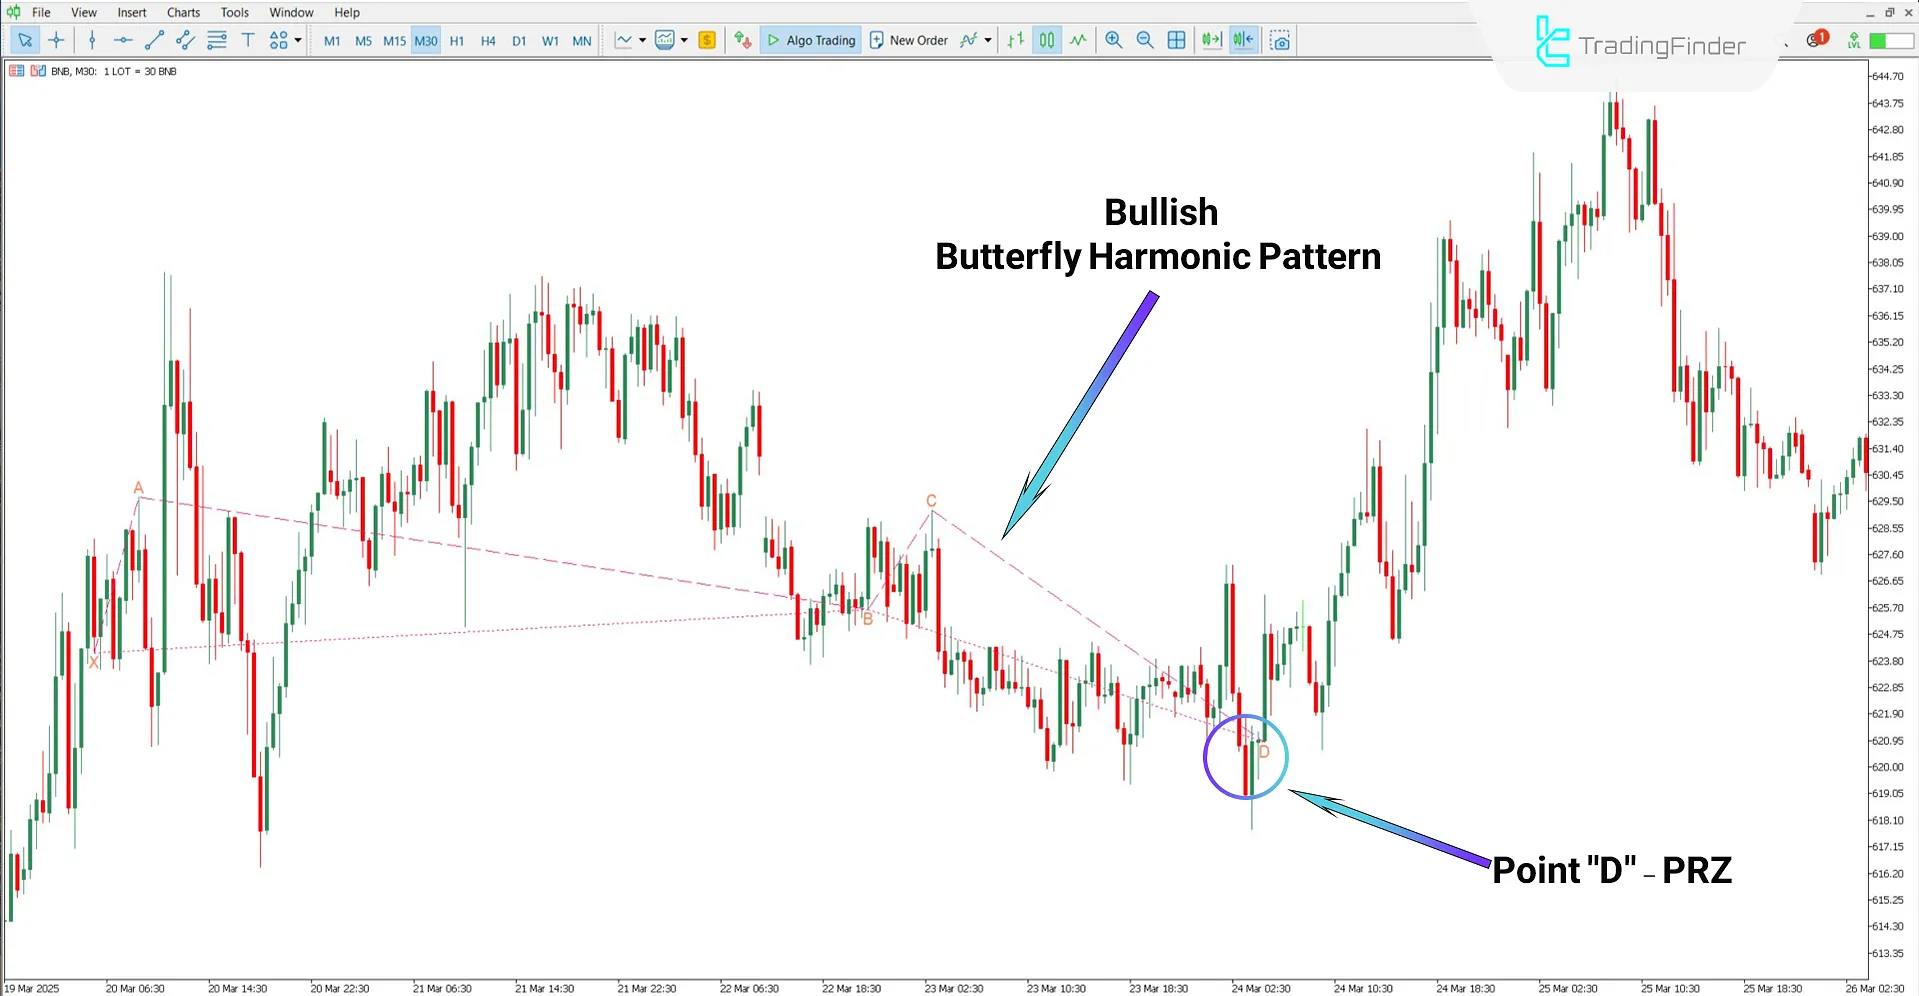
Bullish Trend Conditions
Based on Binance Coin's (BNB) 30-minute chart, a bullish butterfly harmonic pattern resembling the letter "M" in pink is drawn.
As shown, once the pattern completes at point "D," the price reverses, presenting a buy-entry opportunity.
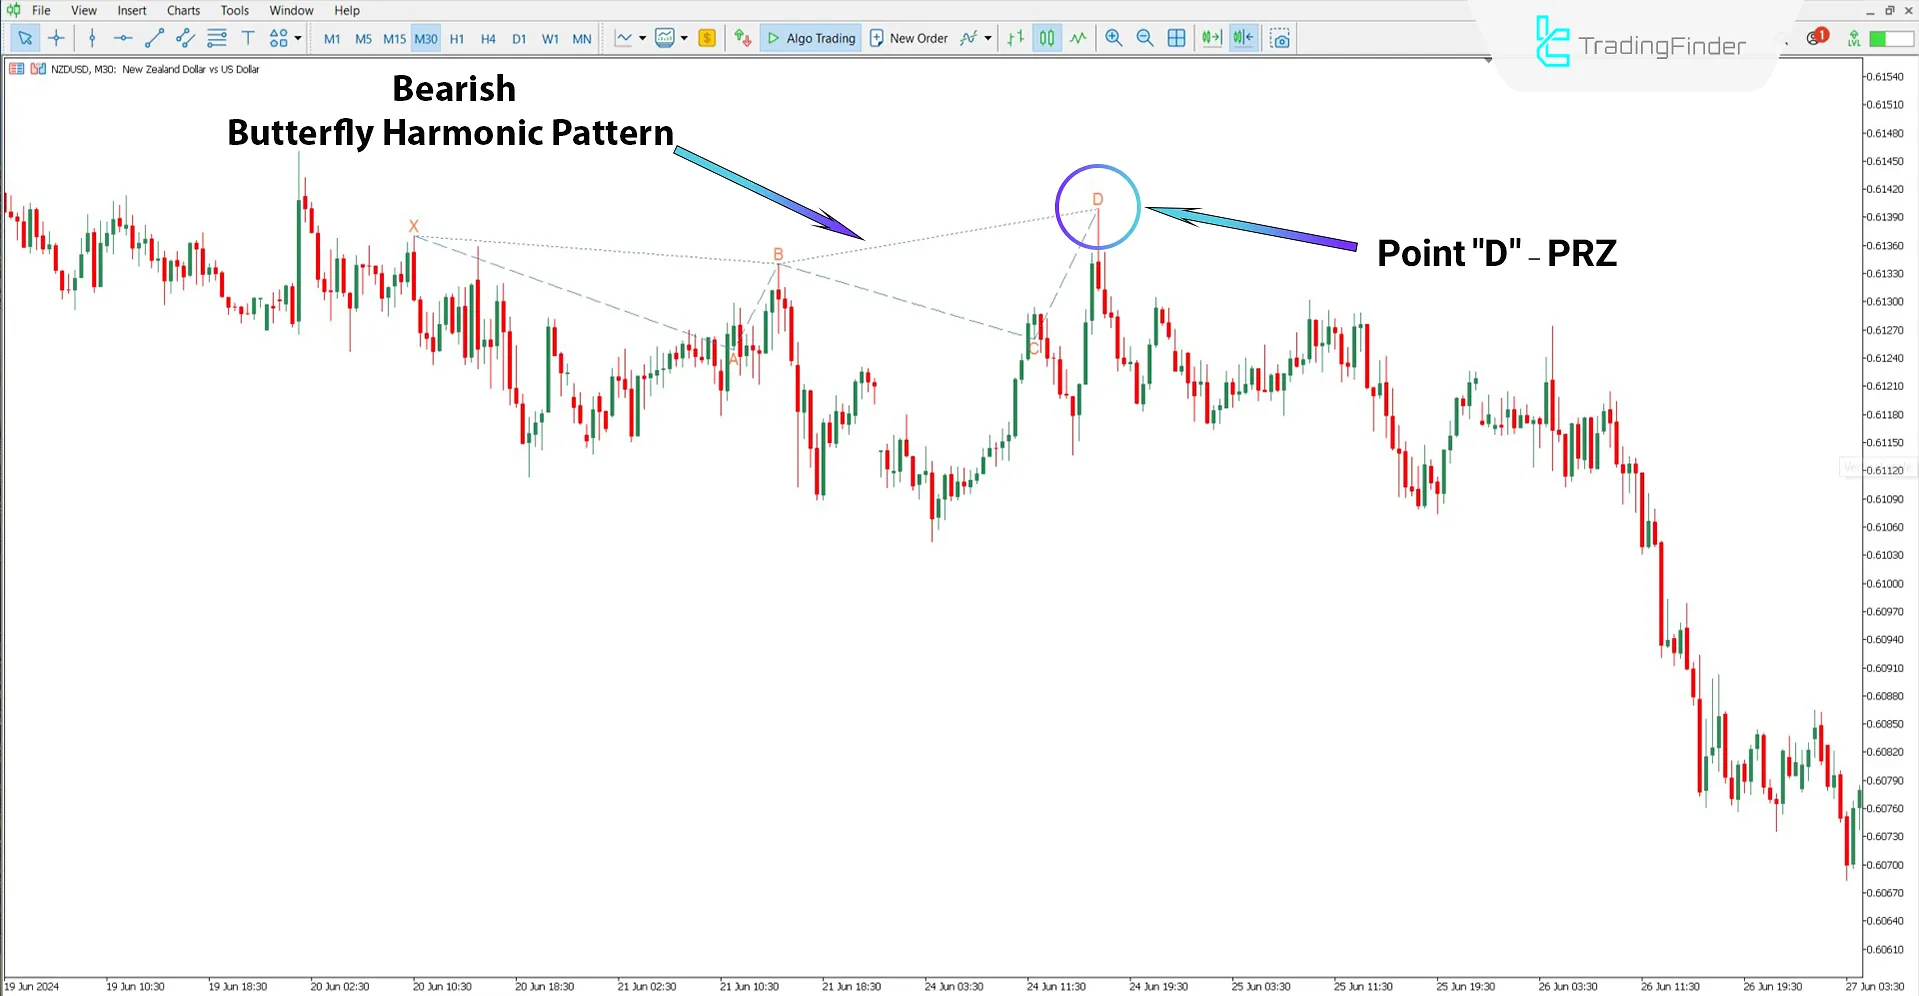
Bearish Trend Conditions
According to the 30-minute chart of NZD/USD, upon detecting a bearish butterfly pattern, the indicator plots a "W" shaped structure in blue.
In such conditions, the market typically shows signs of a trend reversal, and point "D" often becomes a suitable sell entry point.
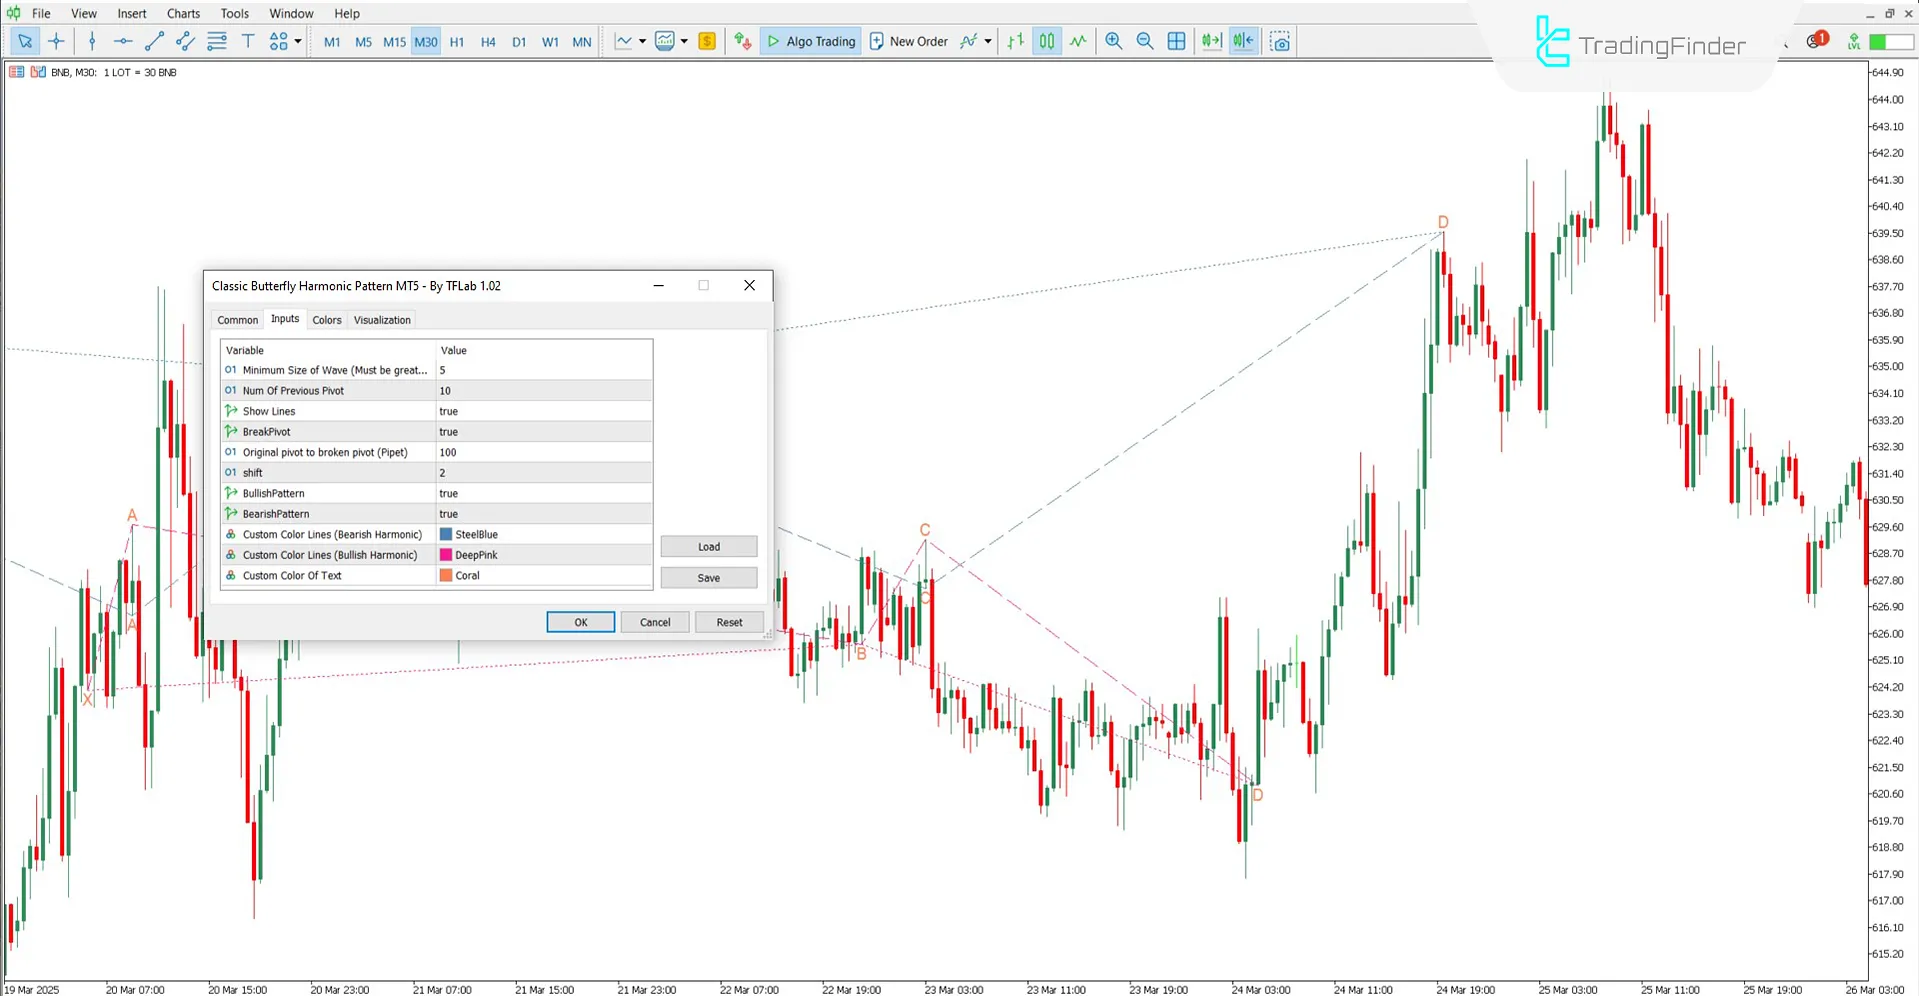
Classic Butterfly Harmonic Pattern Indicator Settings
The image below shows the customizable settings of the Classic Butterfly Harmonic Pattern Indicator on MetaTrader 5:
- Minimum Length of Wave (candle): Minimum number of candles for wave formation
- Num of Previous Candle: Number of previous candles for wave detection
- Show Lines: Toggle to display pattern lines
- Break Pivot: Toggle to show/hide broken pivot lines on the chart
- Original pivot to broken pivot (Pipet): Maximum allowed distance between original and broken pivot
- Shift: Move pattern lines forward/backward on the chart
- Bullish Pattern: Enable bullish pattern display
- Bearish Pattern: Enable bearish pattern display
- Custom Color Lines (Bearish Harmonic): Set custom line color for bearish patterns
- Custom Color Lines (Bullish Harmonic): Set custom line color for bullish patterns
- Custom Color of Text: Set text and label color
Conclusion
The Classic Butterfly Harmonic Pattern Indicator is a powerful tool for identifying price reversal zones in strong market trends.
This trading tool facilitates accurate trend analysis and helps identify optimal trade entry points by precisely analyzing the (XABCD) structure and marking the Potential Reversal Zone (PRZ).
Classic Butterfly Harmonic Pattern MT5 PDF
Classic Butterfly Harmonic Pattern MT5 PDF
Click to download Classic Butterfly Harmonic Pattern MT5 PDFWhat is the significance of point D in this pattern?
Point D is considered a key reversal area and often the trade entry point.
Where should point D be located in the butterfly pattern?
Point D typically lies beyond point X, at the 127.2% or 161.8% Fibonacci extension of wave XA.


