


On July 1, 2025, in version 2, alert/notification and signal functionality was added to this indicator
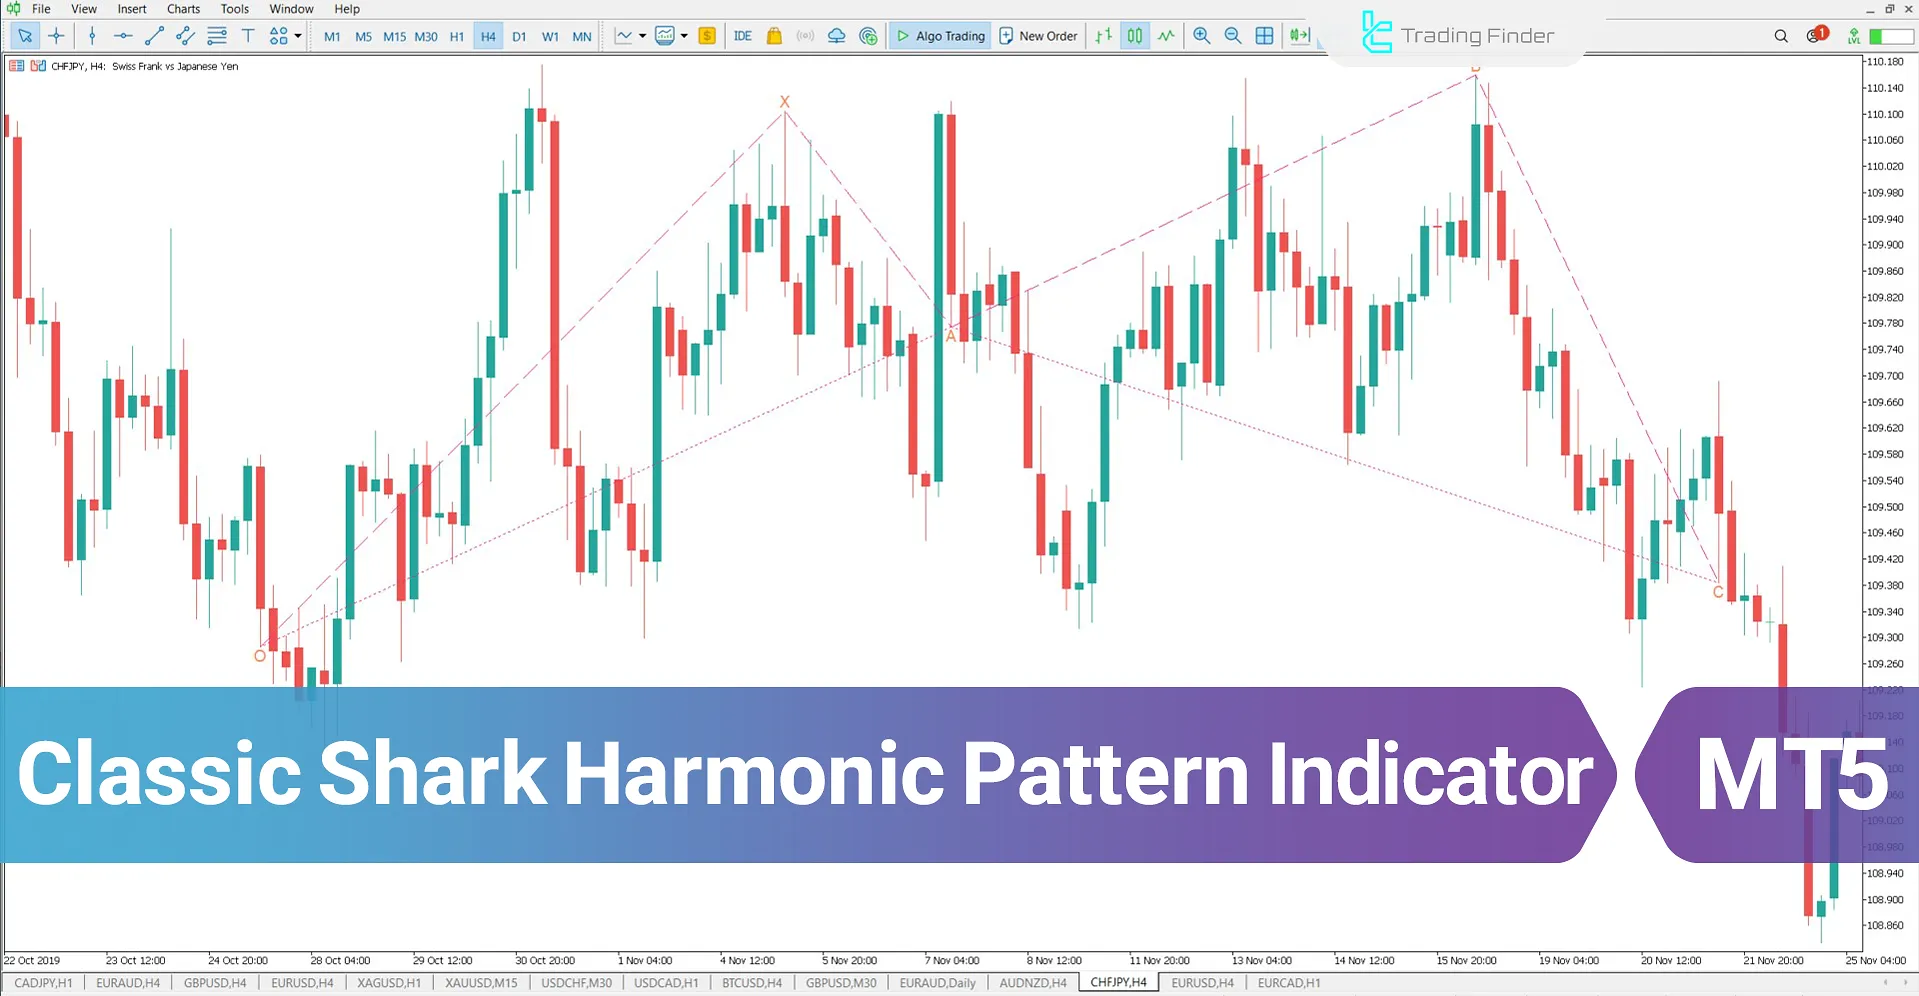
The Classic Shark Harmonic Pattern Indicator is based on specific Fibonacci ratios, such as 88.6%, 113%, and 161.8%. This indicator identifies the geometric structure of the pattern, and when the conditions align, it automatically draws the Shark Pattern on the chart and highlights the Potential Reversal Zone (PRZ).
Classic Shark Harmonic Pattern Indicator Table
The features of the Classic Shark Harmonic Pattern Indicator are summarized in the table below.
Indicator Categories: | Support & Resistance MT5 Indicators Chart & Classic MT5 Indicators Harmonic MT5 Indicators |
Platforms: | MetaTrader 5 Indicators |
Trading Skills: | Elementary |
Indicator Types: | Reversal MT5 Indicators |
Timeframe: | Multi-Timeframe MT5 Indicators |
Trading Style: | Day Trading MT5 Indicators |
Trading Instruments: | Forex MT5 Indicators Crypto MT5 Indicators Stock MT5 Indicators Forward MT5 Indicators Share Stock MT5 Indicators |
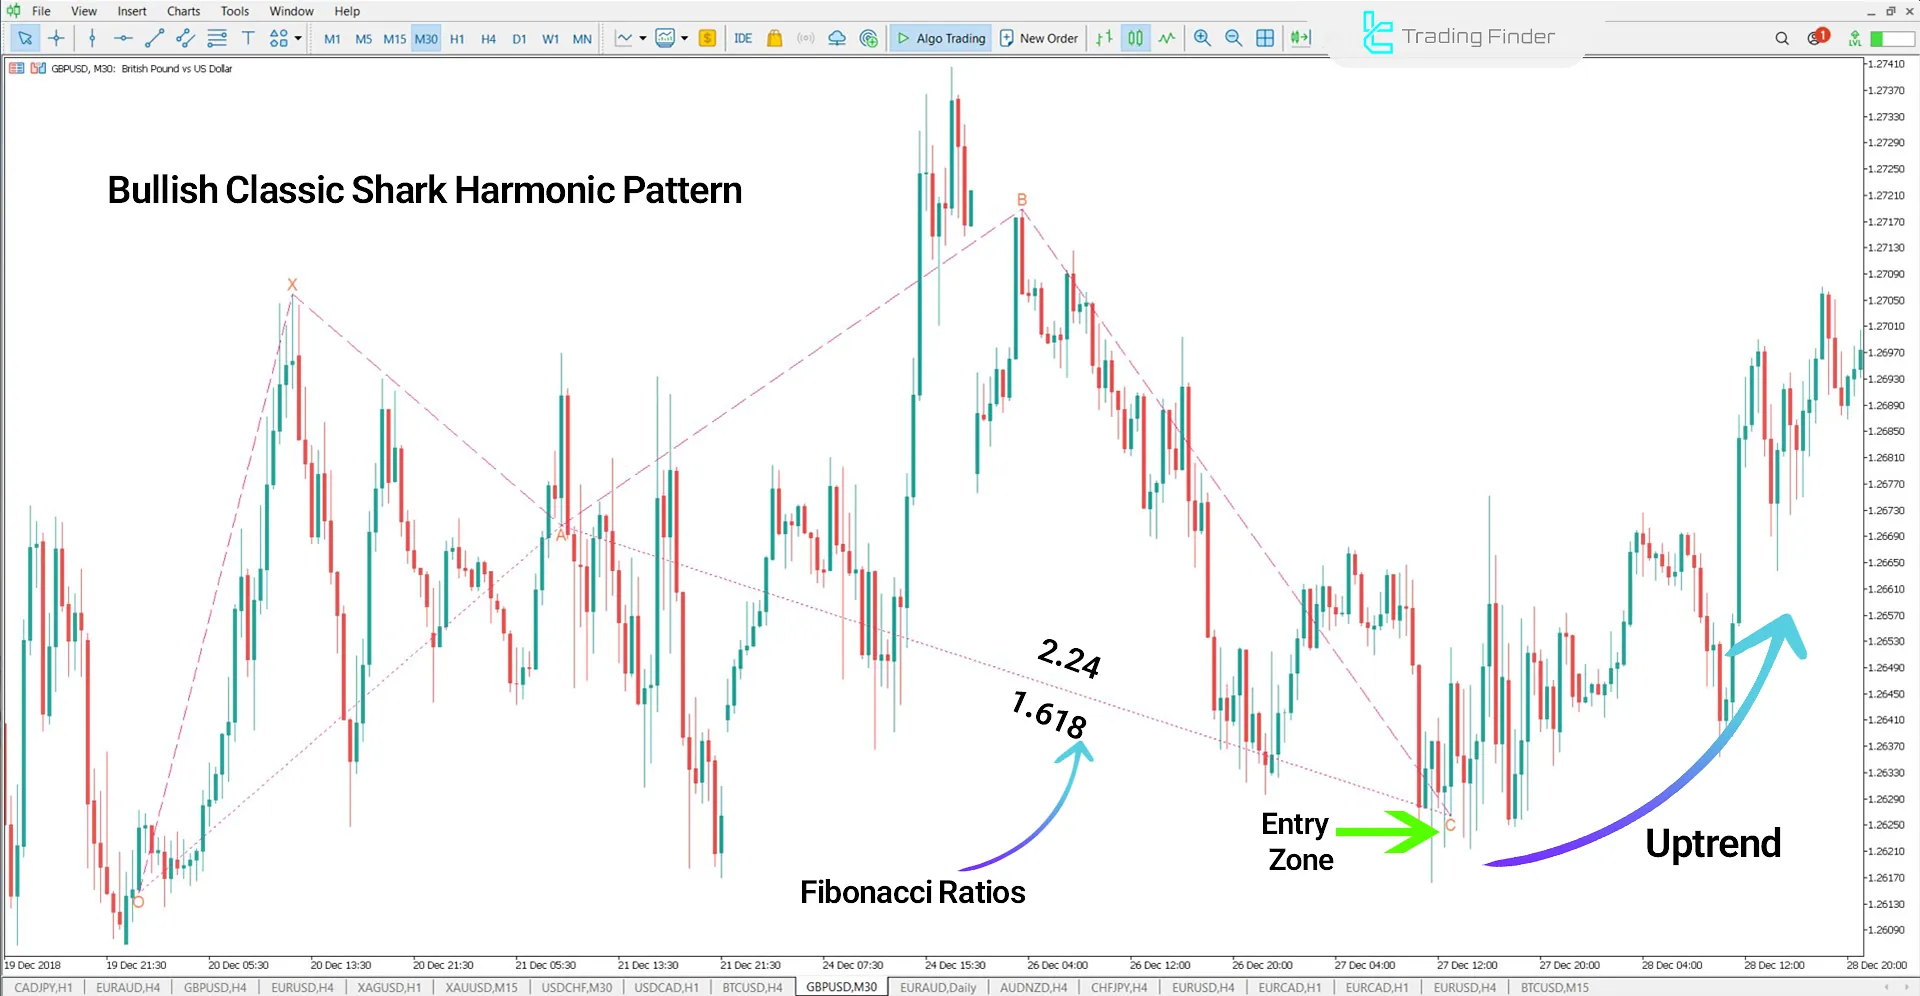
Indicator in an Uptrend
The chart below shows the GBP/USD pair in the Classic Shark Harmonic Pattern in an uptrend.
In this chart, after forming the O, X, A, and B points, the price reaches the C zone, completing the pattern in the Fibonacci range of 0.886 to 1.13 of the O-X wave. Price reaction at this level and the reversal candlestick indicate a potential new uptrend in the market.
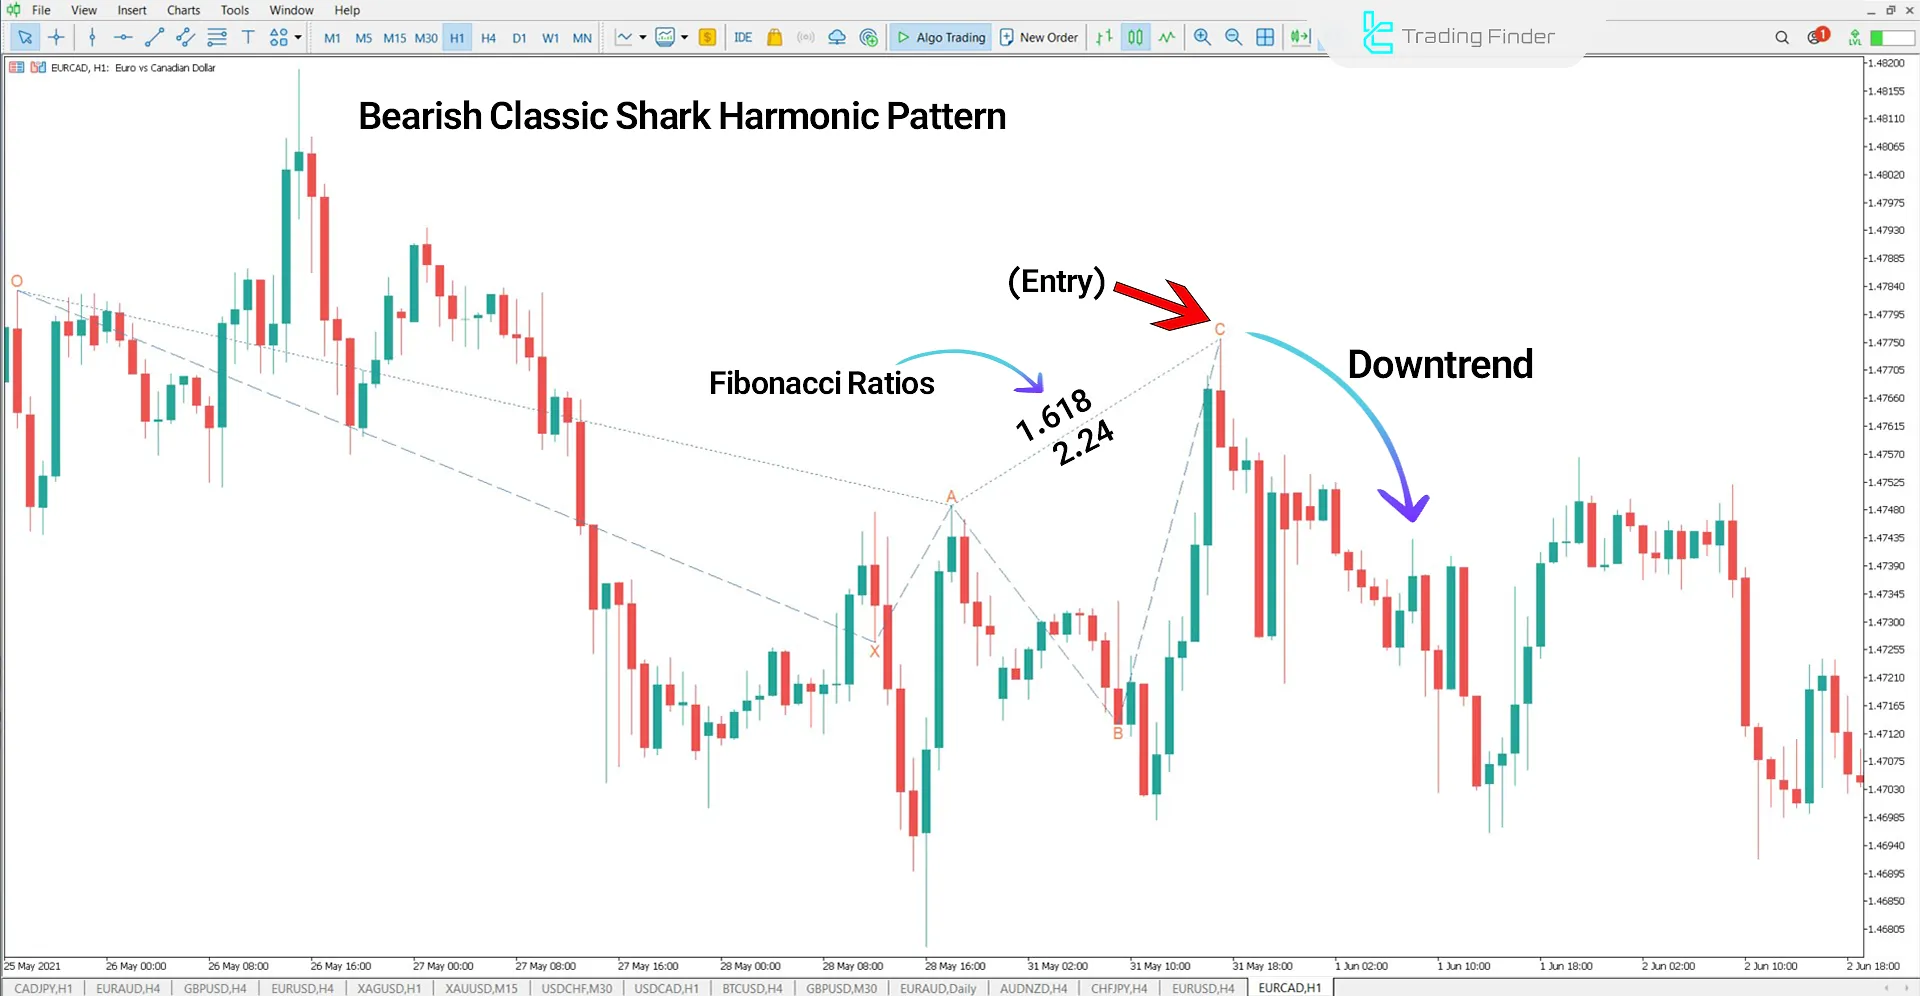
Indicator in a Downtrend
The chart below shows the EUR/CAD pair completing the Classic Shark Harmonic Pattern in a downtrend. After an initial price rise and completion of the O to B waves, the market enters a sensitive zone near point C. In this zone, Fibonacci levels between 0.886 and 1.13 of the O-X wave are present.
Placing this level in the overbought zone, combined with weakening trend candlesticks, strengthens the likelihood of a price reversal and the beginning of a downtrend.
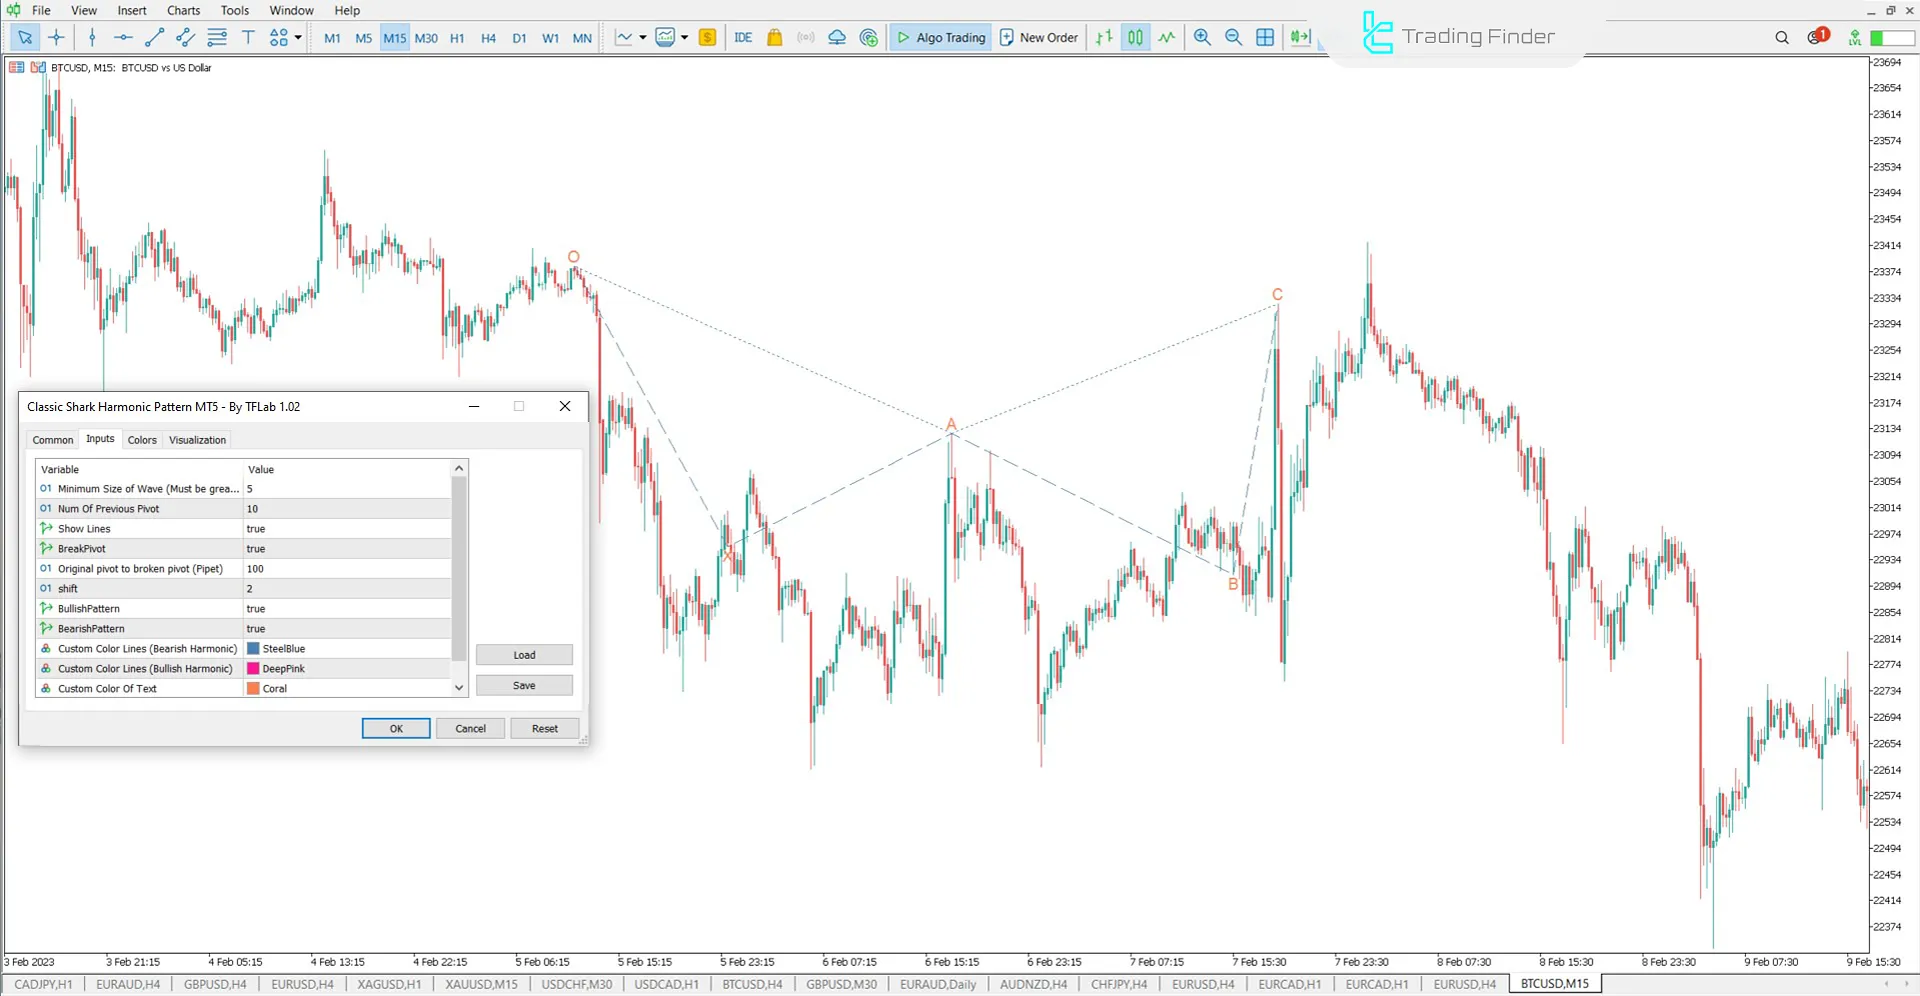
Classic Shark Harmonic Pattern Indicator Settings
The settings section of the Classic Shark Harmonic Pattern Indicator is shown in the image below:
- Minimum Length of Wave (candle): Minimum wavelength in terms of the number of candles
- Num Of Previous Candle: Number of previous candles for analysis
- Show Lines: Display or hide the pattern lines
- BreakPivot: Check for pivot break
- Original Pivot to Broken Pivot (Pipet): Distance between the original pivot and the broken pivot in pips
- Shift: Amount of data shift on the chart
- BullishPattern: Identify bullish harmonic patterns
- BearishPattern: Identify bearish harmonic patterns
- Style Of Line: Set the style of the lines on the chart
- Width Of Line: Set the thickness of the displayed lines
- Custom Color Lines (Bearish Harmonic): Change the color of bearish pattern lines
- Custom Color Lines (Bullish Harmonic): Change the color of bullish pattern lines
- Custom Color Of Text: Set the color of the displayed text
Conclusion
The Classic Shark Harmonic Pattern Indicator is a powerful tool for identifying price reversals at critical market levels.
This MT5 classic chart pattern indicator automatically plots the Shark pattern on the chart using specific Fibonacci ratios such as 88.6%, 113%, and 161.8%, and identifies the Potential Reversal Zone (PRZ).
Classic Shark Harmonic Pattern MT5 PDF
Classic Shark Harmonic Pattern MT5 PDF
Click to download Classic Shark Harmonic Pattern MT5 PDFWhat is the difference between this indicator and other harmonic indicators?
The Shark Harmonic Pattern Indicator is designed based on ratios like 88.6% and 113%, distinguishing it from other harmonic patterns. Its starting point is from O to X, giving it a unique structure compared to patterns like Bat or Gartley.
Which markets is this indicator suitable for?
This indicator can be used in all financial markets, such as Forex, cryptocurrencies, stocks, and commodities, and it works accurately across all timeframes.


