![Complete Stochastic Indicator for MT5 Download - Free - [TFlab]](https://cdn.tradingfinder.com/image/154343/4-20-en-complete-stochastic-mt5-1.webp)
![Complete Stochastic Indicator for MT5 Download - Free - [TFlab] 0](https://cdn.tradingfinder.com/image/154343/4-20-en-complete-stochastic-mt5-1.webp)
![Complete Stochastic Indicator for MT5 Download - Free - [TFlab] 1](https://cdn.tradingfinder.com/image/154311/4-20-en-complete-stochastic-mt5-2.webp)
![Complete Stochastic Indicator for MT5 Download - Free - [TFlab] 2](https://cdn.tradingfinder.com/image/154310/4-20-en-complete-stochastic-mt5-3.webp)
![Complete Stochastic Indicator for MT5 Download - Free - [TFlab] 3](https://cdn.tradingfinder.com/image/154313/4-20-en-complete-stochastic-mt5-4.webp)
The "Complete Stochastic" indicator is one of the most widely used tools in MetaTrader 5 indicators, helping analysts evaluate price changes on the chart and identify reversal points as well as overbought (Buy) and oversold (Sell) conditions.
This indicator is an advanced version of the simple stochastic, oscillating between levels 0 and 100, and incorporates a combination of K, D, and K Slow lines.
Indicator Table
Indicator Categories: | Price Action MT5 Indicators Oscillators MT5 Indicators Levels MT5 Indicators |
Platforms: | MetaTrader 5 Indicators |
Trading Skills: | Intermediate |
Indicator Types: | Reversal MT5 Indicators |
Timeframe: | Multi-Timeframe MT5 Indicators |
Trading Style: | Intraday MT5 Indicators |
Trading Instruments: | Forex MT5 Indicators Crypto MT5 Indicators Stock MT5 Indicators Forward MT5 Indicators Share Stock MT5 Indicators |
Indicator at a Glance
The blue %K line represents price momentum and is the fastest among the three lines. The green %D line displays the moving average of %K, serving as a measure to reduce fluctuations.
The final line, called K Slow and represented in orange, is a smoothed version of the %K line, often referred to as the "slow line".
Indicator in an Uptrend
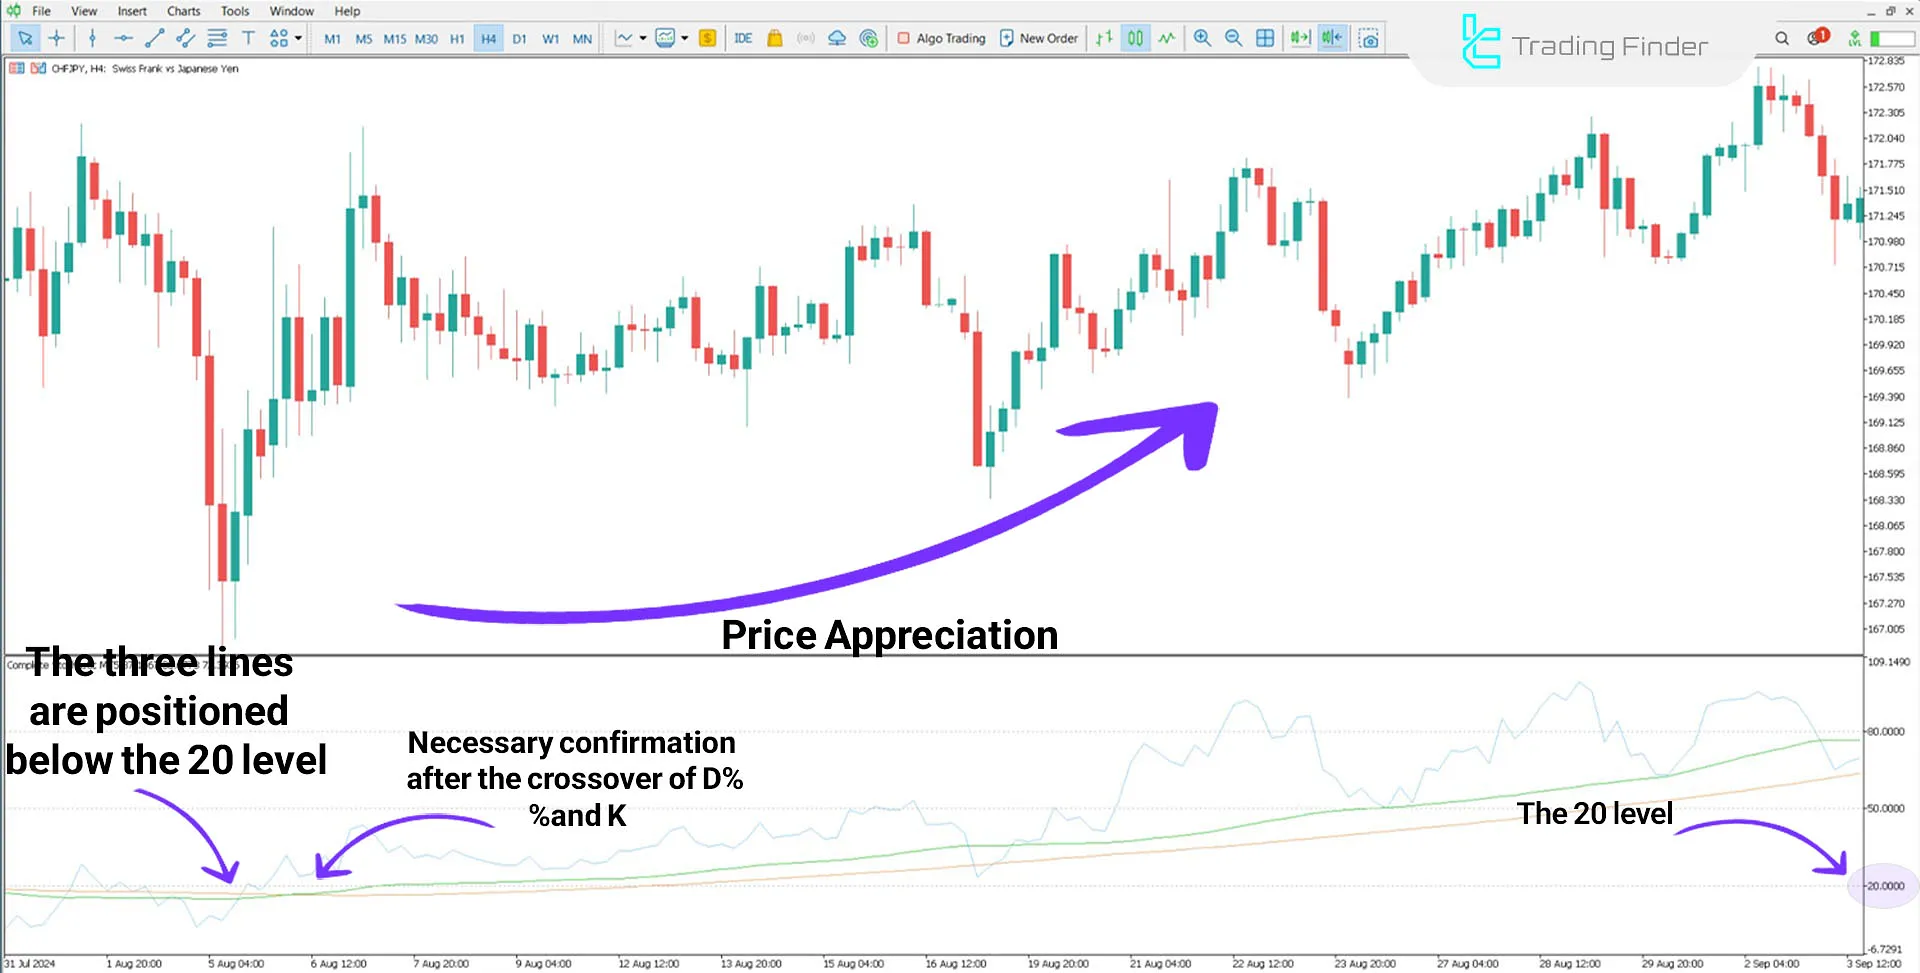
In an uptrend, prices initially decline continuously, forming lower lows. The chart below shows the Swiss Franc to Japanese Yen pair (CHF/JPY).
Here, the%K and %D lines are located near or below the 20 level (oversold condition). If the %D line crosses above the K Slow line from below, it may signal the beginning of an uptrend.

Indicator in a Downtrend
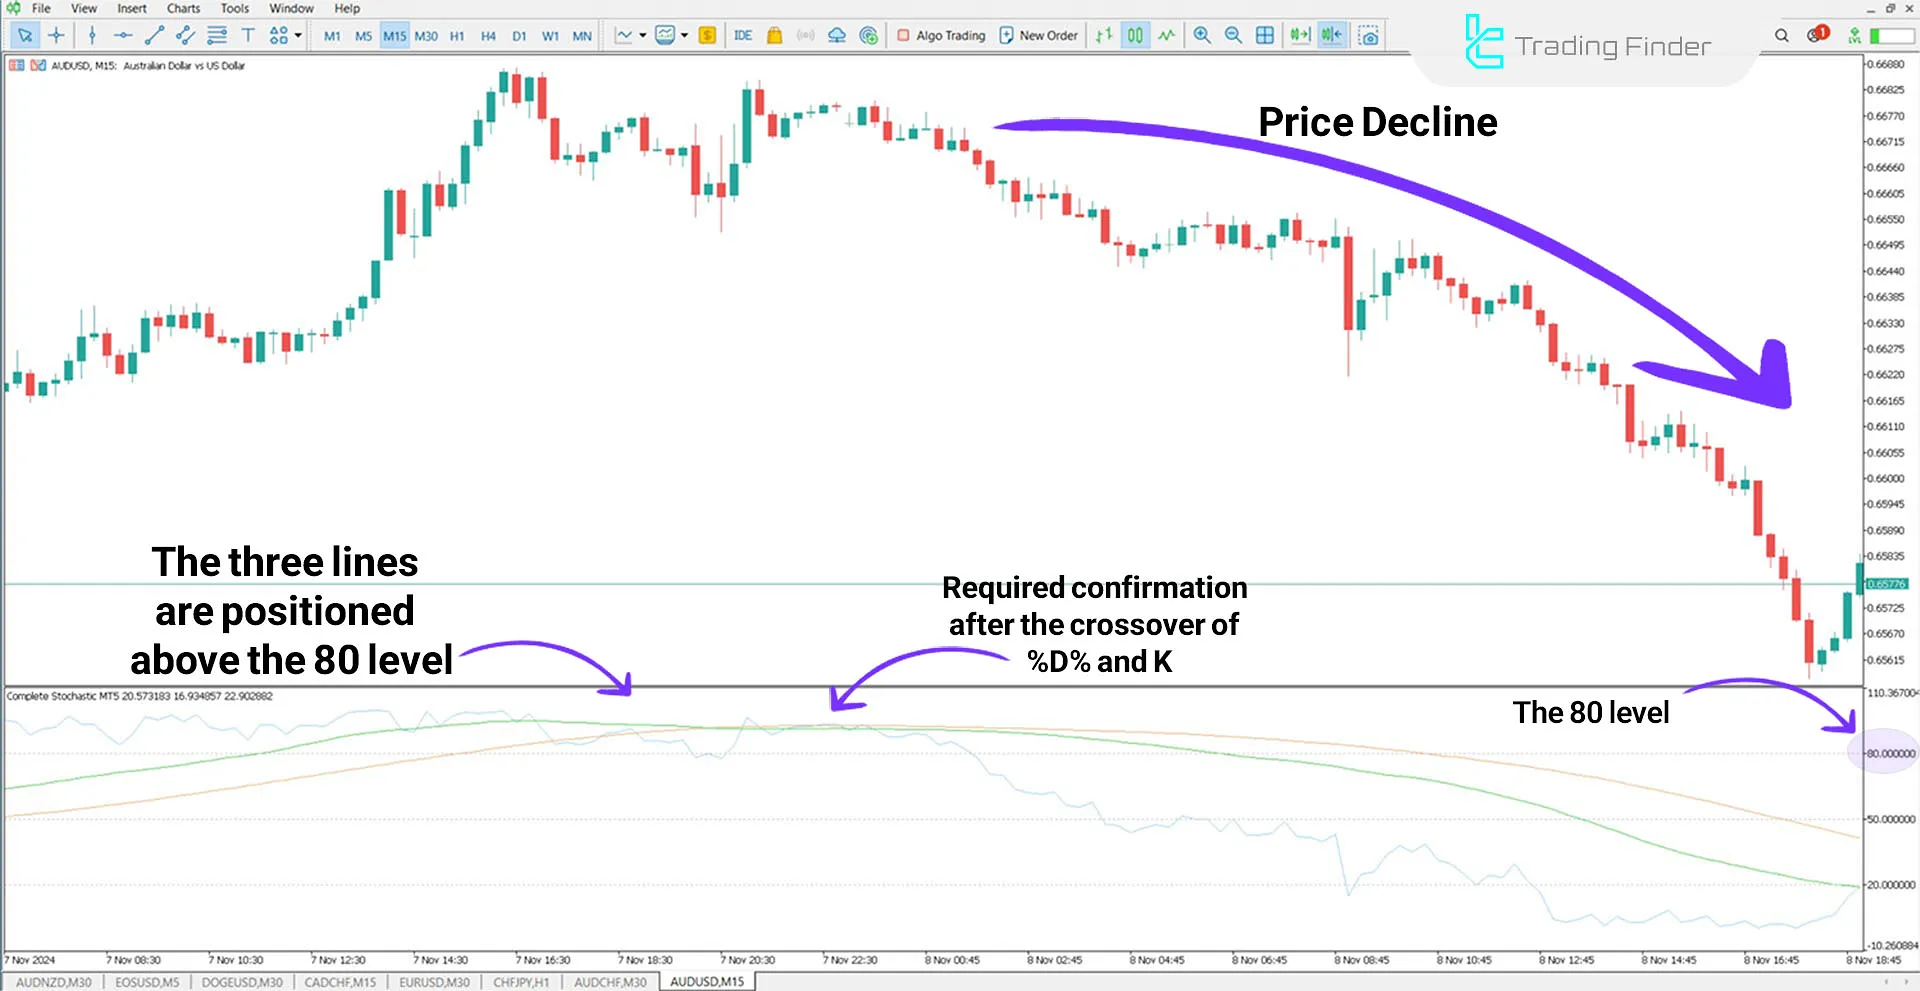
In a downtrend, prices initially rise continuously, forming higher highs. Under these conditions, the %K and %D lines are positioned near or above the 80 level (overbought condition).
If the %D line crosses below the K Slow line from above, it could signal the continuation of the downtrend.

Indicator Settings

- Chart Theme: Chart background color;
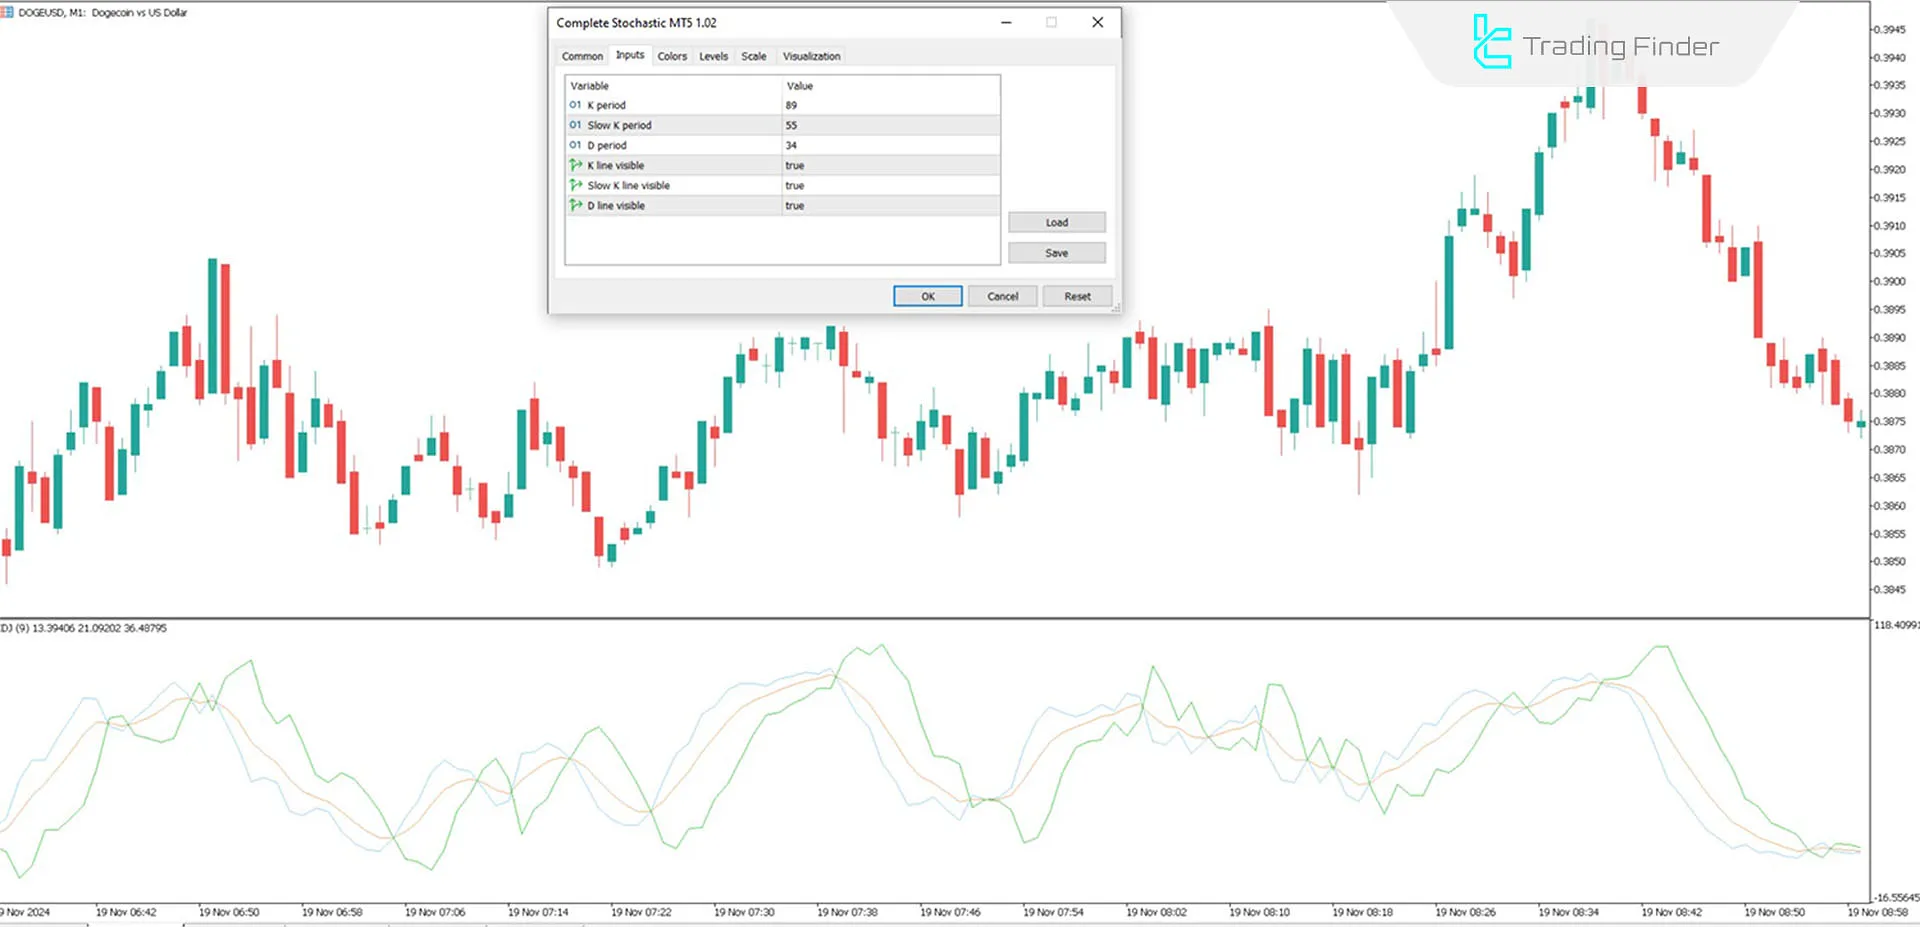
- K Period: Period for calculating the %K line; default is 89 candles;
- Slow K Period: Period for calculating the Slow %K line; default is 55 candles;
- D Period: Period for calculating the %D line; default is 34 candles;
- Show K Line: Displays the %K line;
- Show K Slow Line: Displays the Slow %K line;
- Show D Line: Displays the %D line.
Conclusion
The Complete Stochastic Indicator is a powerful tool for identifying bullish and bearish trends and precisely determining entry (Entry) and exit (Exit) points in trades.
By observing the positions of the%K and %D lines relative to the key levels of 80 and 20, traders can assess market buying (Buy) and selling (Sell) pressure.
Alongside other Trading Assist Indicators for MT5 and confirmations, traders can make better decisions.
Complete Stochastic MT5 PDF
Complete Stochastic MT5 PDF
Click to download Complete Stochastic MT5 PDFWhich timeframes are suitable for using the Complete Stochastic Indicator?
The Complete Stochastic Indicator is suitable for multi-timeframe analysis, and traders can use it in various timeframes, including minute, hourly, and daily charts.
Can the colors of the lines in the Complete Stochastic Indicator be customized?
Yes, in the indicator settings, traders can change the colors of the %K, %D, and K Slow lines to match their trading style.


