![Cross Indicator for MetaTrader 5 Download - [TradingFinder]](https://cdn.tradingfinder.com/image/430426/2-91-en-cross-indicator-mt5-1.webp)
![Cross Indicator for MetaTrader 5 Download - [TradingFinder] 0](https://cdn.tradingfinder.com/image/430426/2-91-en-cross-indicator-mt5-1.webp)
![Cross Indicator for MetaTrader 5 Download - [TradingFinder] 1](https://cdn.tradingfinder.com/image/430429/2-91-en-cross-indicator-mt5-2.webp)
![Cross Indicator for MetaTrader 5 Download - [TradingFinder] 2](https://cdn.tradingfinder.com/image/430428/2-91-en-cross-indicator-mt5-3.webp)
![Cross Indicator for MetaTrader 5 Download - [TradingFinder] 3](https://cdn.tradingfinder.com/image/430427/2-91-en-cross-indicator-mt5-4.webp)
On July 6, 2025, in version 2, alert/notification and signal functionality was added to this indicator
The Cross Indicator is a practical technical analysis tool that operates based on the crossover of two moving averages.
This MetaTrader 5 trading tool detects the exact moment of moving average crossovers and displays entry/exit signals as colored dots on the chart (without showing the moving average lines).
Cross Indicator Table
The general features of the Cross Indicator are summarized in the table below:
Indicator Categories: | Price Action MT5 Indicators Signal & Forecast MT5 Indicators Trading Assist MT5 Indicators |
Platforms: | MetaTrader 5 Indicators |
Trading Skills: | Elementary |
Indicator Types: | Reversal MT5 Indicators |
Timeframe: | Multi-Timeframe MT5 Indicators |
Trading Style: | Intraday MT5 Indicators |
Trading Instruments: | Forex MT5 Indicators Crypto MT5 Indicators Stock MT5 Indicators Commodity MT5 Indicators Indices MT5 Indicators Share Stock MT5 Indicators |
Indicator at a Glance
The Cross Indicator uses two moving averages (short-term and long-term) to analyze price movements across different timeframes.
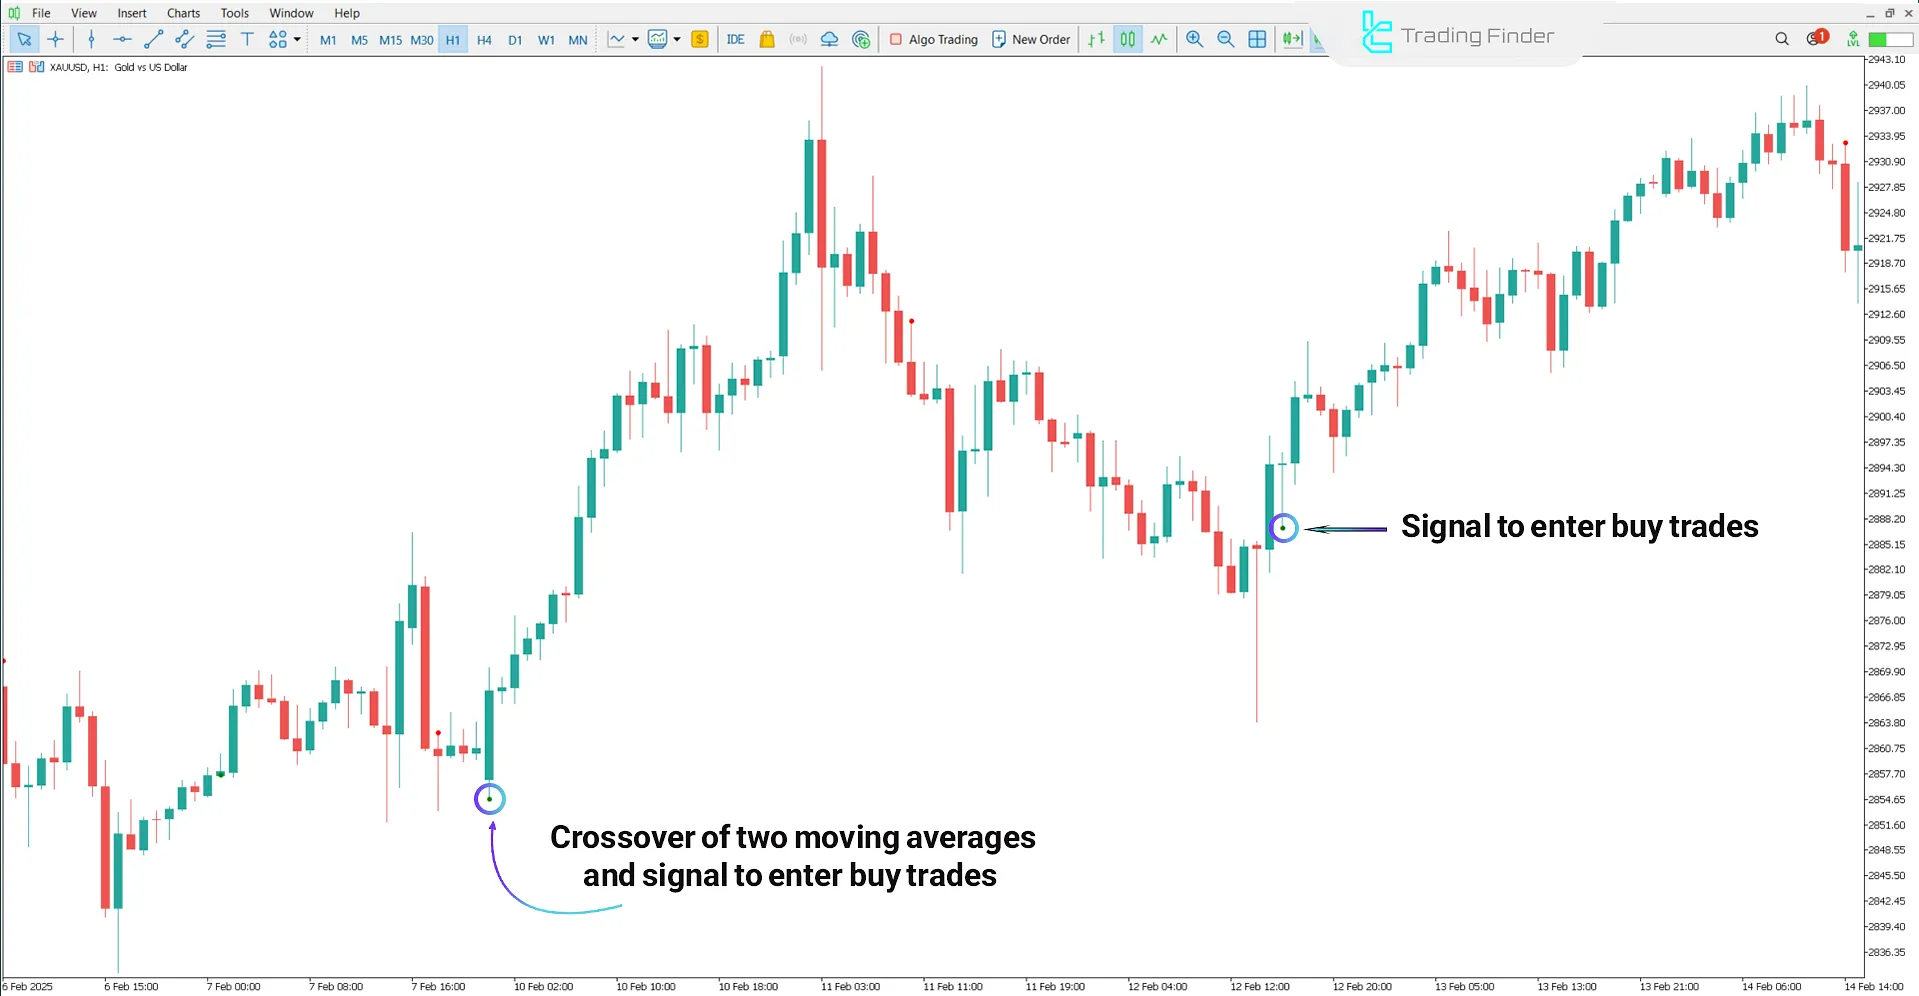
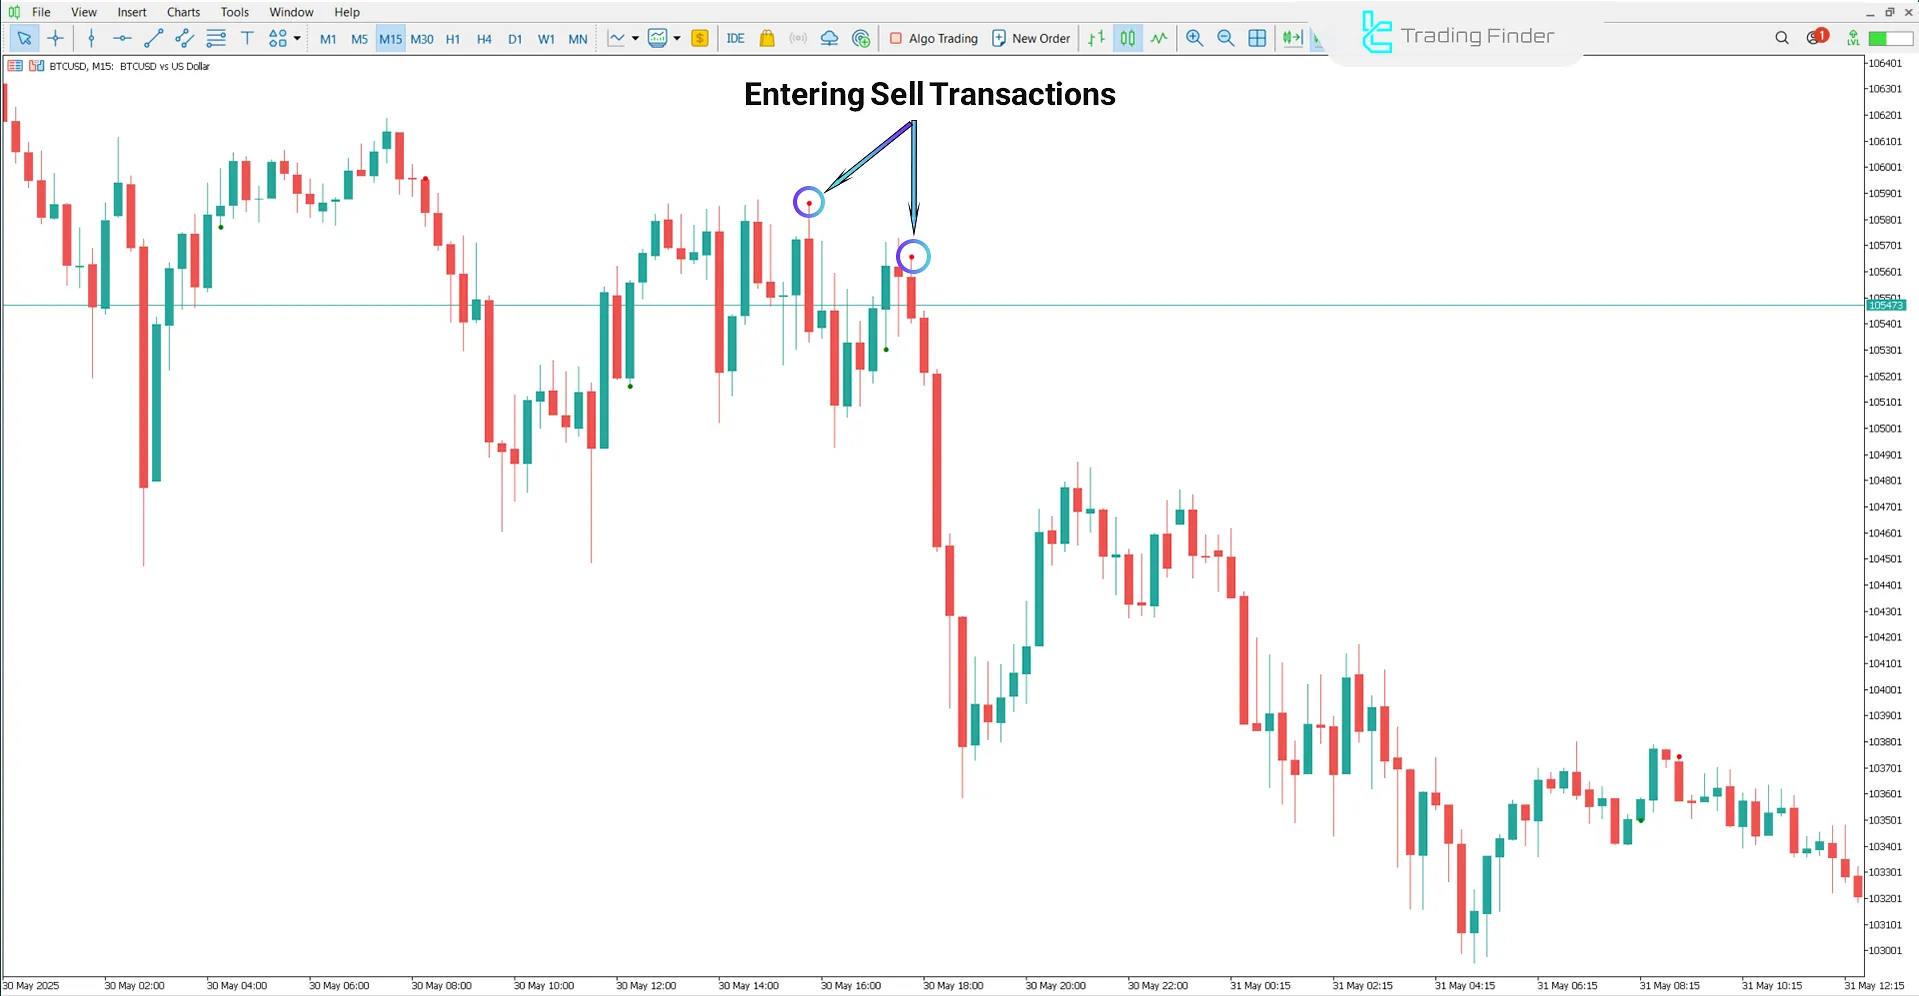
This price action tool displays a colored dot at the crossover point, serving as an entry/exit signal:
- Green Dot: Bullish crossover (buy signal);
- Red Dot: Bearish crossover (sell signal).
Uptrend Conditions
The image below shows the XAU/USD (Gold) chart in a 1-hour timeframe.
When the short-term moving average crosses above the long-term moving average, a green dot appears, indicating buyer pressure and the start of an uptrend.

Downtrend Conditions
The following chart displays the BTC/USD (Bitcoin) pair in a 15-minute timeframe.
When the short-term moving average crosses below the long-term moving average, a red dot appears, signaling a sell entry.

Cross Indicator Settings
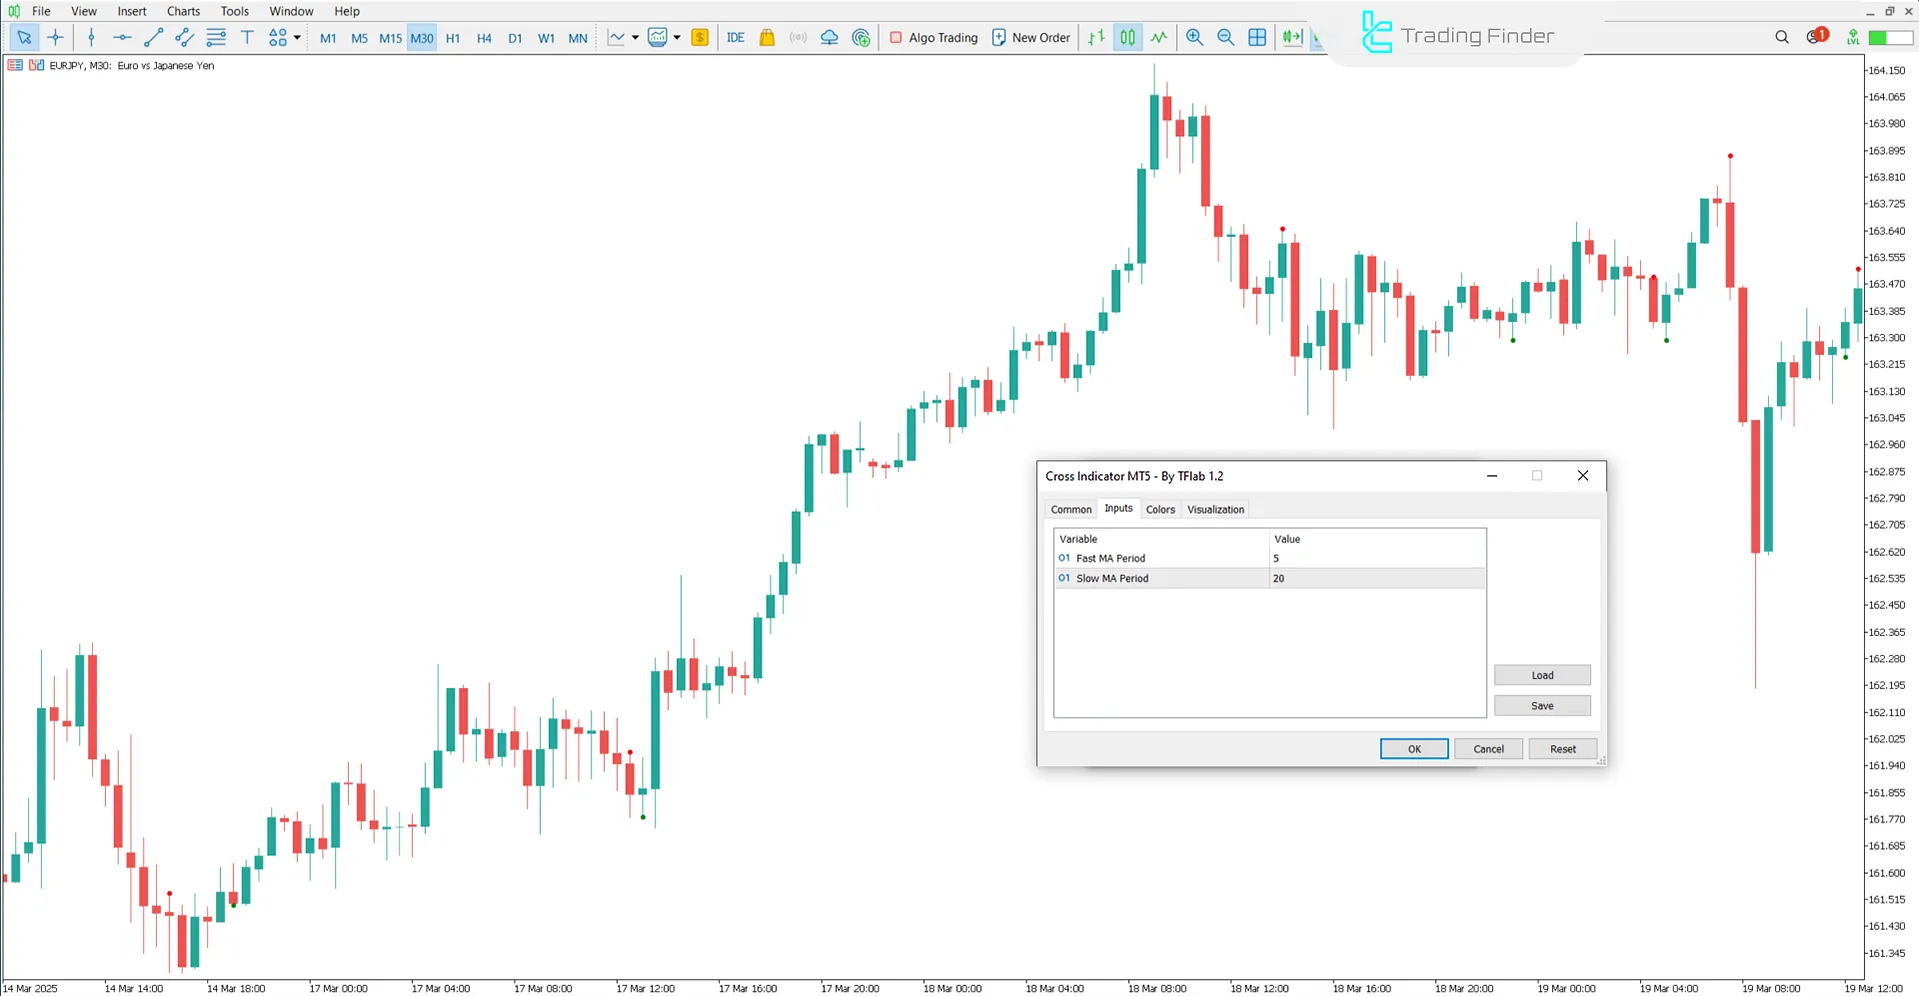
The settings panel of the Cross Indicator includes:
- Fast MA Period: Short-term moving average period;
- Slow MA Period: Long-term moving average period.

Conclusion
The Cross Indicator is a price-action-based analytical tool that identifies entry and exit points using moving average crossovers.
Instead of displaying moving average lines, it uses colored dots above and below candlesticks to generate signals.
Cross MT5 PDF
Cross MT5 PDF
Click to download Cross MT5 PDFAre the moving average lines visible on the chart in the Cross Indicator?
No, only the signal dots are displayed.
Which timeframes are suitable for the Cross Indicator?
It works on all timeframes.
Simple yet powerful indicator.


