![Currency Pairs Correlation Indicator for MetaTrader 5 Download - Free - [Trading Finder]](https://cdn.tradingfinder.com/image/108557/11-33-en-currency-pairs-correlation-mt5-1.webp)
![Currency Pairs Correlation Indicator for MetaTrader 5 Download - Free - [Trading Finder] 0](https://cdn.tradingfinder.com/image/108557/11-33-en-currency-pairs-correlation-mt5-1.webp)
![Currency Pairs Correlation Indicator for MetaTrader 5 Download - Free - [Trading Finder] 1](https://cdn.tradingfinder.com/image/41000/11-33-en-currency-pairs-correlation-mt5-02.avif)
![Currency Pairs Correlation Indicator for MetaTrader 5 Download - Free - [Trading Finder] 2](https://cdn.tradingfinder.com/image/41001/11-33-en-currency-pairs-correlation-mt5-03.avif)
![Currency Pairs Correlation Indicator for MetaTrader 5 Download - Free - [Trading Finder] 3](https://cdn.tradingfinder.com/image/41005/11-33-en-currency-pairs-correlation-mt5-04.avif)
The Currency Pairs Correlation Indicator is a tool in MetaTrader 5 Indicator that helps with various Trading Strategies. Correlation refers to the relationship between two currency pairs and indicates how the price of one pair moves in reaction to the changes in another.
This indicator allows users to input two currency pairs for correlation comparison in the settings and view the results as green and red histograms on the chart.
Currency Pairs Correlation Indicator Table
Indicator Categories: | Oscillators MT5 Indicators Signal & Forecast MT5 Indicators Trading Assist MT5 Indicators |
Platforms: | MetaTrader 5 Indicators |
Trading Skills: | Elementary |
Indicator Types: | Lagging MT5 Indicators Reversal MT5 Indicators |
Timeframe: | Multi-Timeframe MT5 Indicators |
Trading Style: | Swing Trading MT5 Indicators Scalper MT5 Indicators Day Trading MT5 Indicators |
Trading Instruments: | Forex MT5 Indicators Commodity MT5 Indicators Indices MT5 Indicators Forward MT5 Indicators |
Indicator at a Glance
The Currency Pair Correlation Indicator is valuable for traders seeking to identify the correlation between different currency pairs. Through the indicator's settings, traders can select two desired symbols and easily observe their interaction in the histogram window.
This tool helps traders better understand the relationships between currency pairs, enabling them to make more informed trading decisions.
Bullish Trend Conditions of the Indicator (Buy Positions)
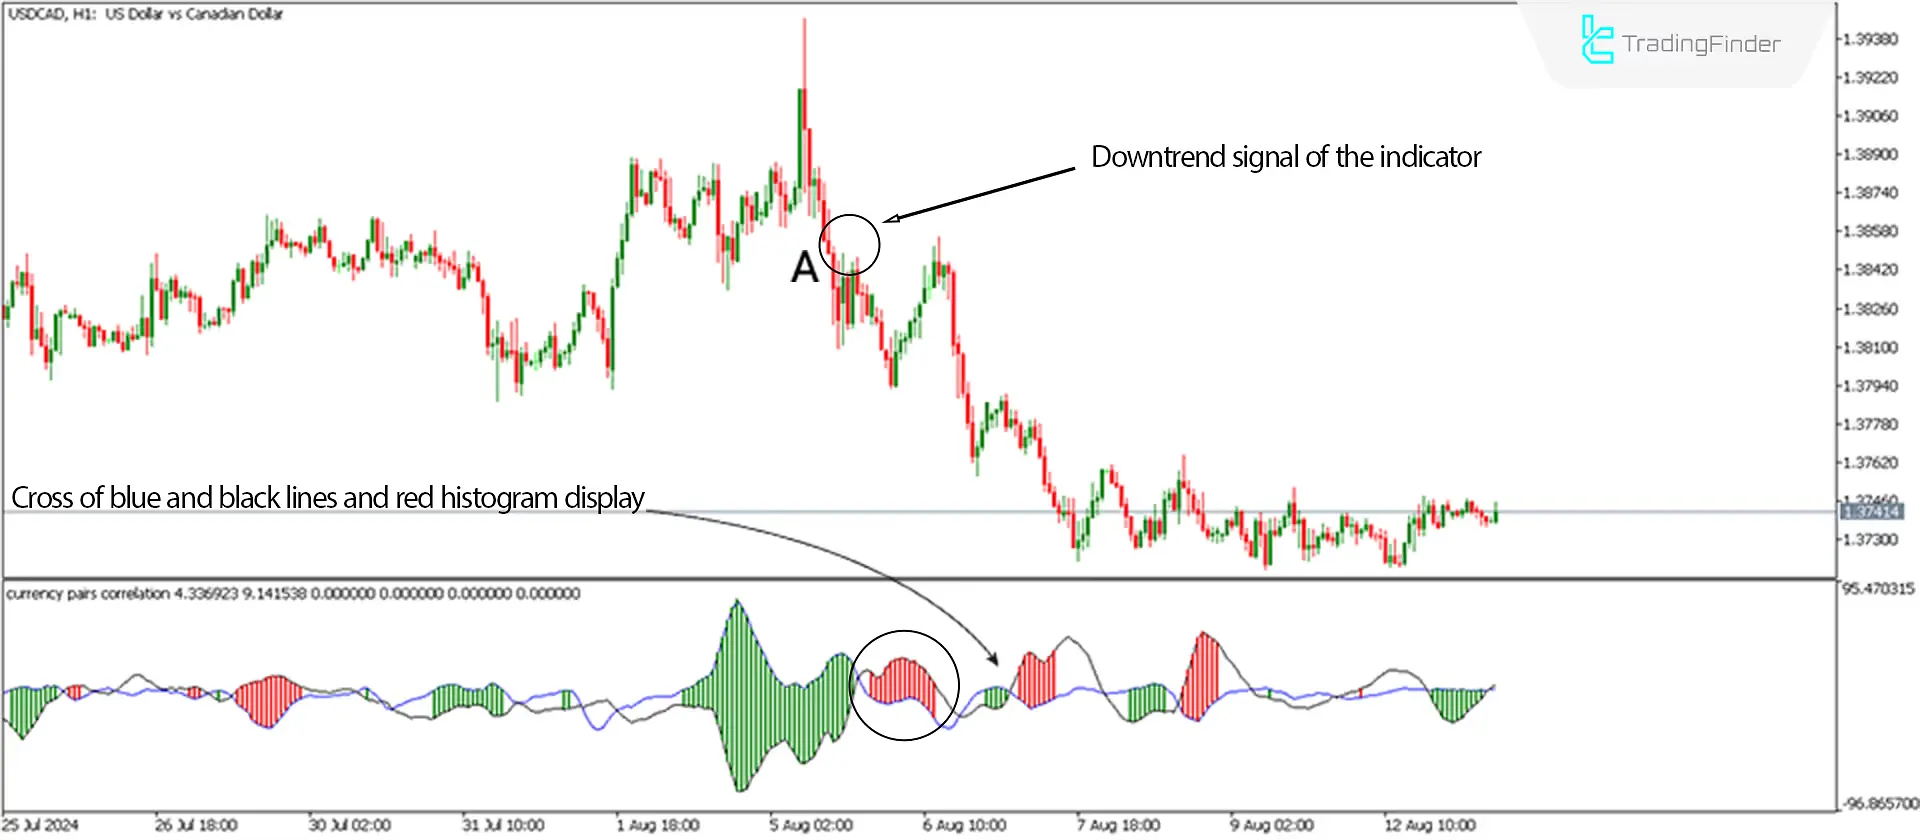
The USD/CAD currency pair is shown in the 1-hour timeframe in the image below. In this example, we compare USD/CAD with CAD/CHF. Since these two symbols have a negative correlation, the crossing of the two oscillator lines and the appearance of the red histogram indicate that USD/CAD is ready for a downward trend, while CAD/CHF is set for an upward trend.

Bearish Trend Conditions of the Indicator (Sell Positions)
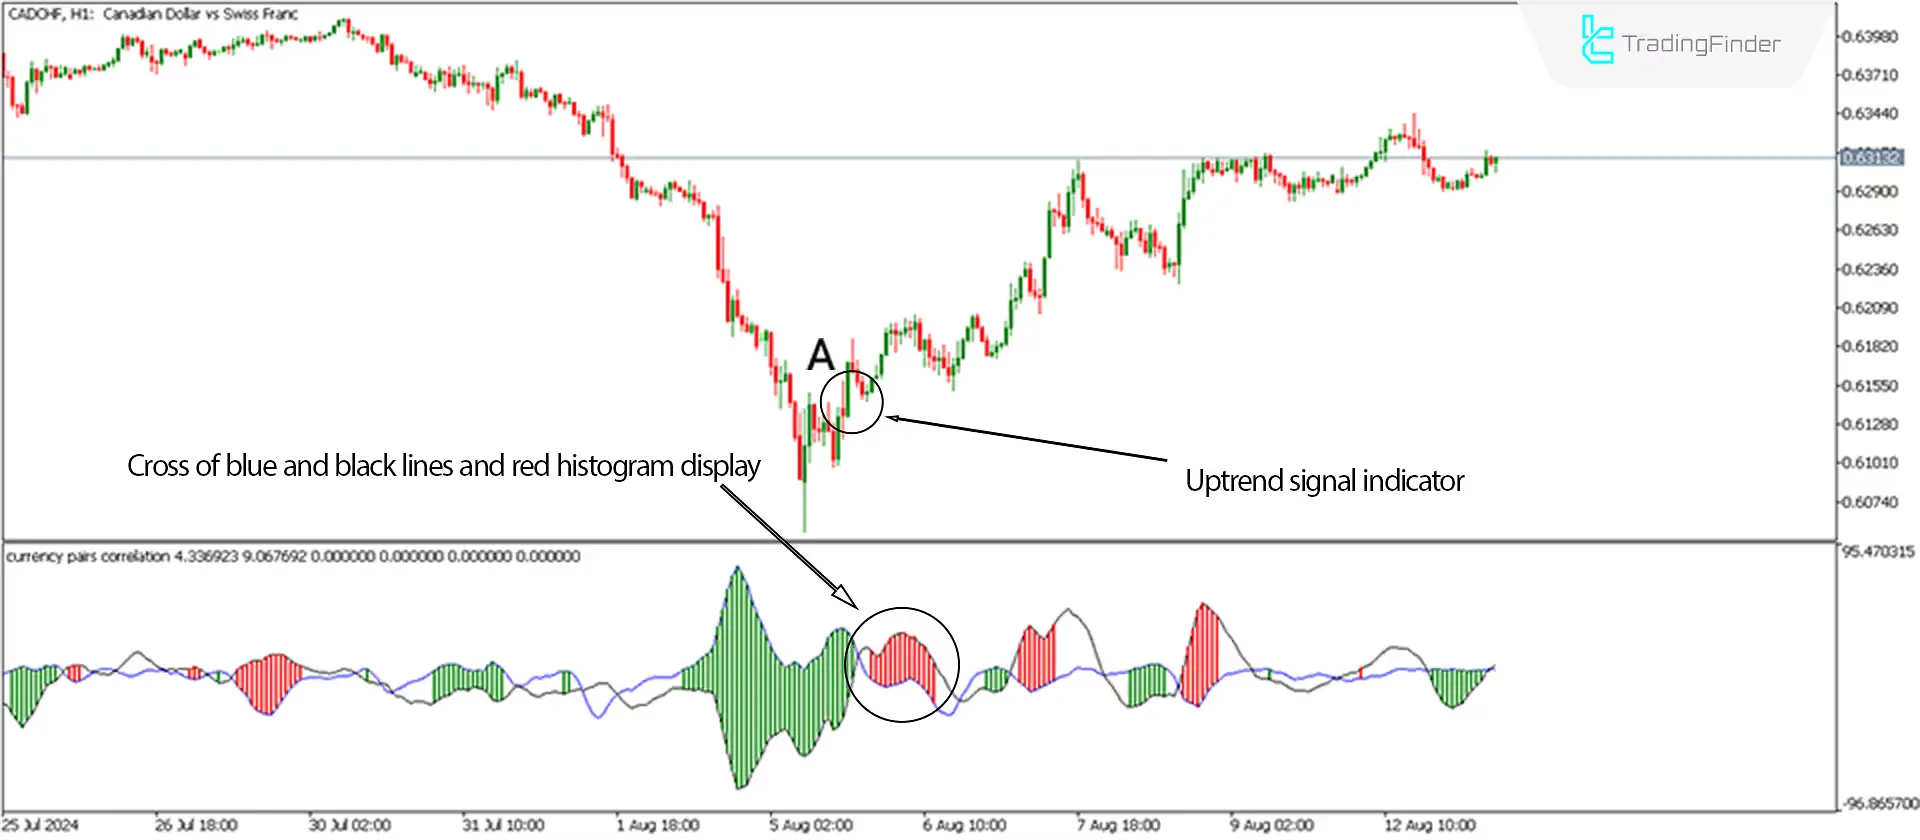
In the 1-hour chart of CAD/CHF, we have compared USD/CAD with CAD/CHF. In this scenario, the Currency Pairs Correlation Indicator shows a negative correlation, where the increase in CAD/CHF, represented by the red histogram, leads to a decline in USD/CAD, initiating a bearish trend.

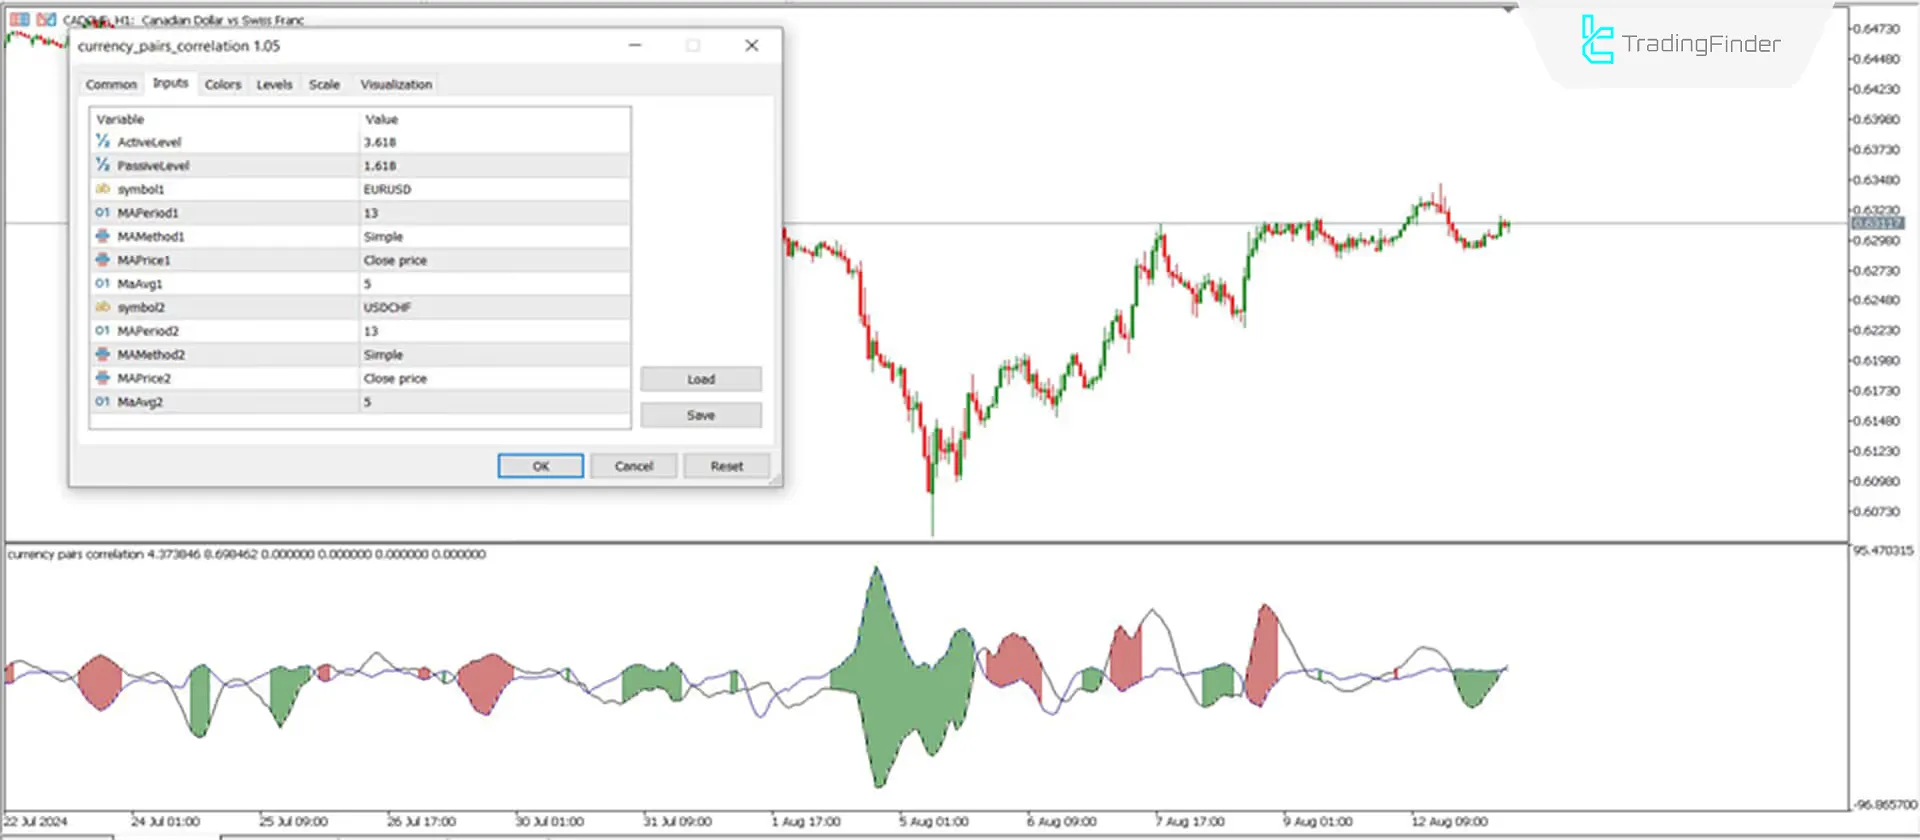
Currency Pairs Correlation Indicator Settings

- ActiveLevel: Settings for positive histograms
- ActiveLevel: Selecting settings for positive histograms
- PassiveLevel: Settings for negative histograms
- Symbol1: First currency pair for calculation (e.g., EURUSD)
- MAPeriod1: Moving average period for the first pair, set to 13
- MAMethod1: Set to 0 for Exponential Moving Average
- MAPrice1: Set to 0 for calculation based on the Close price
- MaAvg1: Averaging based on the last five candles
- Symbol2: Second currency pair (e.g., USDCHF)
- MAPeriod2: Moving average period for the second pair, set to 13
- MAMethod2: Set to 0 for Exponential Moving Average
- MAPrice2: Set to 0 for calculation based on the Close price
- MaAvg2: Averaging based on the last five candles
Conclusion
The Currency Pairs Correlation MT5 Oscillator is a practical and advanced tool for traders exploring correlations between currency pairs in the market. The technical analysis indicator can easily display positive and negative correlations between two currency pairs on the price chart using its specialized algorithm.
Currency Pairs Correlation MT5 PDF
Currency Pairs Correlation MT5 PDF
Click to download Currency Pairs Correlation MT5 PDFHow can I use the Currency Pairs Correlation Indicator?
By entering the two currency pairs you want to compare, you can easily see the green and red histograms on the chart, indicating the type and intensity of the correlation.
What does currency pair correlation indicate?
Correlation refers to the relationship between how one currency pair's price moves in reaction to changes in another pair. Generally, a positive correlation indicates that prices move in the same direction, while a negative correlation shows they move in opposite directions.
The indicator doesnt work on MT5. Could you kindly advise as to what prevents it from not displaying any data at all on MT5 the video sadly shows just MT4 which has the 'allow dll imports' but the MT5 indicator doesnt have this option
The indicator is fully available for both MetaTrader 4 and 5. For the specific issue you are facing, please get in touch with our support team.


