![Custom MACD Indicator for MetaTrader 5 – [Trading Finder]](https://cdn.tradingfinder.com/image/372956/2-57-en-custom-macd-mt5-1.webp)
![Custom MACD Indicator for MetaTrader 5 – [Trading Finder] 0](https://cdn.tradingfinder.com/image/372956/2-57-en-custom-macd-mt5-1.webp)
![Custom MACD Indicator for MetaTrader 5 – [Trading Finder] 1](https://cdn.tradingfinder.com/image/372953/2-57-en-custom-macd-mt5-2.webp)
![Custom MACD Indicator for MetaTrader 5 – [Trading Finder] 2](https://cdn.tradingfinder.com/image/372954/2-57-en-custom-macd-mt5-3.webp)
![Custom MACD Indicator for MetaTrader 5 – [Trading Finder] 3](https://cdn.tradingfinder.com/image/372955/2-57-en-custom-macd-mt5-4.webp)
The Custom MACD Indicator is a technical analysis tool used to evaluate the strength, direction, and momentum of a price trend.
This indicator is based on the difference between two Exponential Moving Averages (EMAs):
- The MACD line, typically shown in blue, represents the distance between two EMAs with different periods;
- The Signal line, generally displayed in red, is a moving average of the MACD line.
Custom MACD Specifications Table
The key specifications of the Custom MACD indicator are summarized in the table below.
Indicator Categories: | Oscillators MT5 Indicators Signal & Forecast MT5 Indicators Trading Assist MT5 Indicators MACD Indicators for MetaTrader 5 |
Platforms: | MetaTrader 5 Indicators |
Trading Skills: | Intermediate |
Indicator Types: | Trend MT5 Indicators Reversal MT5 Indicators |
Timeframe: | Multi-Timeframe MT5 Indicators |
Trading Style: | Intraday MT5 Indicators |
Trading Instruments: | Forex MT5 Indicators Crypto MT5 Indicators Stock MT5 Indicators |
Uptrend Conditions
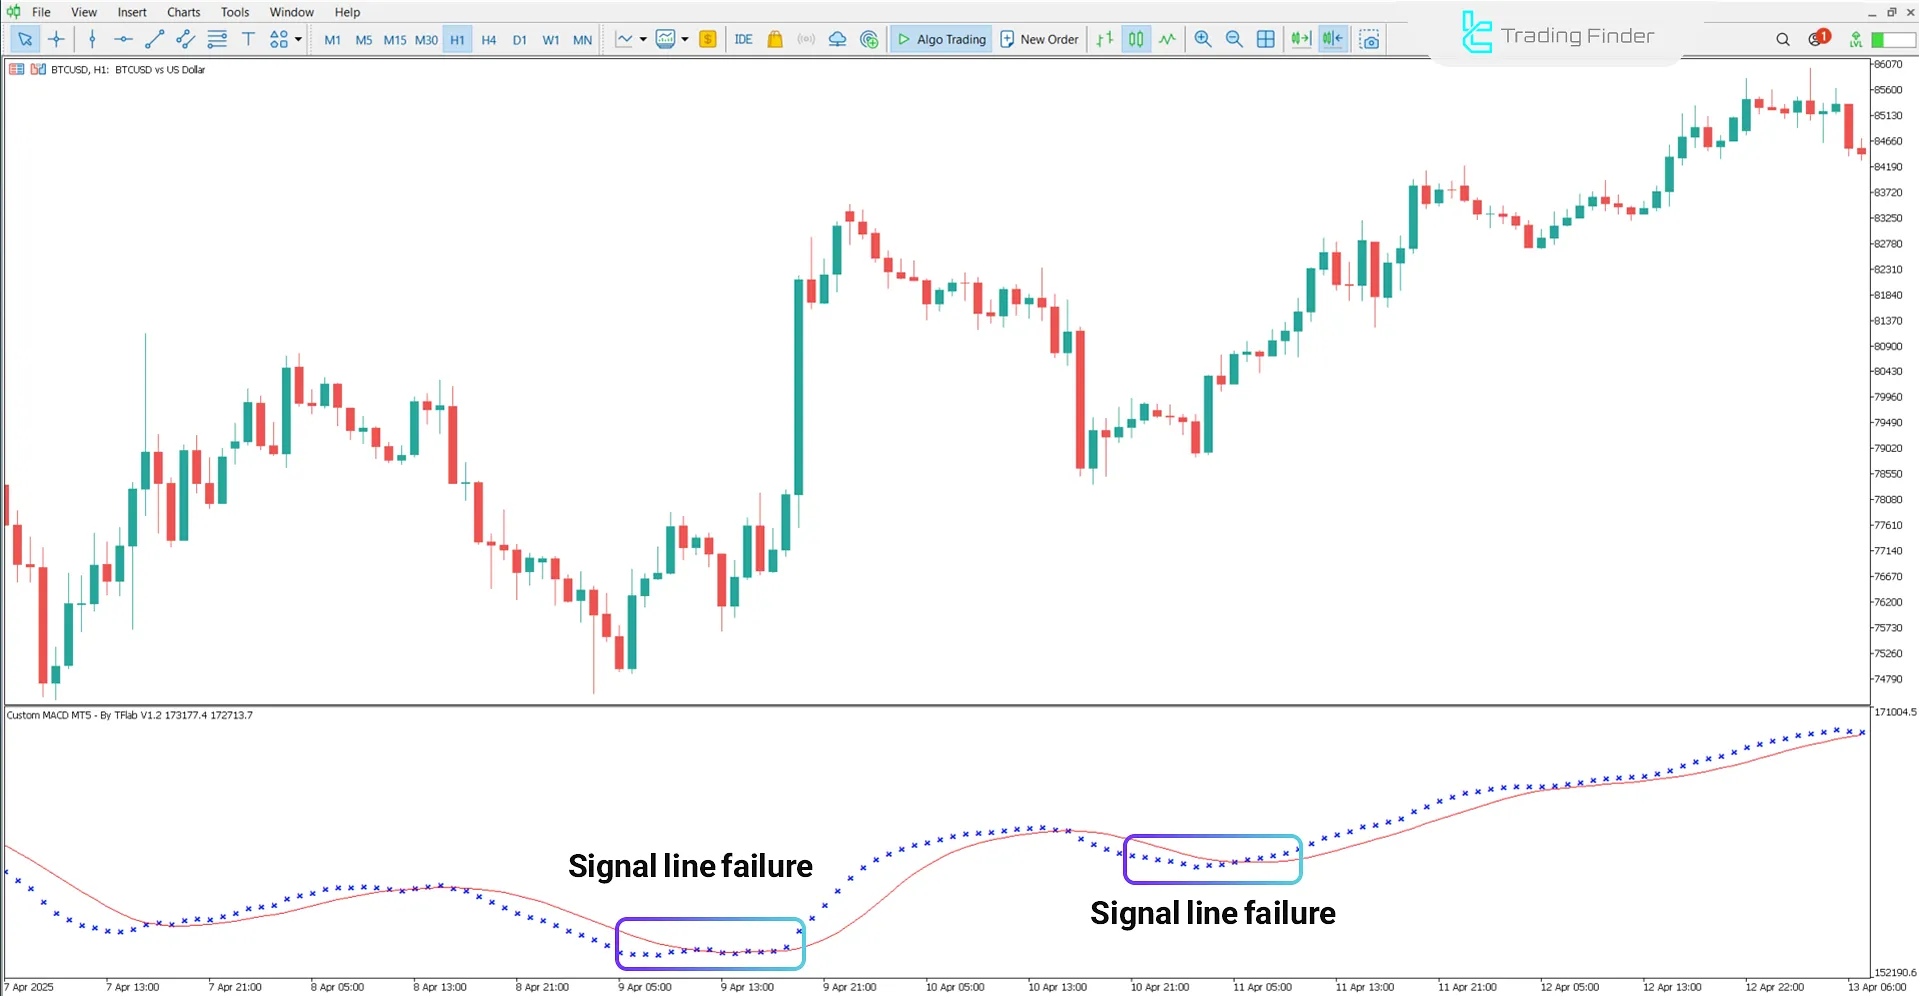
On the BTCUSD chart, the occurrence of a bullish crossover in the MACD indicator suggests increased buying momentum and the potential beginning of an uptrend.
In this scenario, the MACD line crosses the Signal line from below, which is typically interpreted as a buy signal.

Downtrend Conditions
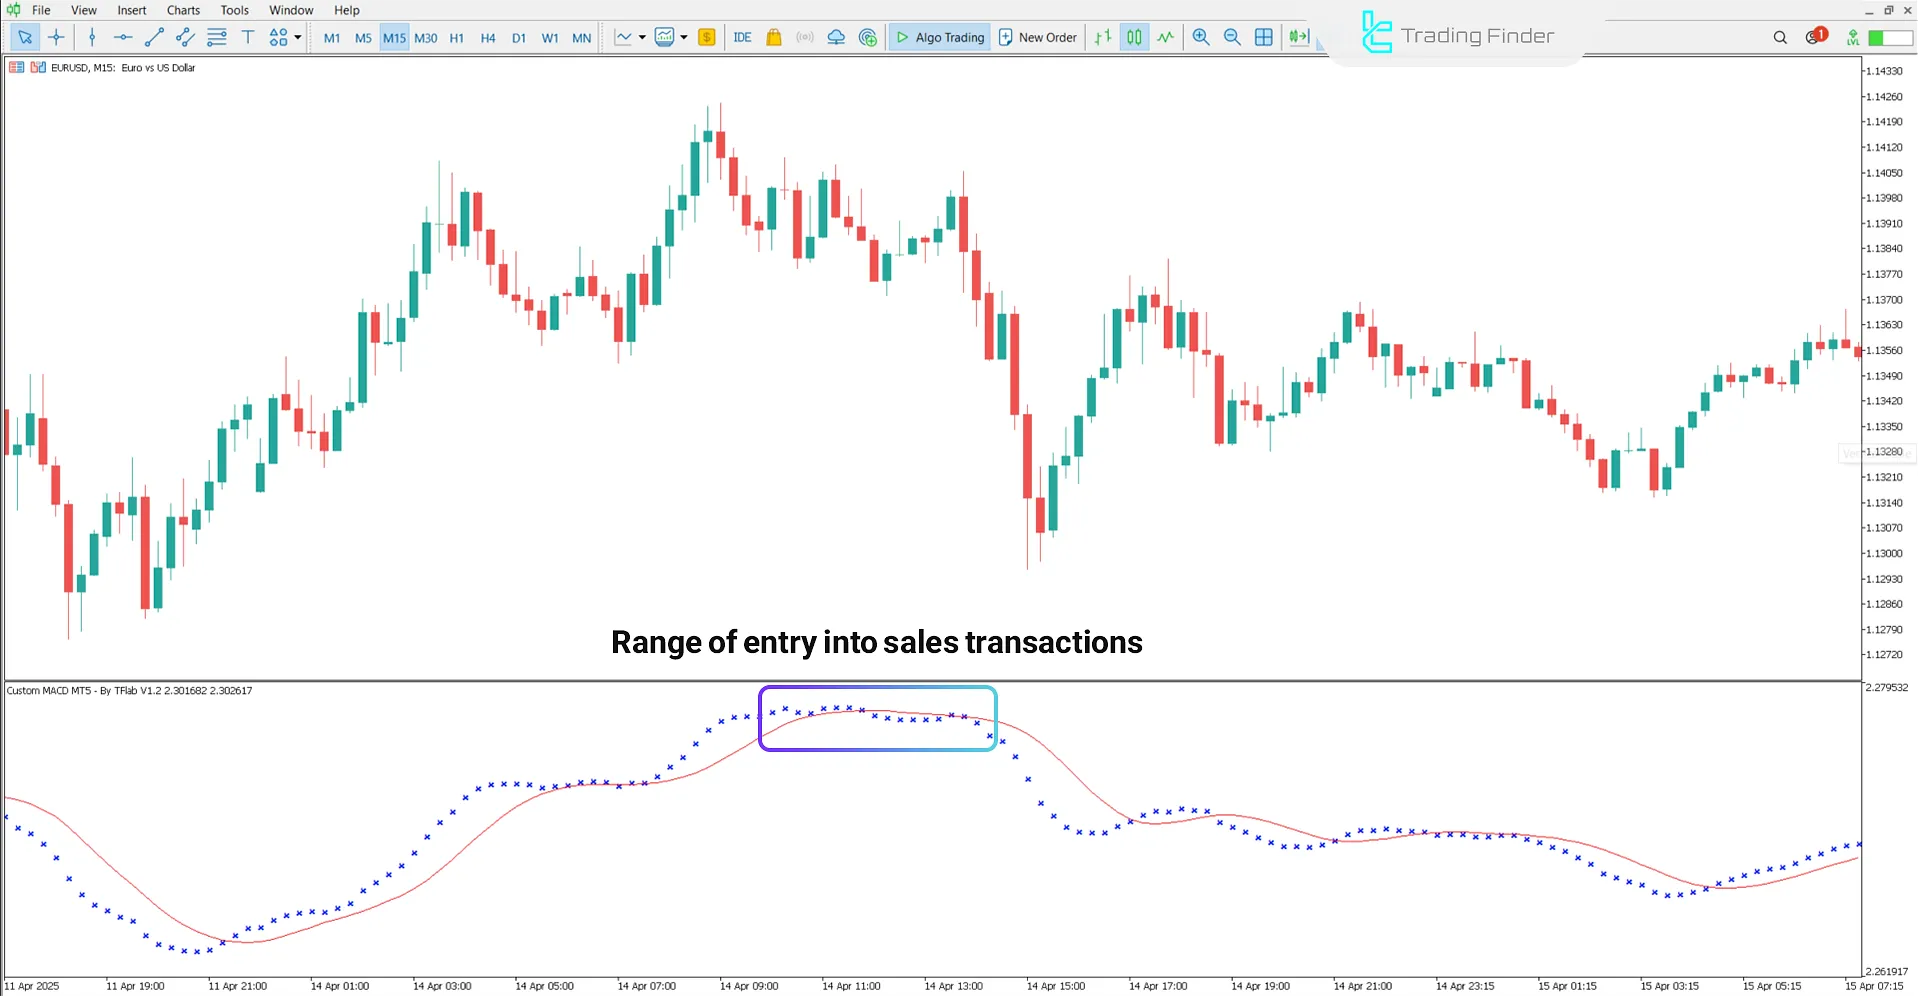
The image below clearly illustrates a bearish trend in the EUR/USD currency pair chart. Here, the MACD line crosses below the Signal line, forming a bearish crossover.
This crossover is commonly viewed as a sign of weakening buyer strength and may indicate the start of a corrective phase or downtrend.

Indicator Settings
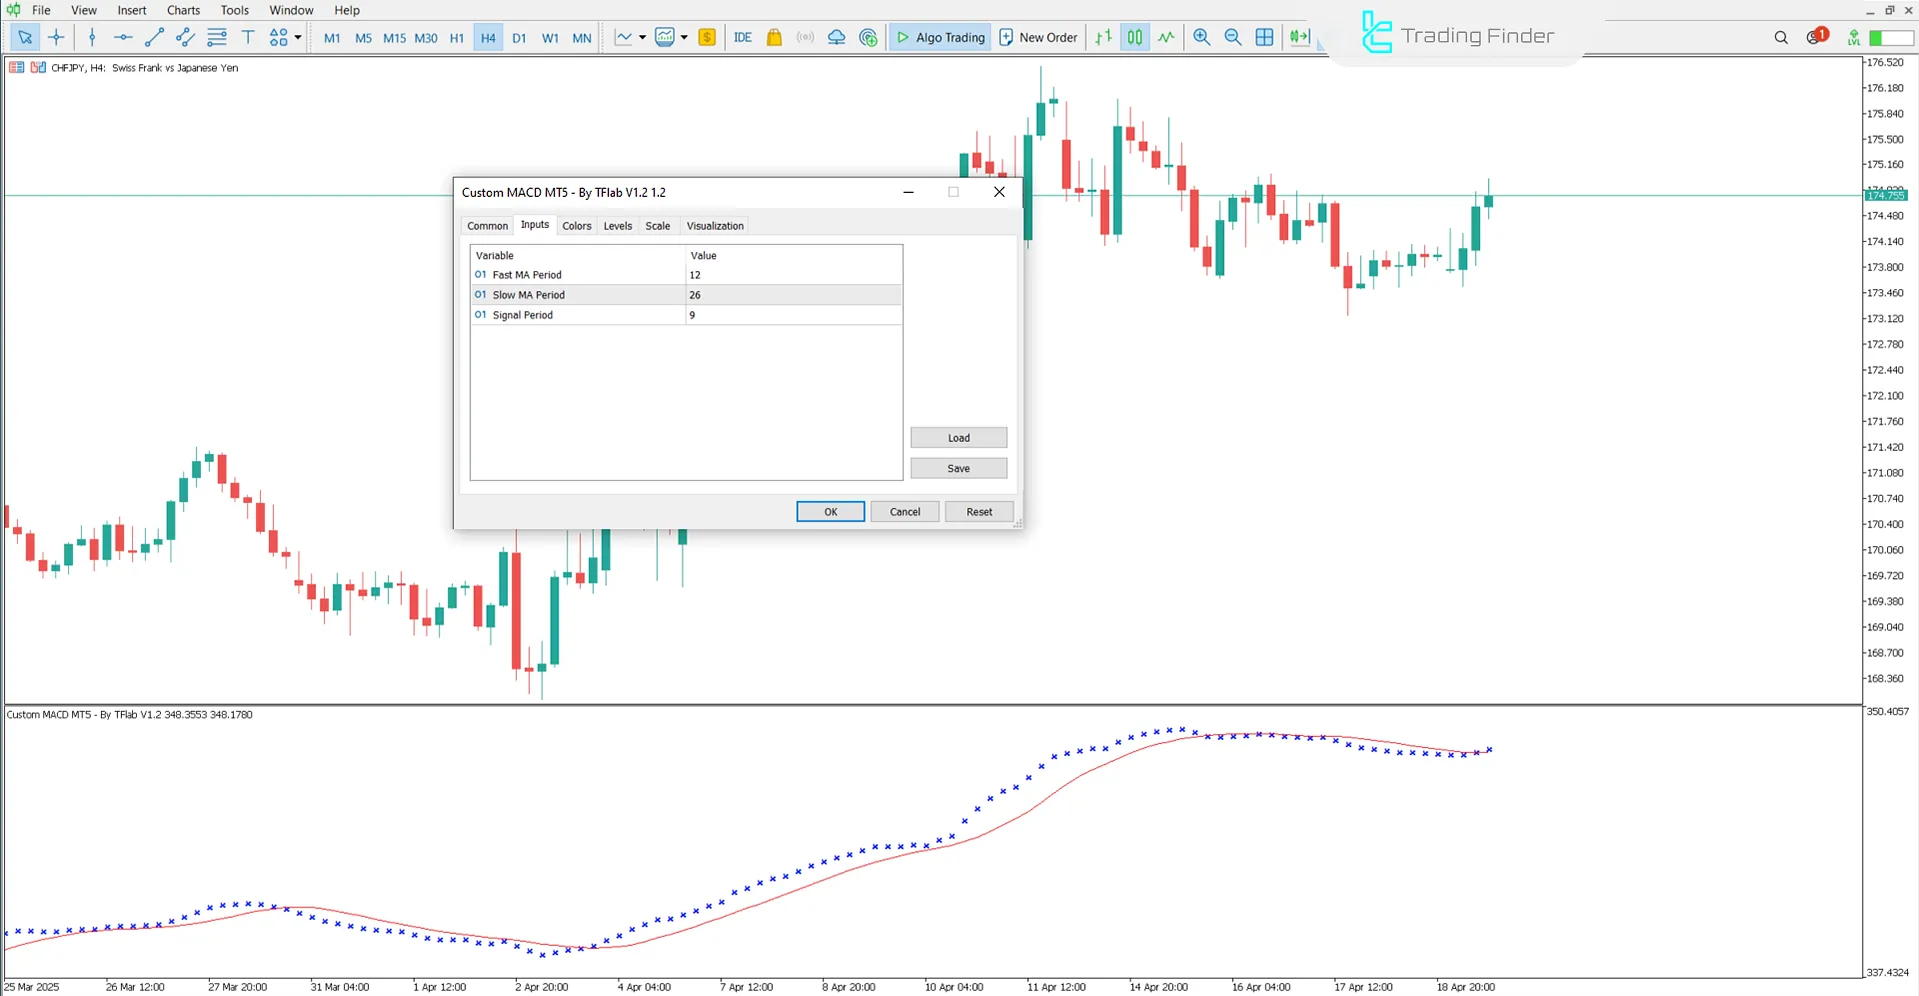
The configurable parameters in the Custom MACD Indicator are shown in the image below:

- Fast MA Period: Period of the fast-moving average
- Slow MA Period: Period of the slow-moving average
- Signal Period: Period of the signal line
Conclusion
The Custom MACD Indicator is a powerful technical tool that, by combining exponential moving averages, offers high precision in identifying trends, divergences, and trade signals.
It is a versatile tool suitable for all financial markets and time frames.
Custom MACD MT5 PDF
Custom MACD MT5 PDF
Click to download Custom MACD MT5 PDFIn which time frames is the Custom MACD most effective?
This trading tool is suitable for all time frames.
In which financial markets can the Custom MACD be used?
The Custom MACD indicator can be applied to all financial markets, including Forex, cryptocurrencies, and commodities.


