![Damiani Volatmeter (Voltameter) Oscillator MT5 Download – [TradingFinder]](https://cdn.tradingfinder.com/image/512205/13-196-en-damiani-voltameter-mt5-01.webp)
![Damiani Volatmeter (Voltameter) Oscillator MT5 Download – [TradingFinder] 0](https://cdn.tradingfinder.com/image/512205/13-196-en-damiani-voltameter-mt5-01.webp)
![Damiani Volatmeter (Voltameter) Oscillator MT5 Download – [TradingFinder] 1](https://cdn.tradingfinder.com/image/512183/13-196-en-damiani-voltameter-mt5-02.webp)
![Damiani Volatmeter (Voltameter) Oscillator MT5 Download – [TradingFinder] 2](https://cdn.tradingfinder.com/image/512184/13-196-en-damiani-voltameter-mt5-03.webp)
![Damiani Volatmeter (Voltameter) Oscillator MT5 Download – [TradingFinder] 3](https://cdn.tradingfinder.com/image/512206/13-196-en-damiani-voltameter-mt5-04.webp)
The Damiani Volatmeter (Voltameter) indicator is an analytical tool for distinguishing volatile and low-volatility phases of the market in MetaTrader 5.
Unlike many trading tools, this trading indicator does not directly provide buy or sell signals, but only specifies favorable or unfavorable conditions for entering trades.
Its structure consists of two curves: green (volatility) and gray (noise). By examining their relative position, the indicator defines the state of market fluctuations.
Table of Specifications for Damiani Volatmeter (Voltameter) Indicator
The table below contains the specifications of the Damiani Voltameter Oscillator:
Damiani Volatmeter Oscillator at a Glance
In the Damiani Volatmeter indicator, when the green line is above the gray line, it indicates real and reliable market activity. But if the gray line is positioned higher, the market is in a low-volatility or ranging phase.
Additionally, when the noise line (gray) increases, the indicator draws a boundary in the form of a red line.
Uptrend Conditions
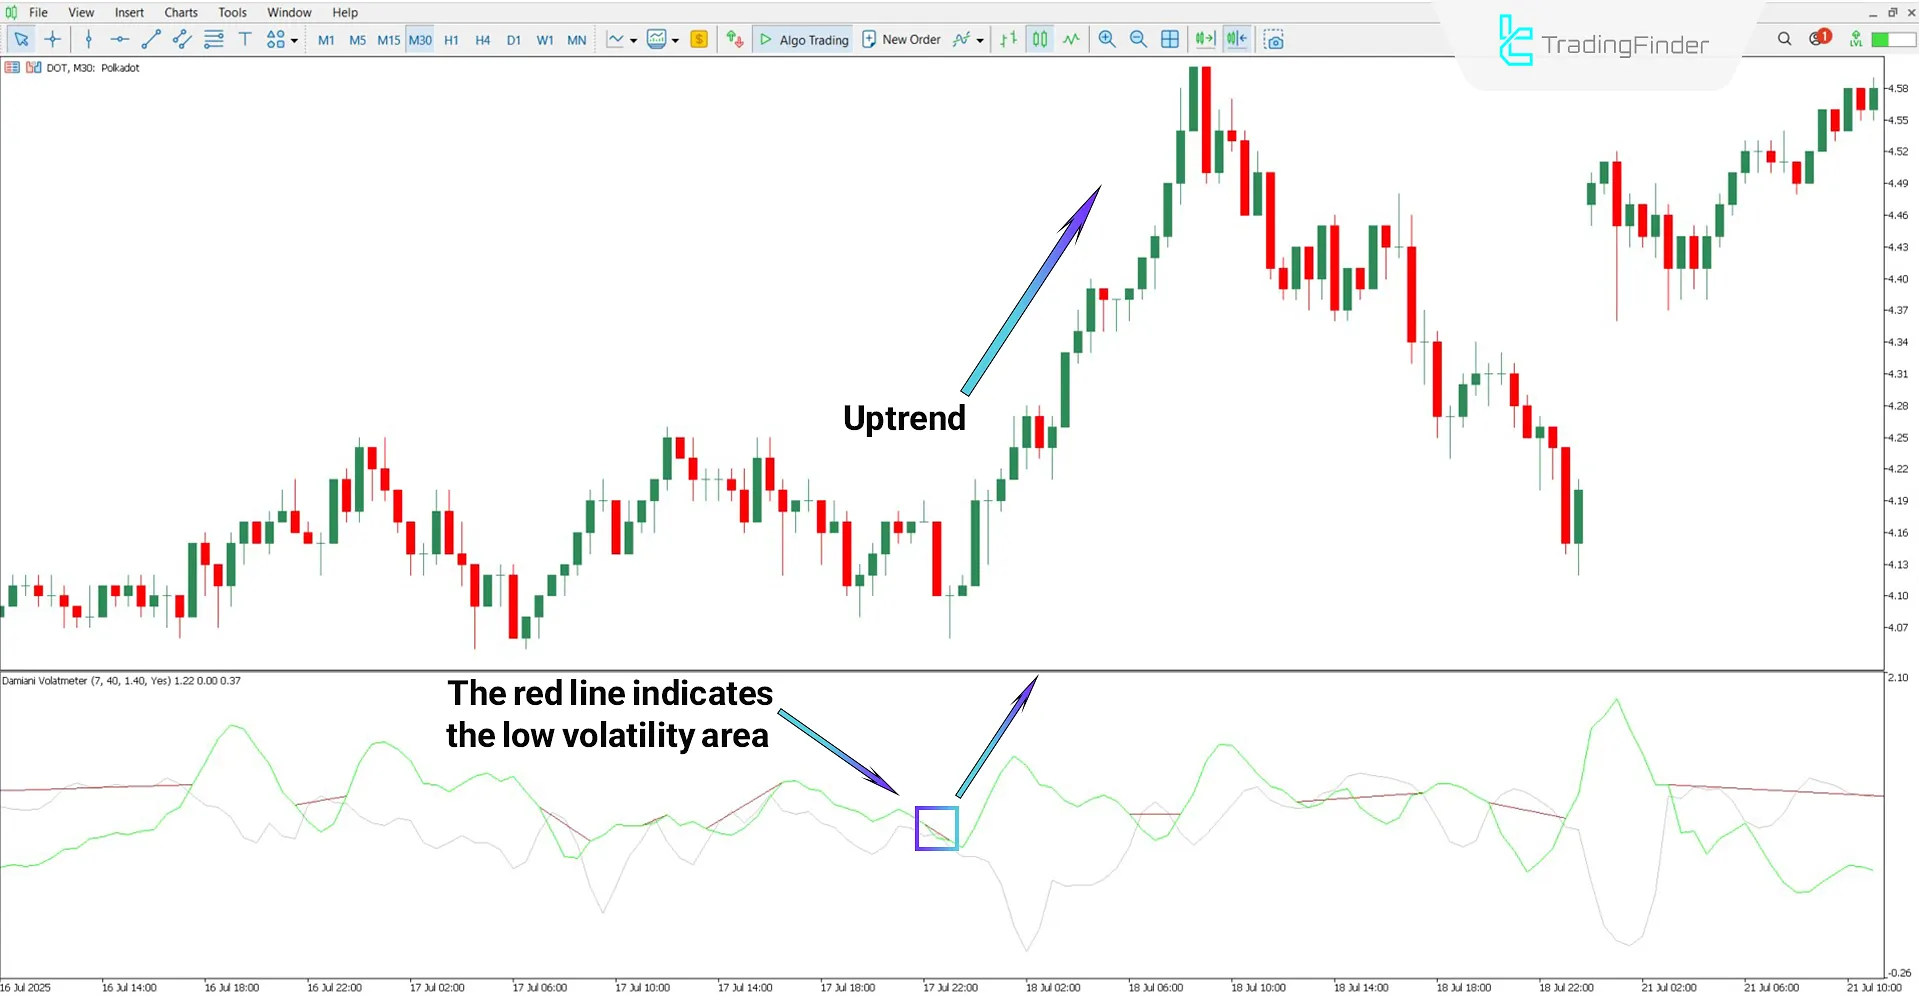
According to the Polkadot (DOT) cryptocurrency 30-minute chart, the gray line is above the green line, which indicates ranging and low volatility market conditions.
The indicator also clearly identifies the non trending zone by drawing a horizontal red line.
Based on the chart, immediately after the green line crosses above the gray line, the market enters a clear upward movement.

Downtrend Conditions
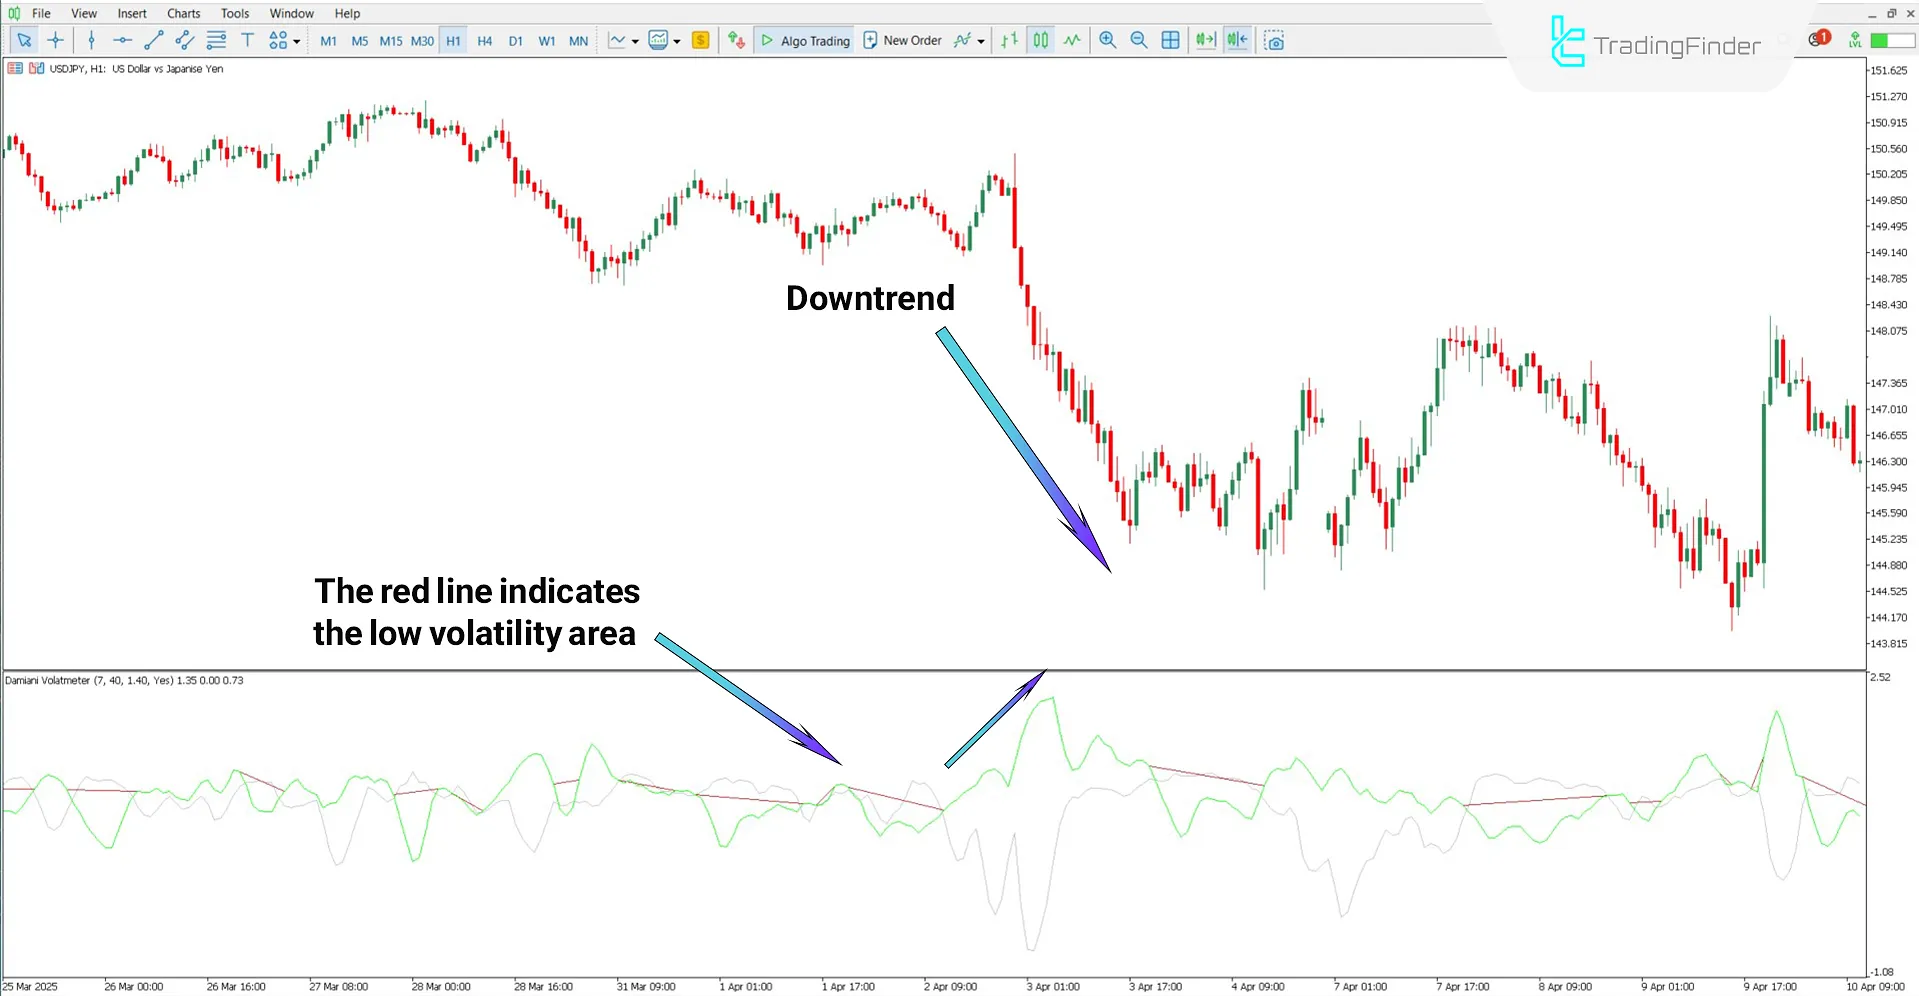
According to the USD/JPY one-hour chart, the volatility line crosses the gray line and moves above it. In this situation, due to bearish pressure, the price breaks the range downward and enters a declining trend.

Settings of the Damiani Volatmeter Oscillator
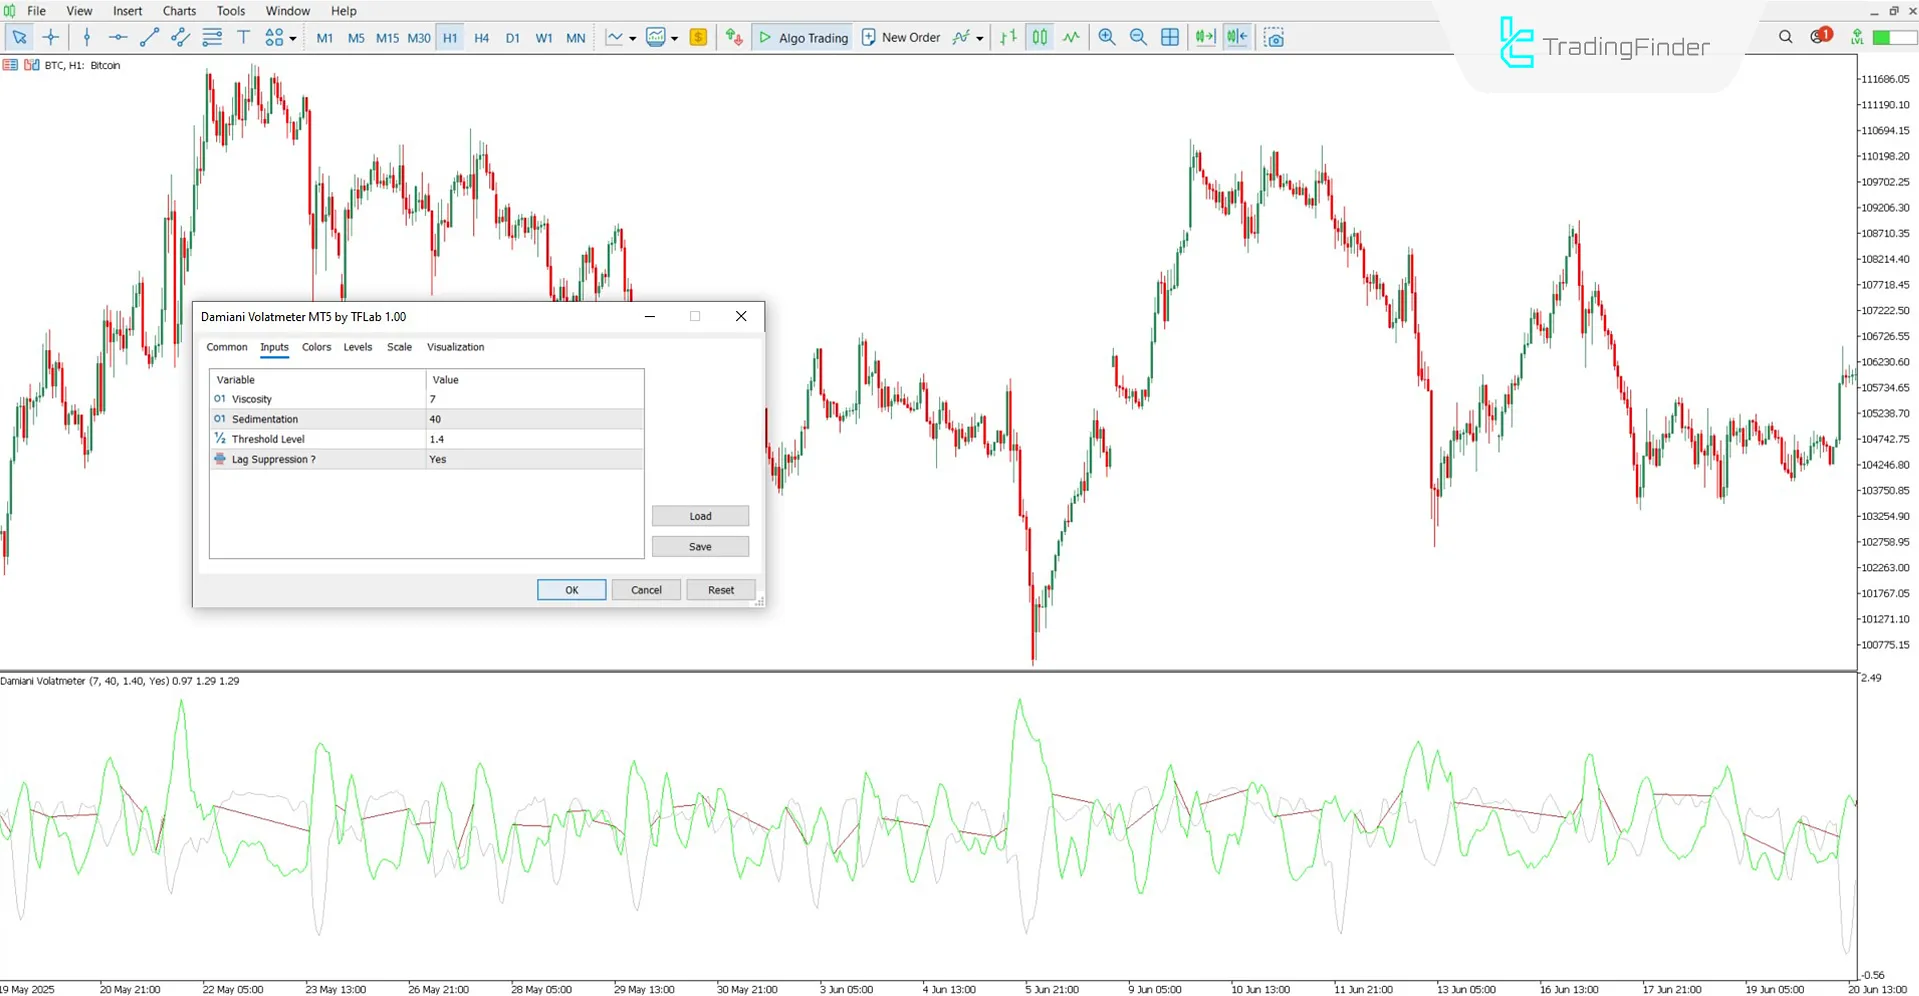
The settings of the Damiani Volatmeter (Voltameter) Indicator are as follows:

- Viscosity: Number of candles for market noise calculation
- Sedimentation: Period for smoothing price fluctuations and continuous market behavior
- Threshold_level: Threshold level for comparing volatility with noise to determine a trading signal
- lag_supressor: Activation of the delay reduction mechanism in signal output
Conclusion
The Damiani Volatmeter oscillator is designed to identify and filter out unfavorable market conditions.
Instead of issuing direct buy or sell signals, this indicator evaluates the overall market tradability and only considers it suitable for entry if sufficient volatility exists.
Damiani Voltameter Oscillator for MT5 PDF
Damiani Voltameter Oscillator for MT5 PDF
Click to download Damiani Voltameter Oscillator for MT5 PDFDoes this indicator apply to smaller timeframes?
Yes, the Damiani Voltameter oscillator is multi-timeframe and applicable to all timeframes.
Does the Damiani Voltameter indicator define the direction of the trend?
No, this indicator only shows whether the market is suitable or unsuitable for trading.


