![De Munyuk Oscillator for MT5 Download – Free – [TradingFinder]](https://cdn.tradingfinder.com/image/590400/13-230-en-de-munyuk-mt5-01.webp)
![De Munyuk Oscillator for MT5 Download – Free – [TradingFinder] 0](https://cdn.tradingfinder.com/image/590400/13-230-en-de-munyuk-mt5-01.webp)
![De Munyuk Oscillator for MT5 Download – Free – [TradingFinder] 1](https://cdn.tradingfinder.com/image/590384/13-230-en-de-munyuk-mt5-02.webp)
![De Munyuk Oscillator for MT5 Download – Free – [TradingFinder] 2](https://cdn.tradingfinder.com/image/590395/13-230-en-de-munyuk-mt5-03.webp)
![De Munyuk Oscillator for MT5 Download – Free – [TradingFinder] 3](https://cdn.tradingfinder.com/image/590403/13-230-en-de-munyuk-mt5-04.webp)
The De Munyuk Indicator is one of the tools in technical analysis that effectively shows the start of bullish and bearish trends as well as the overall price direction.
This oscillator creates small colored blocks to display market fluctuations in a simple, clutter-free way, inside a separate window. Users can apply it as a tool for trend identification and also as a filter within various trading strategies.
De Munyuk Oscillator Specification Table
The table below describes the specifications of the De Munyuk Indicator.
Indicator Categories: | Oscillators MT5 Indicators Signal & Forecast MT5 Indicators |
Platforms: | MetaTrader 5 Indicators |
Trading Skills: | Elementary |
Indicator Types: | Reversal MT5 Indicators |
Timeframe: | Multi-Timeframe MT5 Indicators |
Trading Style: | Swing Trading MT5 Indicators Scalper MT5 Indicators Day Trading MT5 Indicators |
Trading Instruments: | Forex MT5 Indicators Crypto MT5 Indicators Stock MT5 Indicators |
De Munyuk Indicator at a Glance
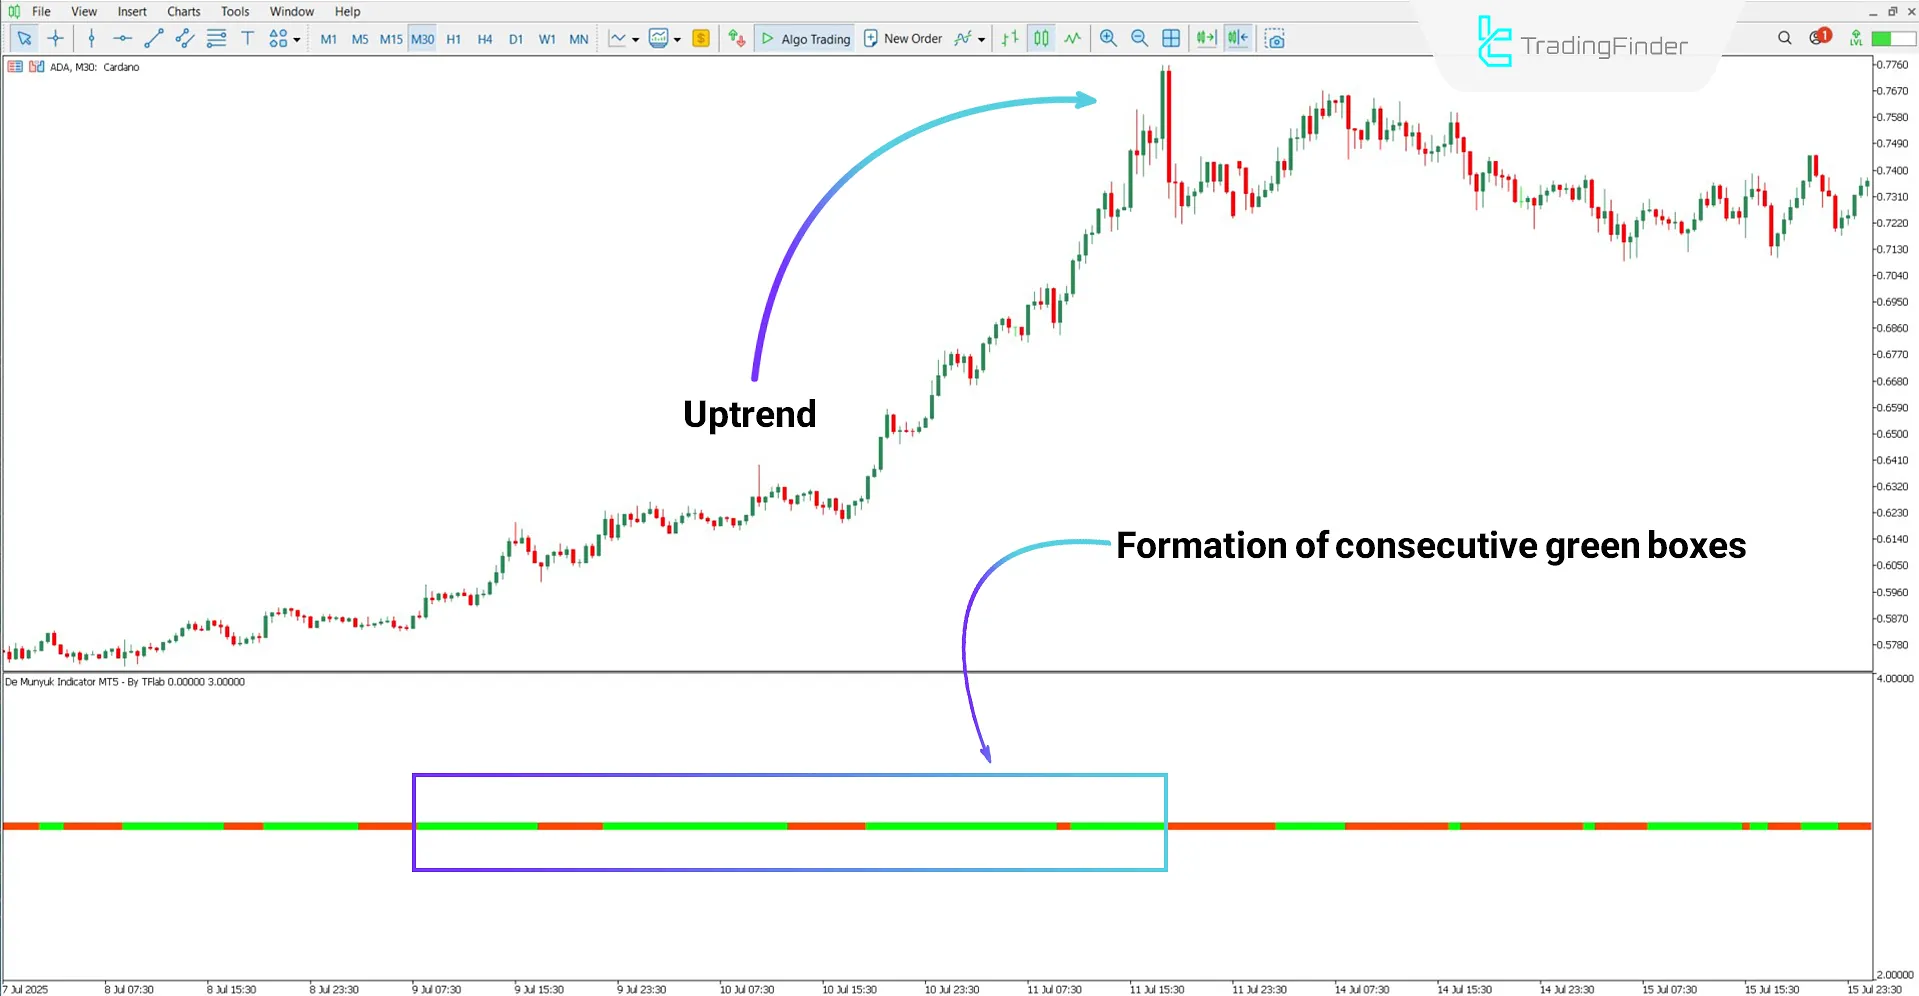
In the De Munyuk Indicator, the appearance of green boxes shows buyer interest and the start of a bullish trend, while red blocks indicate a bearish trend.
The key highlight of this tool is the stability of the issued signals, as they are not subject to revision or alteration once candlesticks are closed.
Bullish Trend Conditions
According to the ADA (Cardano) cryptocurrency chart in the 30-minute timeframe, the appearance of green boxes indicates the start of an upward price movement.
As illustrated in the chart below, the repeated sequence of these green boxes emphasizes the continuation of the bullish trend and signals the strength of buyers in the market.

Bearish Trend Conditions
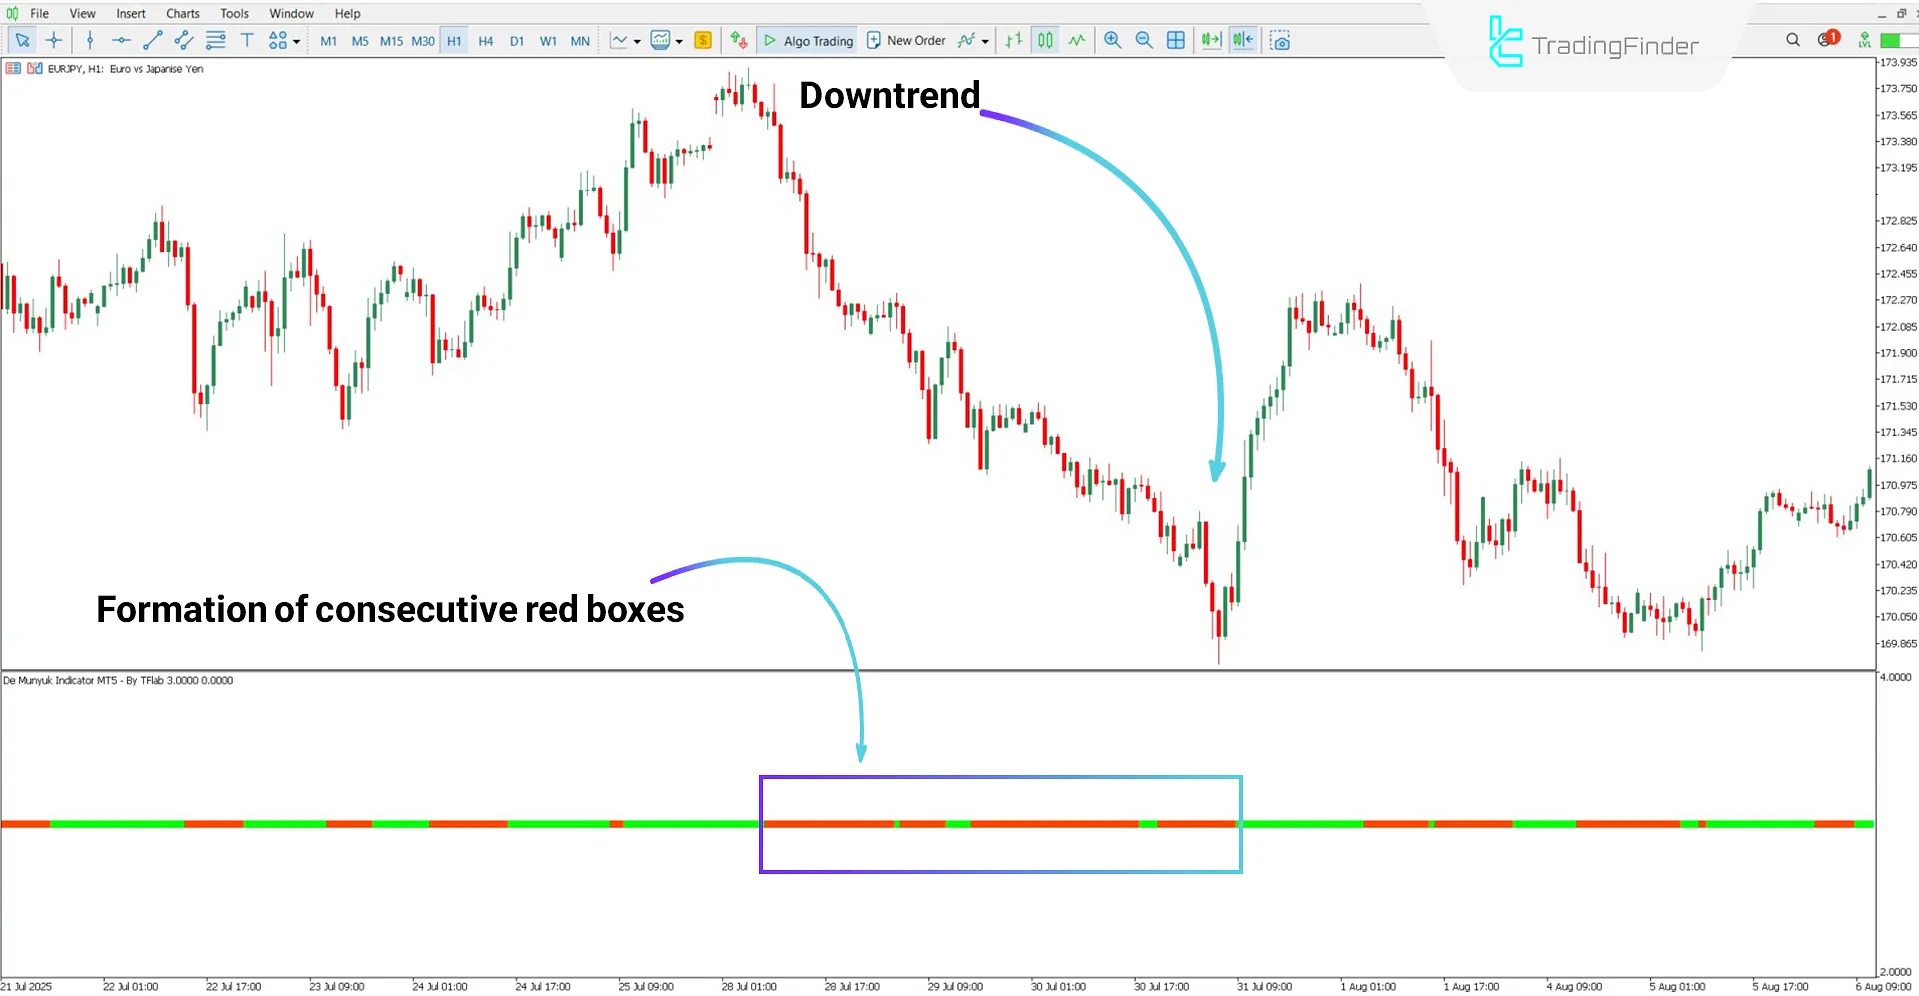
As shown in the EUR/JPY currency pair chart in the 1-hour timeframe, the formation of red blocks serves as a warning of the start of a downward move.
Furthermore, the consecutive appearance of these red boxes is considered an indication of the continuation and strength of the bearish market trend.

De Munyuk Oscillator Settings
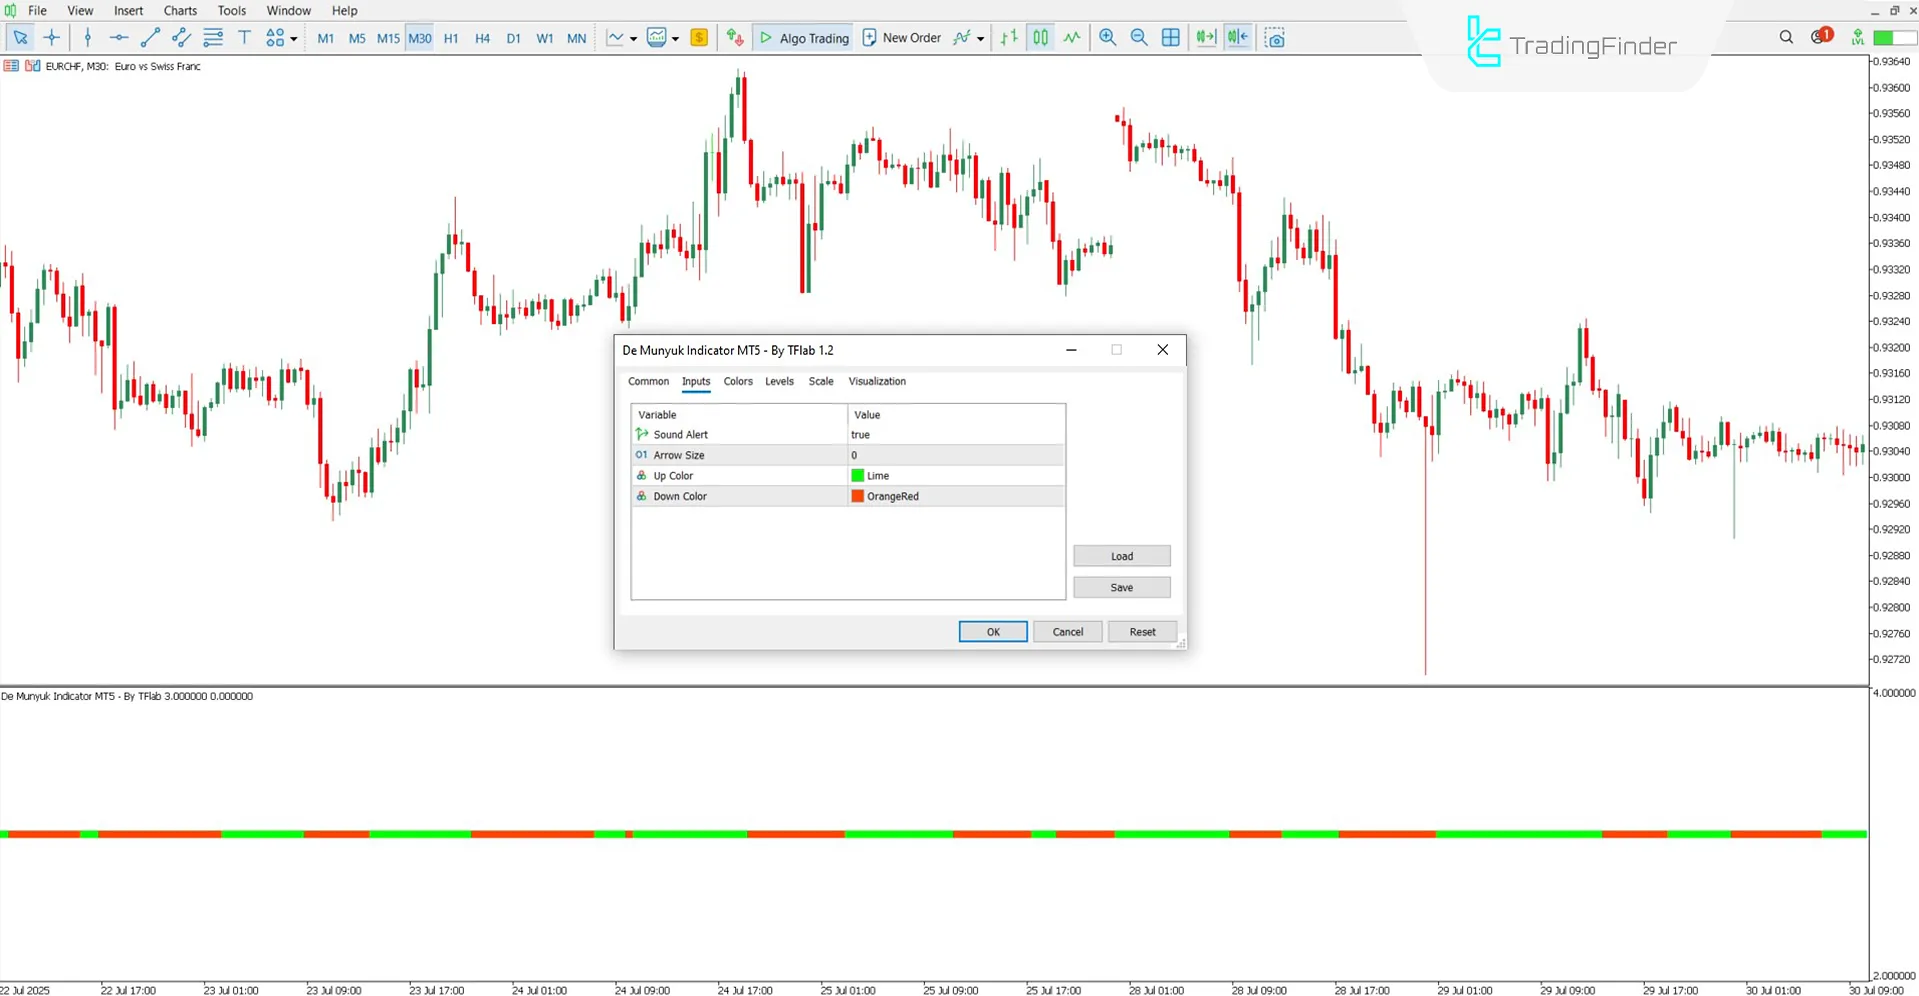
The settings section of the De Munyuk Oscillator is as follows:

- Sound Alert: Enable sound alert
- Arrow Size: Set the size of indicator elements
- Up Color: Define the color of bullish boxes
- Down Color: Define the color of bearish boxes
Conclusion
The De Munyuk Oscillator is a practical tool for precise and clear trend identification. The stability of bullish and bearish signals after candlestick closures increases its credibility and simplifies decision-making for entering buy and sell positions.
It should also be noted that this oscillator is capable of providing sound alerts, which users can activate through the settings section.
Does this indicator display trading volume?
No, the De Munyuk Oscillator is designed to show price direction.
What does the consecutive formation of green boxes mean?
The consecutive formation of green boxes in the De Munyuk Indicator demonstrates the continuation of a bullish trend.


