![DeMark Trend Lines Indicator on MetaTrader 5 Download - [TradingFinder]](https://cdn.tradingfinder.com/image/339034/2-51-en-demark-trend-lines-mt5-1.webp)
![DeMark Trend Lines Indicator on MetaTrader 5 Download - [TradingFinder] 0](https://cdn.tradingfinder.com/image/339034/2-51-en-demark-trend-lines-mt5-1.webp)
![DeMark Trend Lines Indicator on MetaTrader 5 Download - [TradingFinder] 1](https://cdn.tradingfinder.com/image/339035/2-51-en-demark-trend-lines-mt5-2.webp)
![DeMark Trend Lines Indicator on MetaTrader 5 Download - [TradingFinder] 2](https://cdn.tradingfinder.com/image/339042/2-51-en-demark-trend-lines-mt5-3.webp)
![DeMark Trend Lines Indicator on MetaTrader 5 Download - [TradingFinder] 3](https://cdn.tradingfinder.com/image/339040/2-51-en-demark-trend-lines-mt5-4.webp)
The DeMark Trend Lines Indicator is a technical analysistool in MetaTrader 5 that draws trend lines using algorithms based on pivot points and fractals.
When the price either breaks or bounces off one of these lines, this behavior can be interpreted as a signal to enter a trade in the direction of the breakout or reversal.
DeMark Trend Lines Specification Table
The following table summarizes the features of the DeMark Trend Lines Indicator on the MetaTrader 5 platform.
Indicator Categories: | Pivot Points & Fractals MT5 Indicators Trading Assist MT5 Indicators Levels MT5 Indicators |
Platforms: | MetaTrader 5 Indicators |
Trading Skills: | Intermediate |
Indicator Types: | Breakout MT5 Indicators |
Timeframe: | Multi-Timeframe MT5 Indicators |
Trading Style: | Intraday MT5 Indicators |
Trading Instruments: | Forex MT5 Indicators Crypto MT5 Indicators Stock MT5 Indicators Forward MT5 Indicators |
Uptrend Conditions
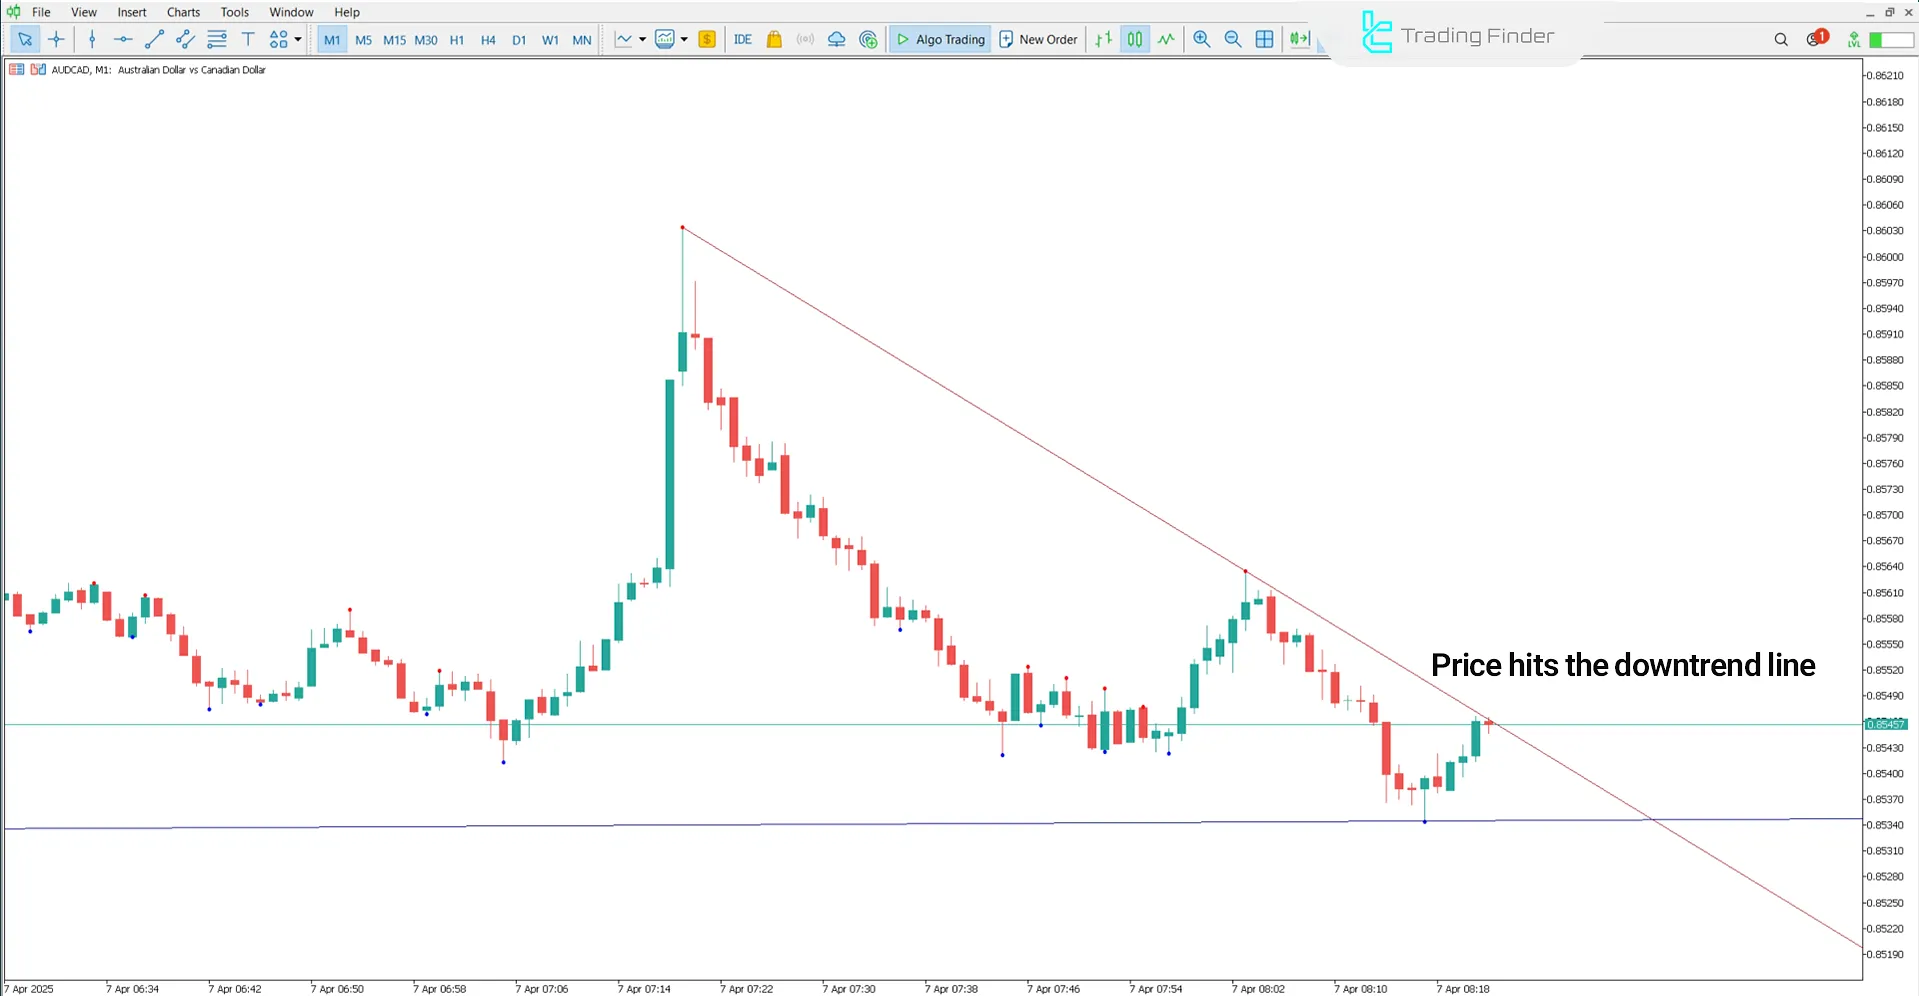
In the AUD/CAD currency pair chart on a 1-minute timeframe, the price reacts to the downward trend line (red).
If the price stabilizes above this line, the likelihood of a short-term trend reversal increases.

Downtrend Conditions
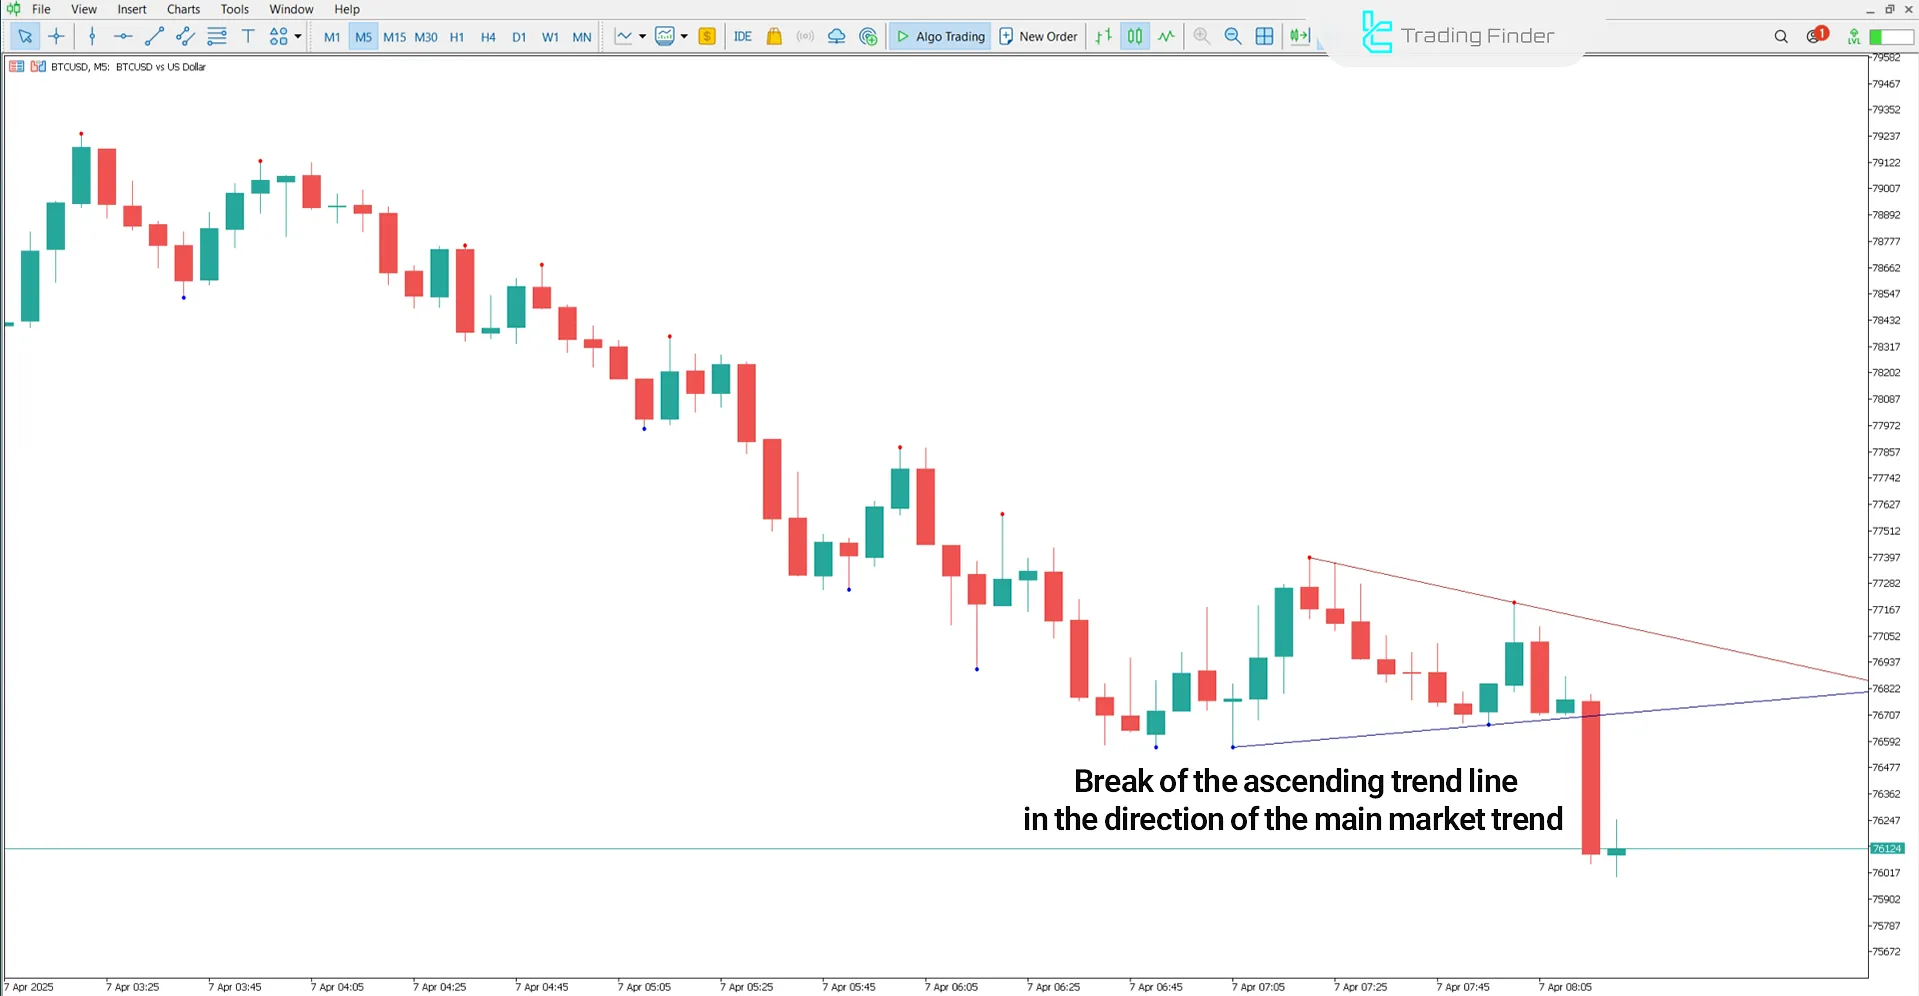
The image below shows the Bitcoin price chart in a 5-minute timeframe. This chart breaks the upward trend line by a strong bearish candle, and the price stabilizes below this line.
This break and confirmation can signal continued selling pressure and an increased likelihood of further price decline in line with the overall trend.

Indicator Settings
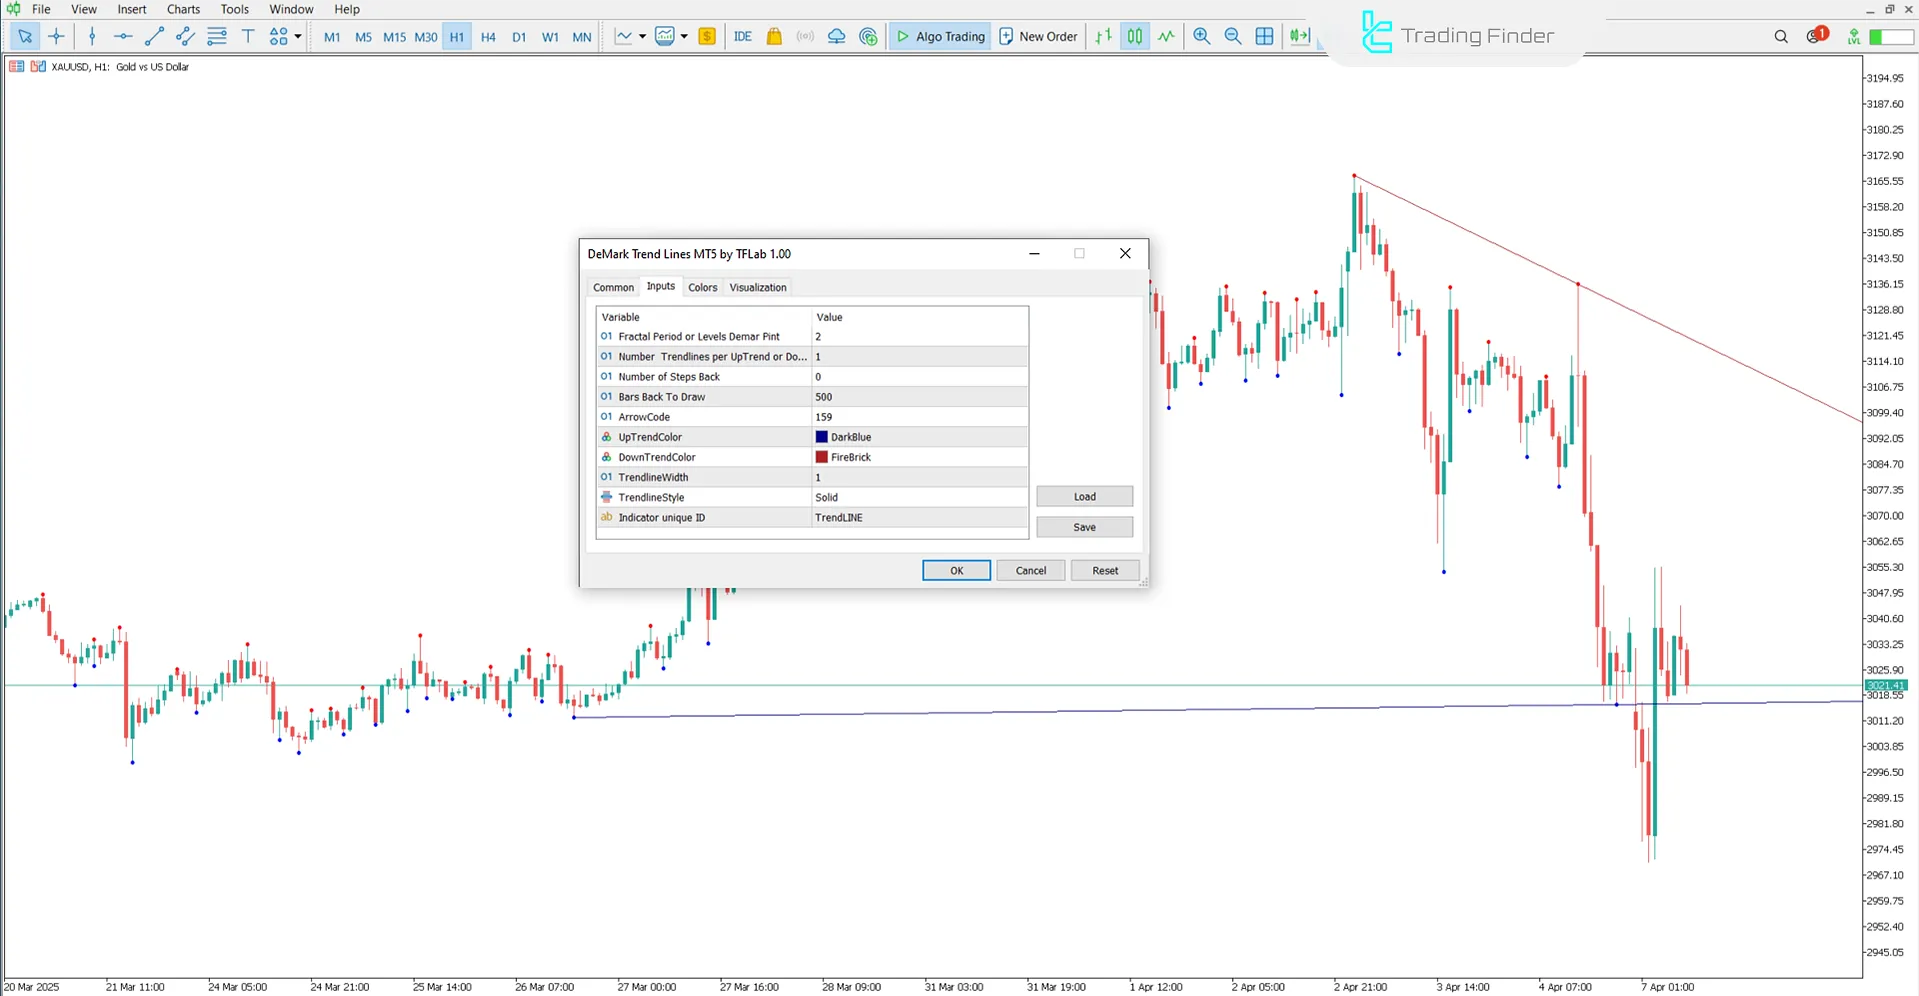
The adjustable parameters of the DeMark Trend Lines Indicator are shown in the image below:

- Fractal Period or Levels Demar Pint: Fractal period or number of levels to identify DeMark points
- Number Trend lines per Up Trend or Down Trend: Number of trend lines per uptrend or downtrend
- Number of Steps Back: Number of past candles to ignore
- Bars Back To Draw: Number of candles to scan backward for drawing
- Arrow Code: Code for the arrow symbol
- Trend Color: Color of uptrend lines
- Down Trend Color: Color of downtrend lines
- Trend line Width: Width of drawn trend lines
- Trend line Style: Style of trend lines
- Indicator unique ID: Unique ID of the indicator
Conclusion
The DeMark Trend Lines Indicator is a practical tool in technical analysis. It is designed to identify major trends, key price reversal zones, and critical levels.
The indicator clearly visualizes the market structure and price trend shifts by automatically drawing diagonal and horizontal trend lines based on pivot points.
DeMark Trend Lines Meta MT5 PDF
DeMark Trend Lines Meta MT5 PDF
Click to download DeMark Trend Lines Meta MT5 PDFWhat is the primary function of the DeMark Trend Lines Indicator?
This trading tool's main functions are to identify reversal points, analyze the main trend, and detect trend structure breakouts or continuations.
What do the red and blue lines represent in the DeMark Trend Lines Indicator?
In this indicator, the red line represents a downtrend, and the blue line indicates an uptrend, both drawn based on pivot points.


