![Detrended Synthetic Price Indicator MetaTrader 5 - Free Download [TradingFinder]](https://cdn.tradingfinder.com/image/587540/2-158-en-detrended-synthetic-price-mt5-1.webp)
![Detrended Synthetic Price Indicator MetaTrader 5 - Free Download [TradingFinder] 0](https://cdn.tradingfinder.com/image/587540/2-158-en-detrended-synthetic-price-mt5-1.webp)
![Detrended Synthetic Price Indicator MetaTrader 5 - Free Download [TradingFinder] 1](https://cdn.tradingfinder.com/image/587544/2-158-en-detrended-synthetic-price-mt5-2.webp)
![Detrended Synthetic Price Indicator MetaTrader 5 - Free Download [TradingFinder] 2](https://cdn.tradingfinder.com/image/587543/2-158-en-detrended-synthetic-price-mt5-3png.webp)
![Detrended Synthetic Price Indicator MetaTrader 5 - Free Download [TradingFinder] 3](https://cdn.tradingfinder.com/image/587545/2-158-en-detrended-synthetic-price-mt5-4.webp)
The Detrended Synthetic Price Indicator was designed by John Ehlers. This trading tool facilitates the analysis of short-term cycles by removing long-term trends from the price chart.
The indicator detrends price data and is useful in analyzing overbought and oversold conditions as well as identifying reversals within shorter timeframes. The output of this indicator is displayed as a colored histogram at the bottom of the chart.
Detrended Synthetic Price Indicator Table
The table below shows the general features of the Detrended Synthetic Price Indicator.
Indicator Categories: | Oscillators MT5 Indicators Signal & Forecast MT5 Indicators Trading Assist MT5 Indicators |
Platforms: | MetaTrader 5 Indicators |
Trading Skills: | Intermediate |
Indicator Types: | Reversal MT5 Indicators |
Timeframe: | Multi-Timeframe MT5 Indicators |
Trading Style: | Intraday MT5 Indicators |
Trading Instruments: | Forex MT5 Indicators Crypto MT5 Indicators Stock MT5 Indicators |
Detrended Synthetic Price Indicator at a Glance
The Detrended Synthetic Price Oscillator is a technical analysis tool on the MetaTrader 5 platform that removes long-term price trends and focuses on short-term market fluctuations.
This tool usually applies filters such as the Hilbert Filter or Linear Regression to separate price trends and then displays only oscillatory changes as follows:
- Green lines are signals of short-term bullish trends;
- Red lines indicate changes in short-term bearish trends.
Note: This oscillator is designed to simulate market fluctuations without the influence of long-term trends.
Indicator in a Bullish Trend
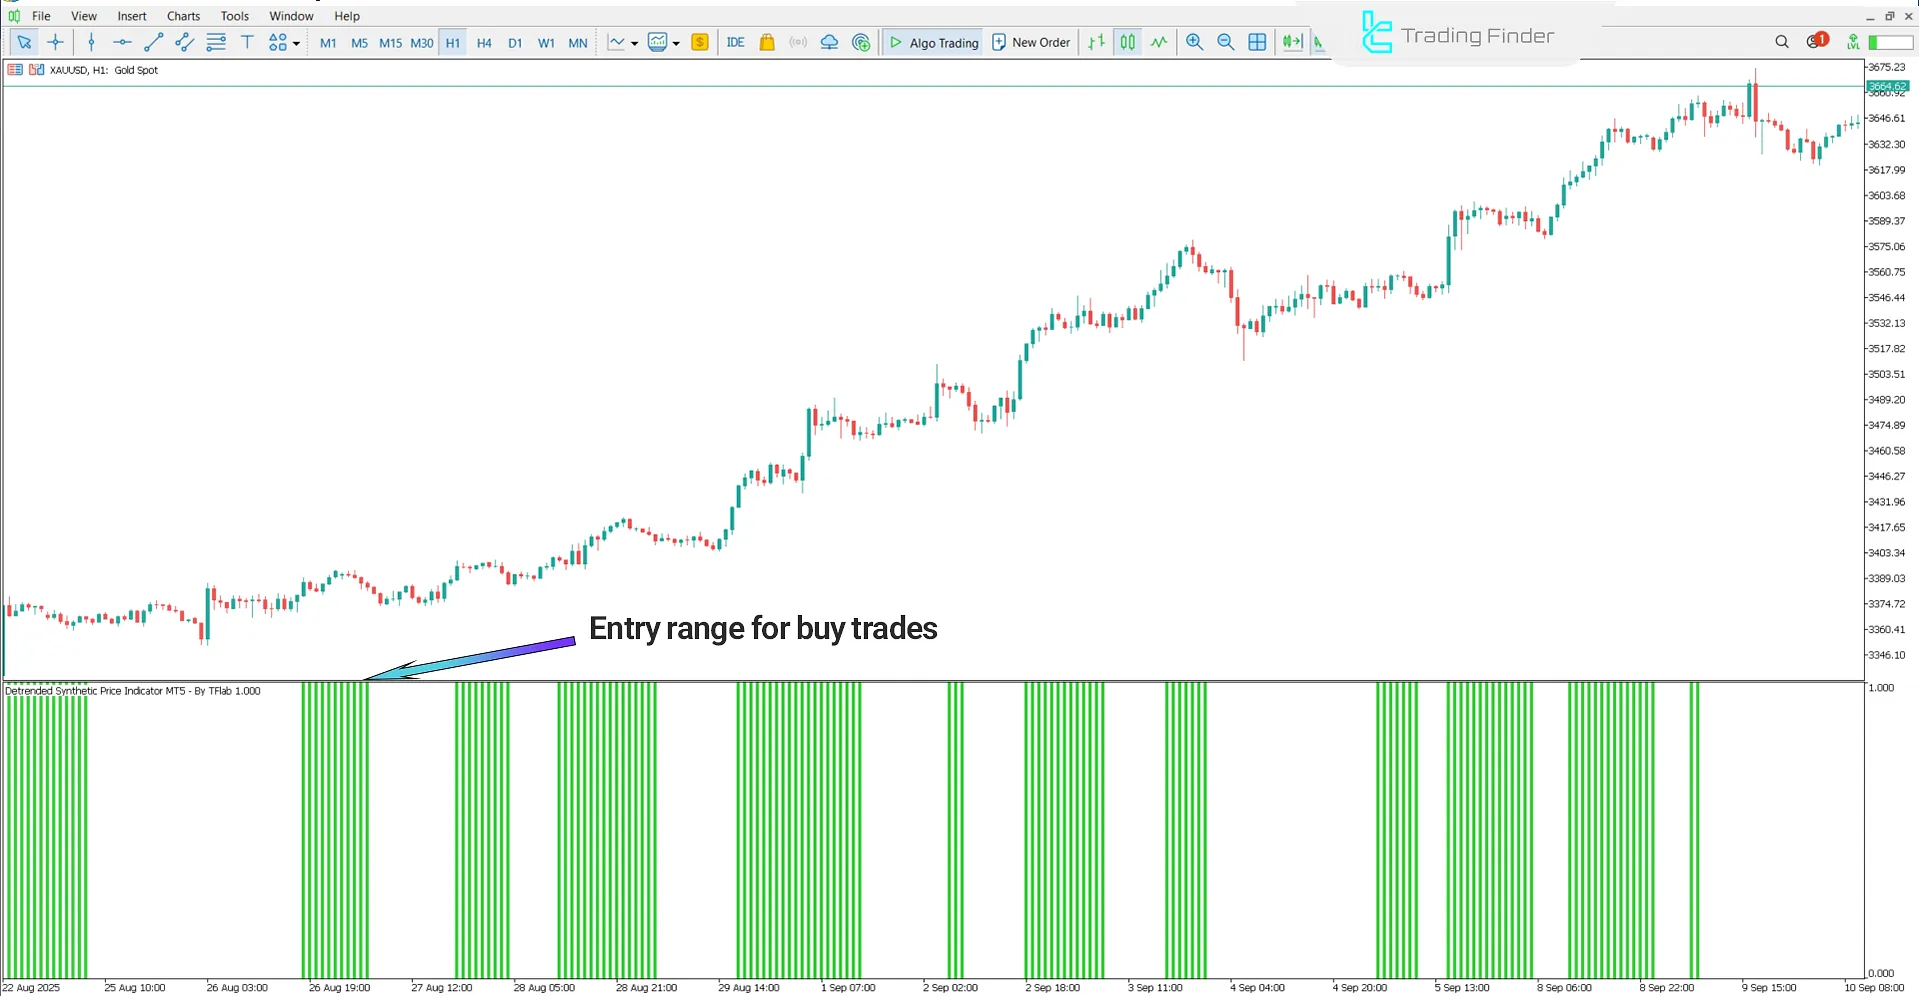
The chart below shows the global gold index (XAU/USD) on the 1-hour timeframe. The appearance of green lines in the oscillator represents positive fluctuations or an upward trend. When these green lines appear consecutively with an upward slope, they indicate the beginning of a bullish trend and create favorable conditions for entering buy trades.

Indicator in a Bearish Trend
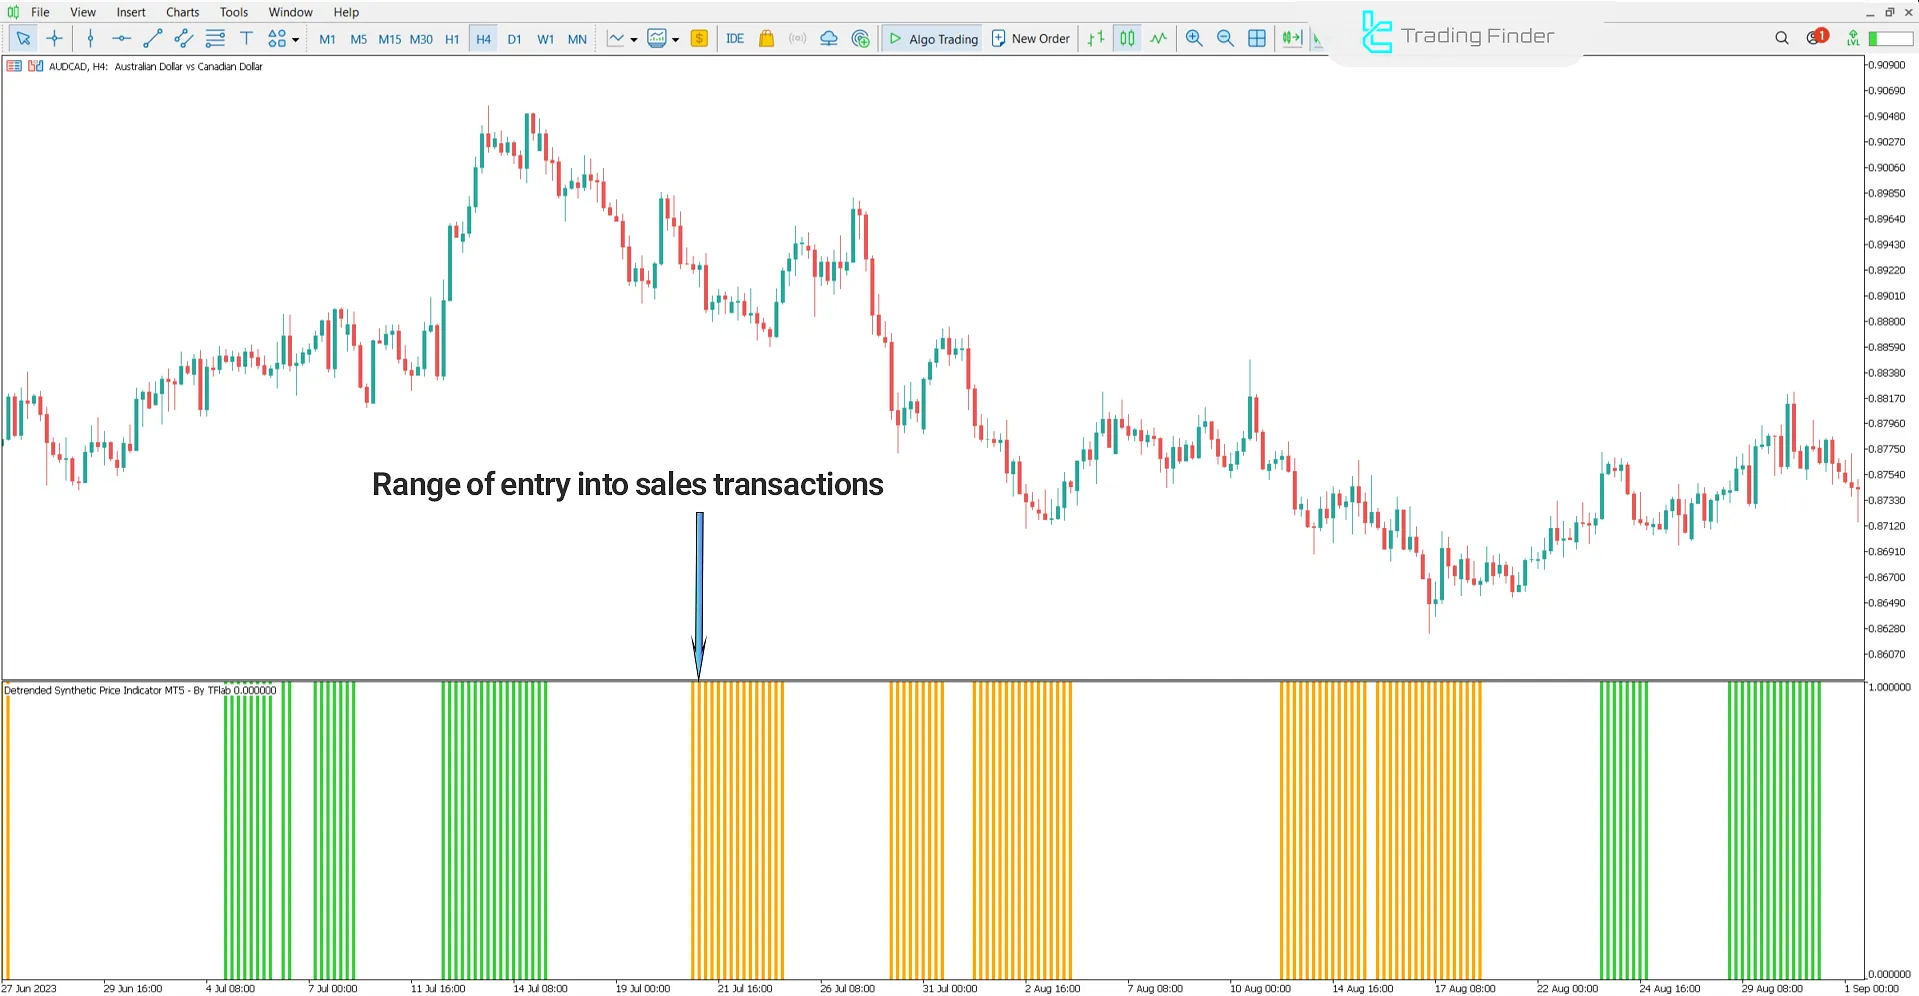
The chart below shows the Australian Dollar vs Canadian Dollar (AUD/CAD) on the 4-hour timeframe.
The appearance of red lines at the bottom of the chart indicates a short-term bearish trend. These lines highlight negative market changes and show a decline in price within a specific timeframe.

Detrended Synthetic Price Indicator Settings
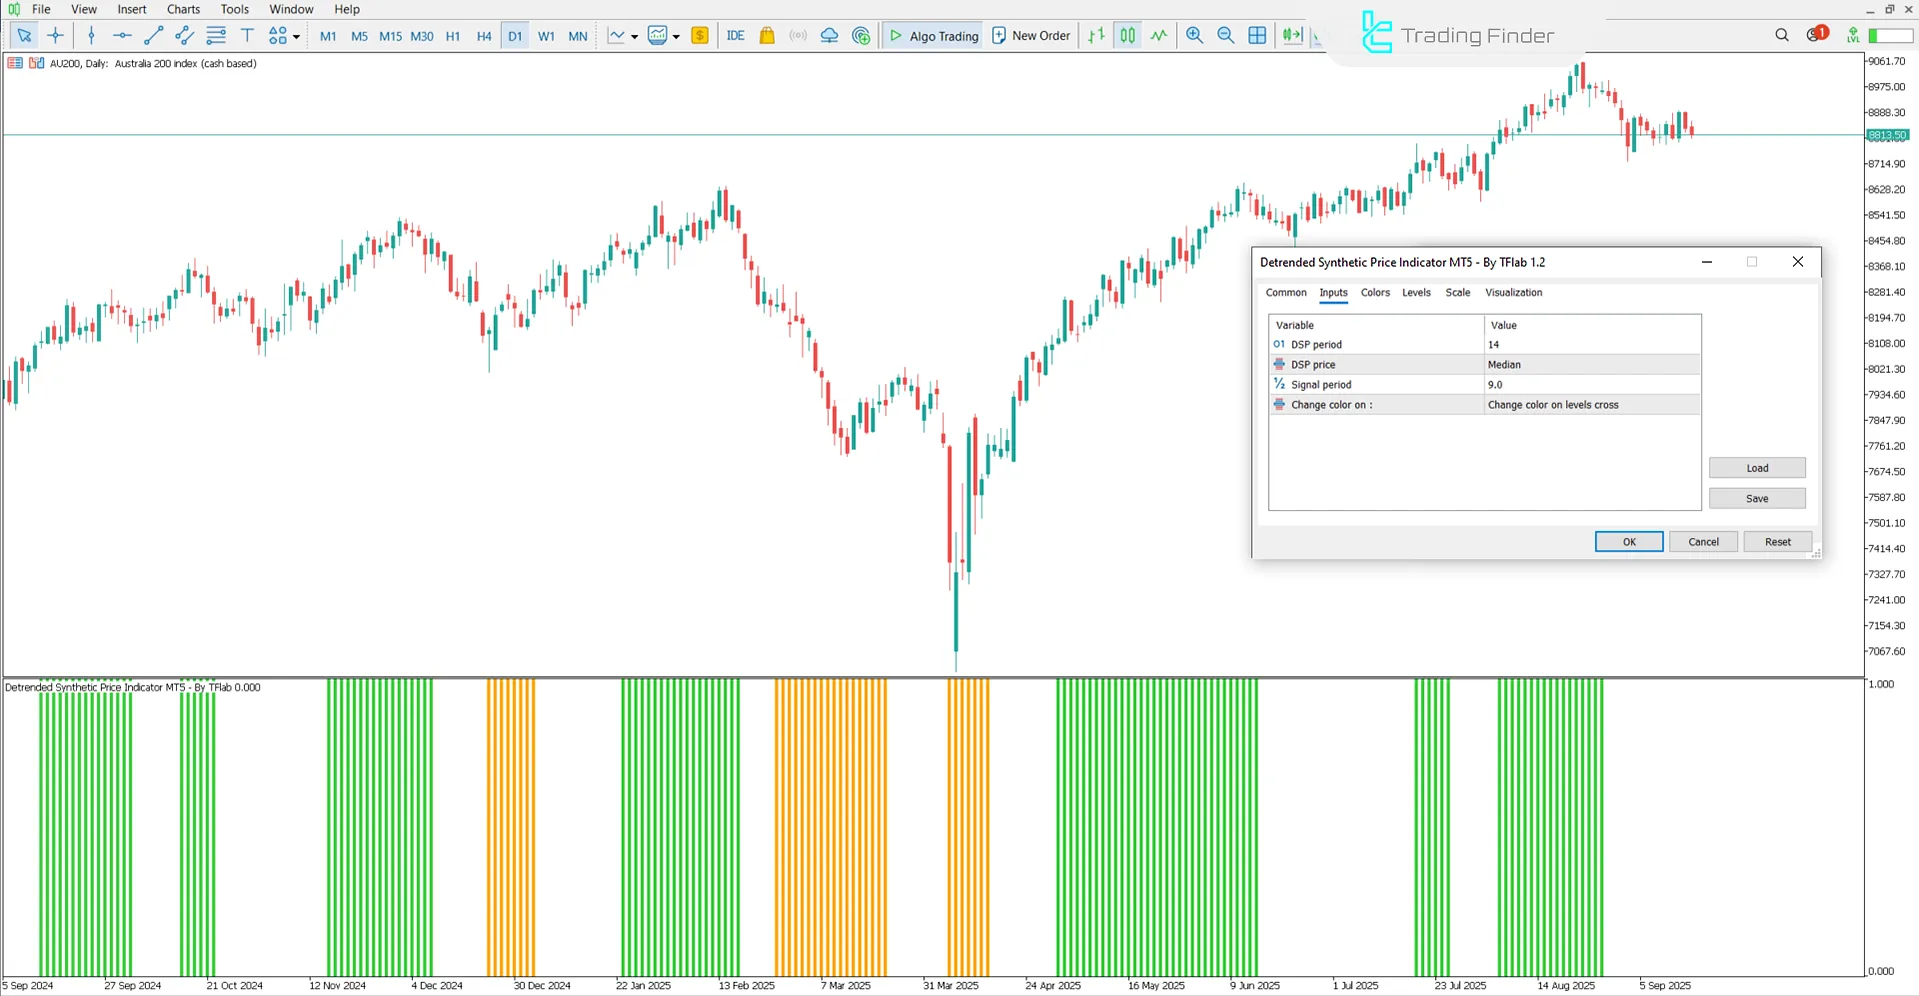
The image below shows the settings of the Detrended Synthetic Price Indicator:

- DSP period: Calculation period for the DSP parameter
- DSP price: Calculation of the median DSP price
- Signal period: Signal period calculation
- Change color on: Color change based on settings
Conclusion
The Detrended Synthetic Price Oscillator (DSP) is an effective tool in technical analysis that removes the impact of long-term trends from price data.
This trading tool focuses on short-term market fluctuations and provides more precise signals of real-time price changes.
Detrended Synthetic Price Indicator MetaTrader 5 PDF
Detrended Synthetic Price Indicator MetaTrader 5 PDF
Click to download Detrended Synthetic Price Indicator MetaTrader 5 PDFHow is the output of the Detrended Synthetic Price Indicator displayed?
The output of this indicator is shown as a colored histogram at the bottom of the chart. This histogram represents positive and negative market fluctuations with green and red lines.
Is the Detrended Synthetic Price Indicator usable for all timeframes?
Yes; this oscillator can be applied across all timeframes but provides greater accuracy on shorter timeframes.


