![Didi Index Indicator for MT5 Download – Free – [TradingFinder]](https://cdn.tradingfinder.com/image/524727/13-203-en-didi-index-mt5-01.webp)
![Didi Index Indicator for MT5 Download – Free – [TradingFinder] 0](https://cdn.tradingfinder.com/image/524727/13-203-en-didi-index-mt5-01.webp)
![Didi Index Indicator for MT5 Download – Free – [TradingFinder] 1](https://cdn.tradingfinder.com/image/524725/13-203-en-didi-index-mt5-02.webp)
![Didi Index Indicator for MT5 Download – Free – [TradingFinder] 2](https://cdn.tradingfinder.com/image/524726/13-203-en-didi-index-mt5-03.webp)
![Didi Index Indicator for MT5 Download – Free – [TradingFinder] 3](https://cdn.tradingfinder.com/image/524728/13-203-en-didi-index-mt5-04.webp)
The Didi Index indicator, using two oscillating lines in green and yellow, visually displays the status and intensity of the trend.
In addition to these two lines, a central line is also included, which acts as a reference or equilibrium level.
Comparing the positions of the oscillating lines with one another and their relation to the central line provides a framework for evaluating market conditions and entering trades.
Didi Index Indicator Specifications Table
The table below includes the specifications of the Didi Index indicator:
Indicator Categories: | Oscillators MT5 Indicators Signal & Forecast MT5 Indicators Currency Strength MT5 Indicators |
Platforms: | MetaTrader 5 Indicators |
Trading Skills: | Elementary |
Indicator Types: | Reversal MT5 Indicators |
Timeframe: | Multi-Timeframe MT5 Indicators |
Trading Style: | Swing Trading MT5 Indicators Scalper MT5 Indicators Day Trading MT5 Indicators |
Trading Instruments: | Forex MT5 Indicators Crypto MT5 Indicators Stock MT5 Indicators Commodity MT5 Indicators Indices MT5 Indicators Share Stock MT5 Indicators |
Didi Index Indicator at a Glance
Trading signals in the Didi Index indicator are determined based on the positions of the oscillating lines relative to the central line.
These positions are described as follows:
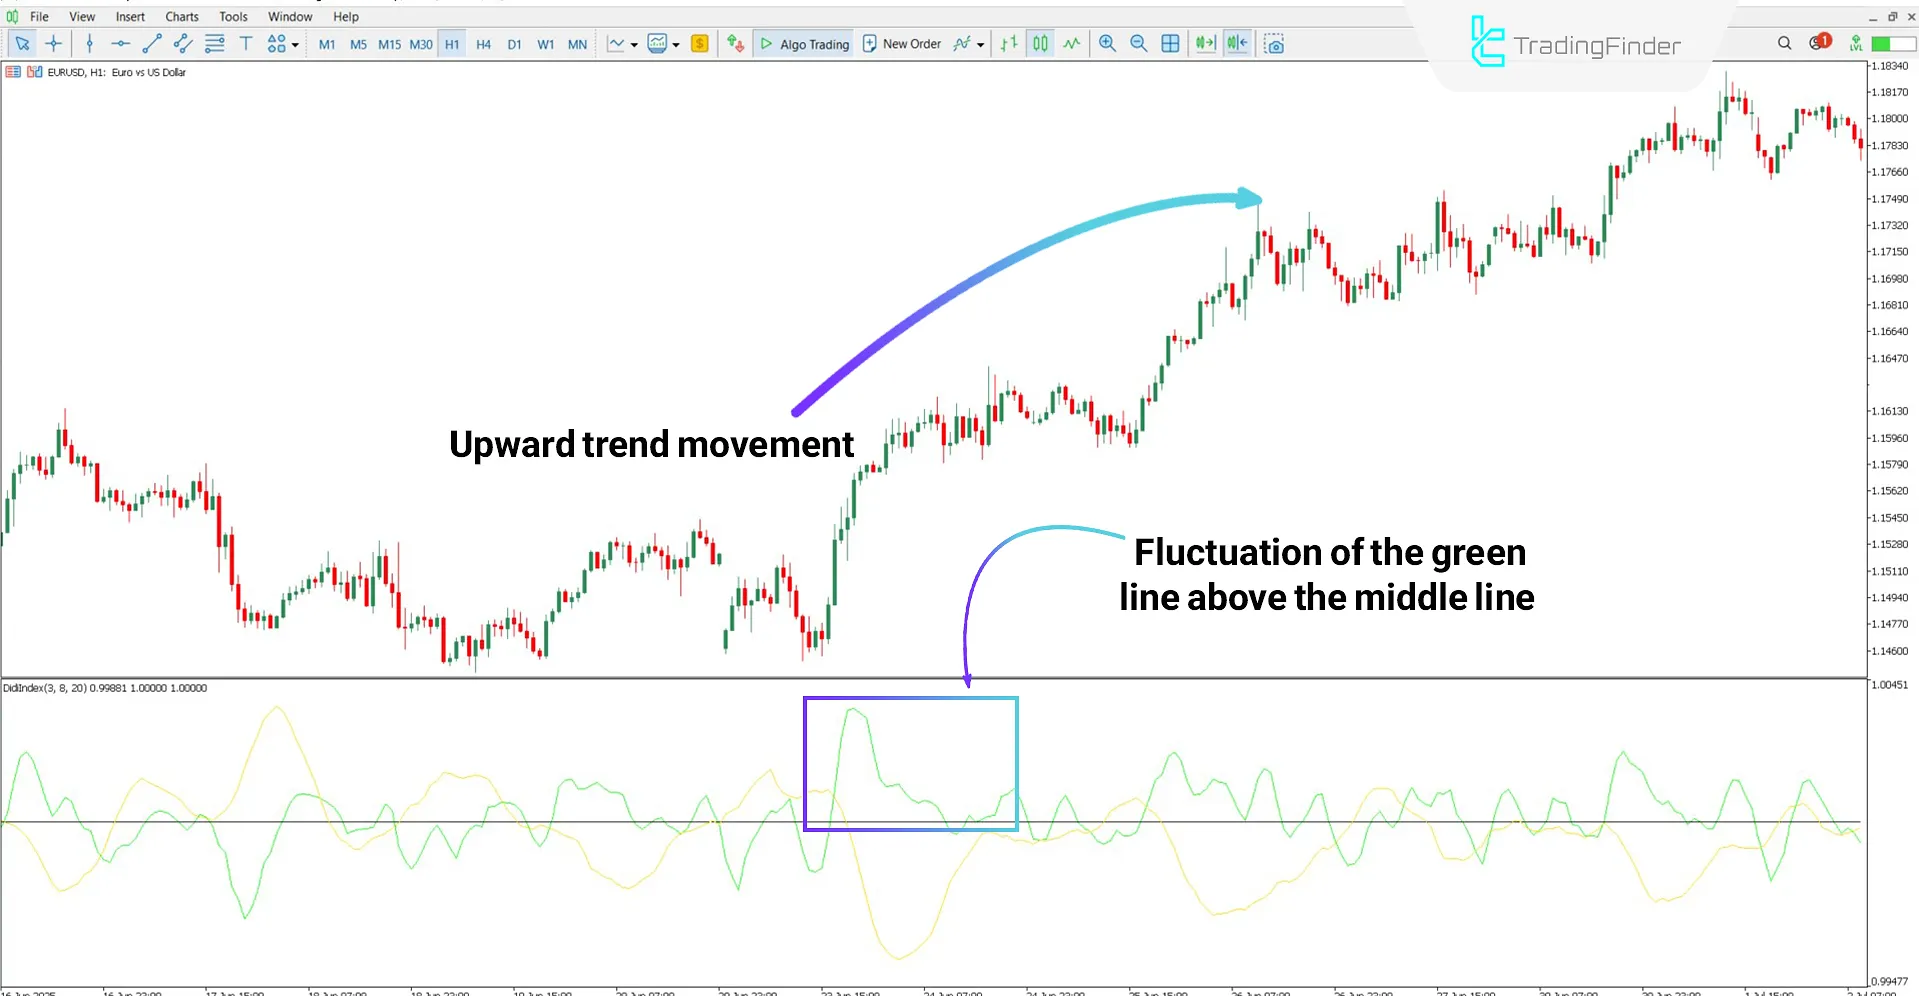
- Buy Signal: When the green line is positioned above the central line, it indicates stronger buying pressure and the beginning or continuation of an uptrend;
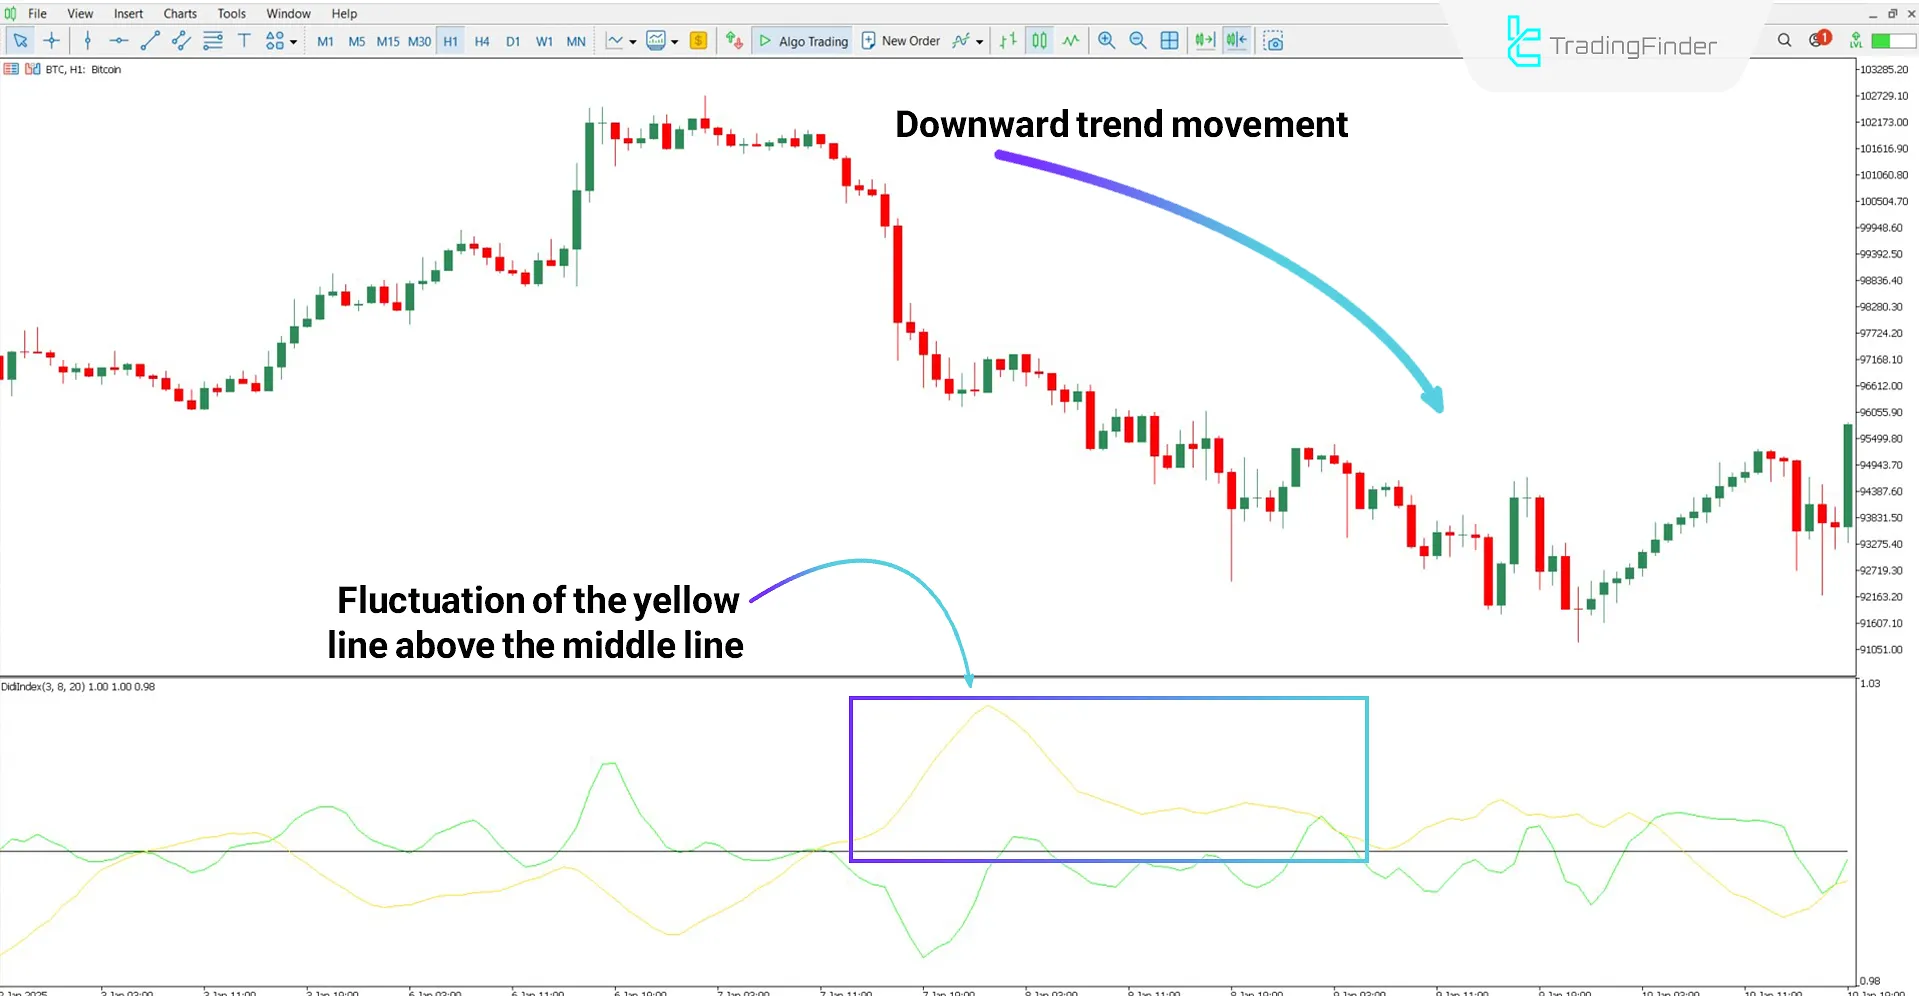
- Sell Signal: When the yellow line moves in an area above the central line, it indicates selling pressure and a downtrend.
Uptrend Signal
According to the EUR/USD one-hour chart, the green line oscillates above the central line, and upon crossing above the oscillator midpoint, the price trend has turned bullish.

Downtrend Signal
Based on the Bitcoin (BTC) cryptocurrency chart, the yellow line is located above the central line; this condition signals the beginning or continuation of a bearish trend.

Didi Index Indicator Settings
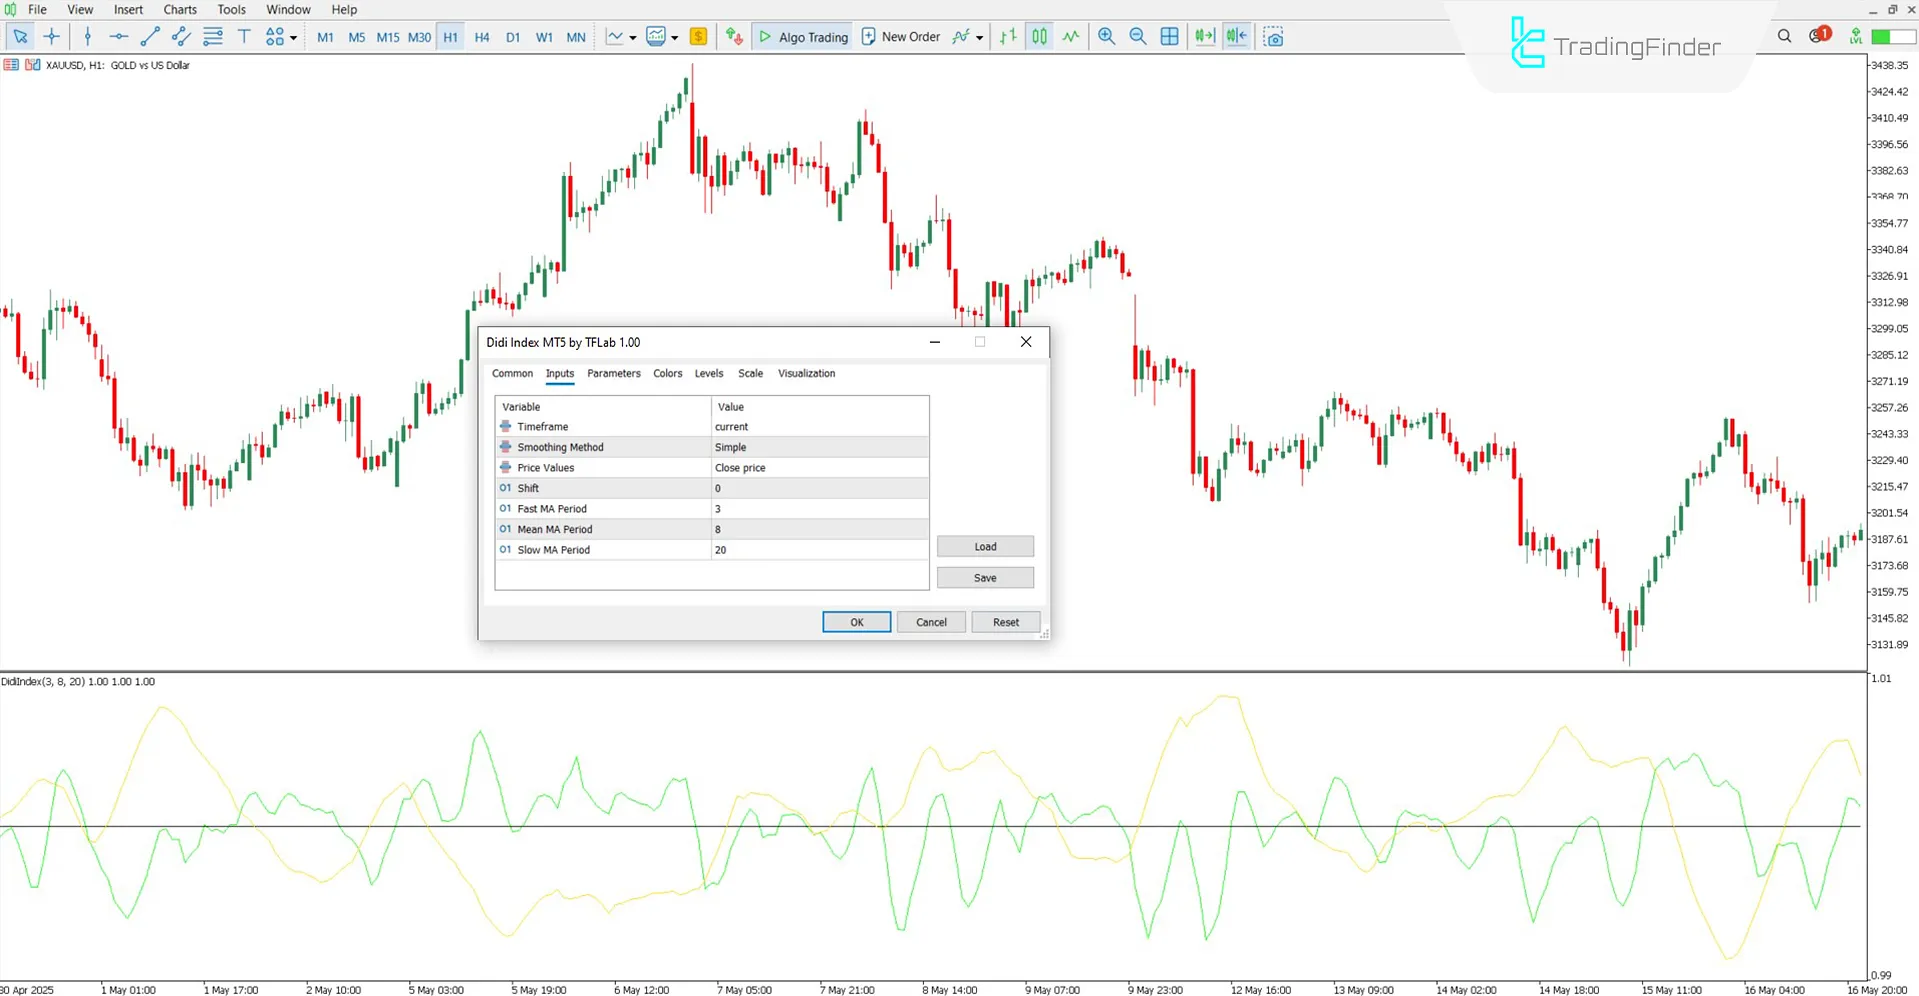
The settings of the Didi Index indicator are as follows:

- Timeframe: Using the current chart timeframe
- Smoothing Method: Simple Moving Average (SMA) for calculations
- Price Values: Using candle closing prices
- Shift: Shifting indicator lines along the time axis
- Fast MA Period: Fast-moving average period
- Mean MA Period: Medium moving average period
- Slow MA Period: Slow-moving average period
Conclusion
The Didi Index indicator is a practical tool in technical analysis, utilizing three moving averages with different timeframes to determine suitable conditions for entering or exiting trades.
The primary purpose of this oscillator is to identify crossover moments of the lines as signals for trade execution.
Didi Index Indicator for MT5 PDF
Didi Index Indicator for MT5 PDF
Click to download Didi Index Indicator for MT5 PDFCan this indicator be used in smaller timeframes?
Yes, the Didi Index indicator is multi-timeframe and can be used in all timeframes.
On what basis are trading signals generated?
Trading signals are generated according to the position of the lines relative to the central line.


