![DMI ADX Histogram Indicator for MetaTrader 5 Download - Free - [TFlab]](https://cdn.tradingfinder.com/image/154911/4-17-en-dmi-adx-histogram-oscillator-mt5-1.webp)
![DMI ADX Histogram Indicator for MetaTrader 5 Download - Free - [TFlab] 0](https://cdn.tradingfinder.com/image/154911/4-17-en-dmi-adx-histogram-oscillator-mt5-1.webp)
![DMI ADX Histogram Indicator for MetaTrader 5 Download - Free - [TFlab] 1](https://cdn.tradingfinder.com/image/154878/4-17-en-dmi-adx-histogram-oscillator-mt5-2.webp)
![DMI ADX Histogram Indicator for MetaTrader 5 Download - Free - [TFlab] 2](https://cdn.tradingfinder.com/image/154879/4-17-en-dmi-adx-histogram-oscillator-mt5-3.webp)
![DMI ADX Histogram Indicator for MetaTrader 5 Download - Free - [TFlab] 3](https://cdn.tradingfinder.com/image/154881/4-17-en-dmi-adx-histogram-oscillator-mt5-4.webp)
The DMI ADX Histogram Indicator is one of the trend analysis tools among the MetaTrader 5 indicators, helping traders to accurately identify and analyze market movements and trend strength.
An upward or downward ADX line indicates a trending market, while a flat and horizontal ADX line signifies stagnant trading.
This indicator is suitable for all markets and can be applied to all currency pairs.
Indicator Table
Indicator Categories: | Oscillators MT5 Indicators Pivot Points & Fractals MT5 Indicators Trading Assist MT5 Indicators |
Platforms: | MetaTrader 5 Indicators |
Trading Skills: | Intermediate |
Indicator Types: | Trend MT5 Indicators Leading MT5 Indicators |
Timeframe: | Multi-Timeframe MT5 Indicators |
Trading Style: | Day Trading MT5 Indicators |
Trading Instruments: | Forex MT5 Indicators Crypto MT5 Indicators Stock MT5 Indicators Forward MT5 Indicators Share Stock MT5 Indicators |
Overview of the Indicator
This indicator is designed to analyze market trends (DMI) and their strength (ADX). Blue histogram bars indicate an uptrend, while red bars signify a downtrend. The ADX line is displayed in green. Traders can combine the DMI Histogram with the ADX line to integrate it into their trading strategies.
Indicator in an Uptrend
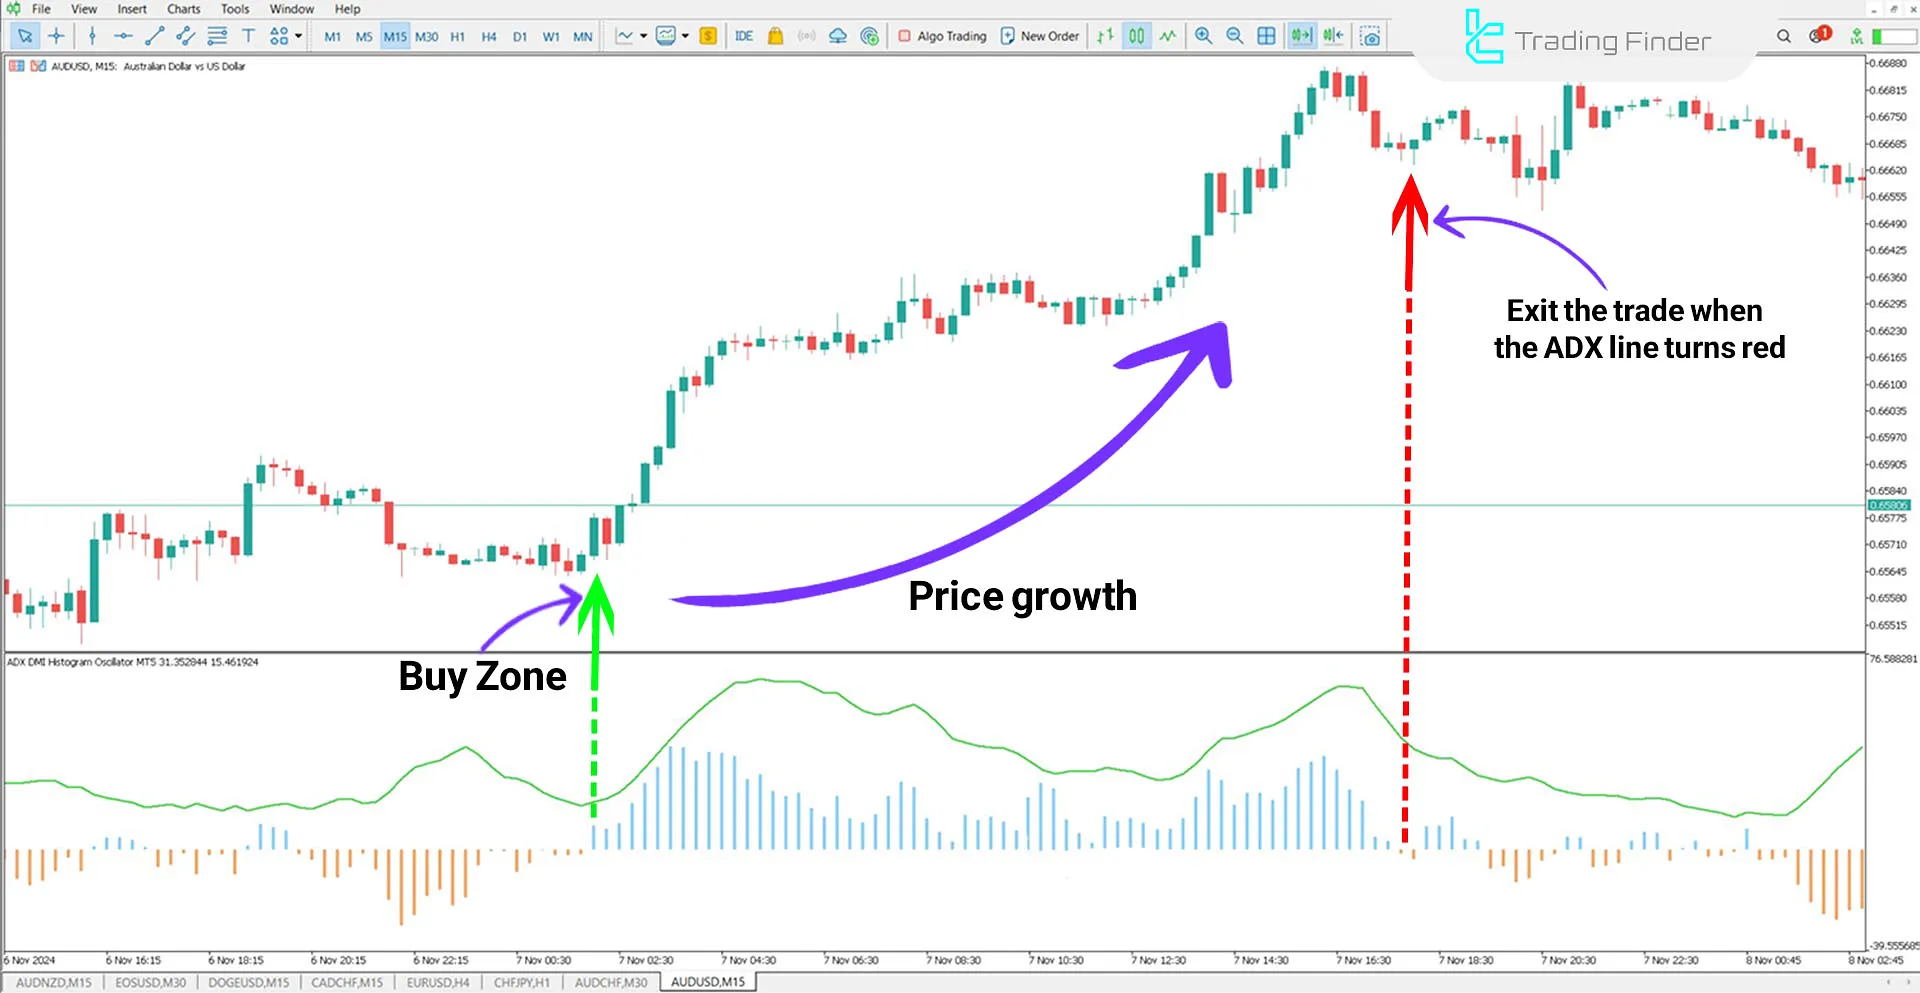
In the AUD/USD currency pair chart on the 15-minute timeframe, traders can enter a long position after the histogram bars turn blue.
Once the bar colors change and the necessary signals are confirmed, traders can exit the trade or secure profits.

Indicator in a Downtrend
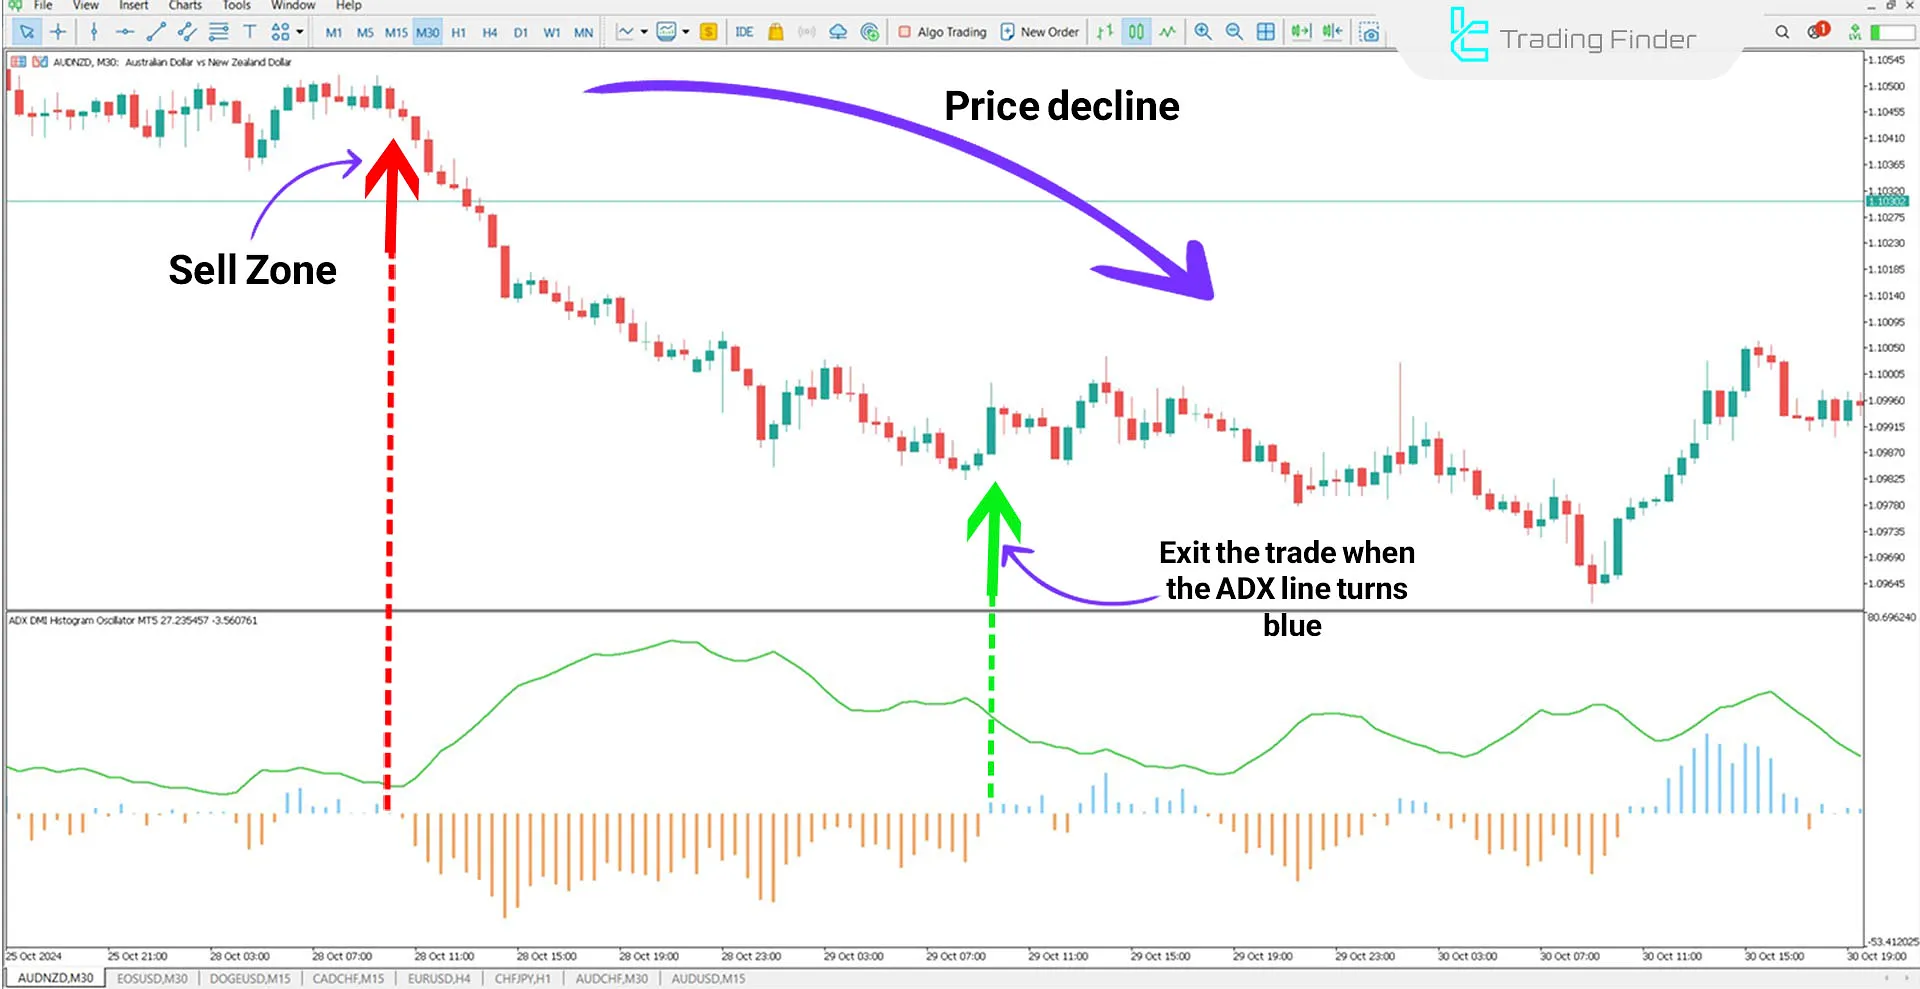
In a downtrend, the chart of the AUD/NZD currency pair on the 30-minute timeframe is displayed.
The indicator starts to decline after the trend changes, and traders can enter ashort position based on the histogram bar color changes and confirmation from their strategy.

Indicator Settings

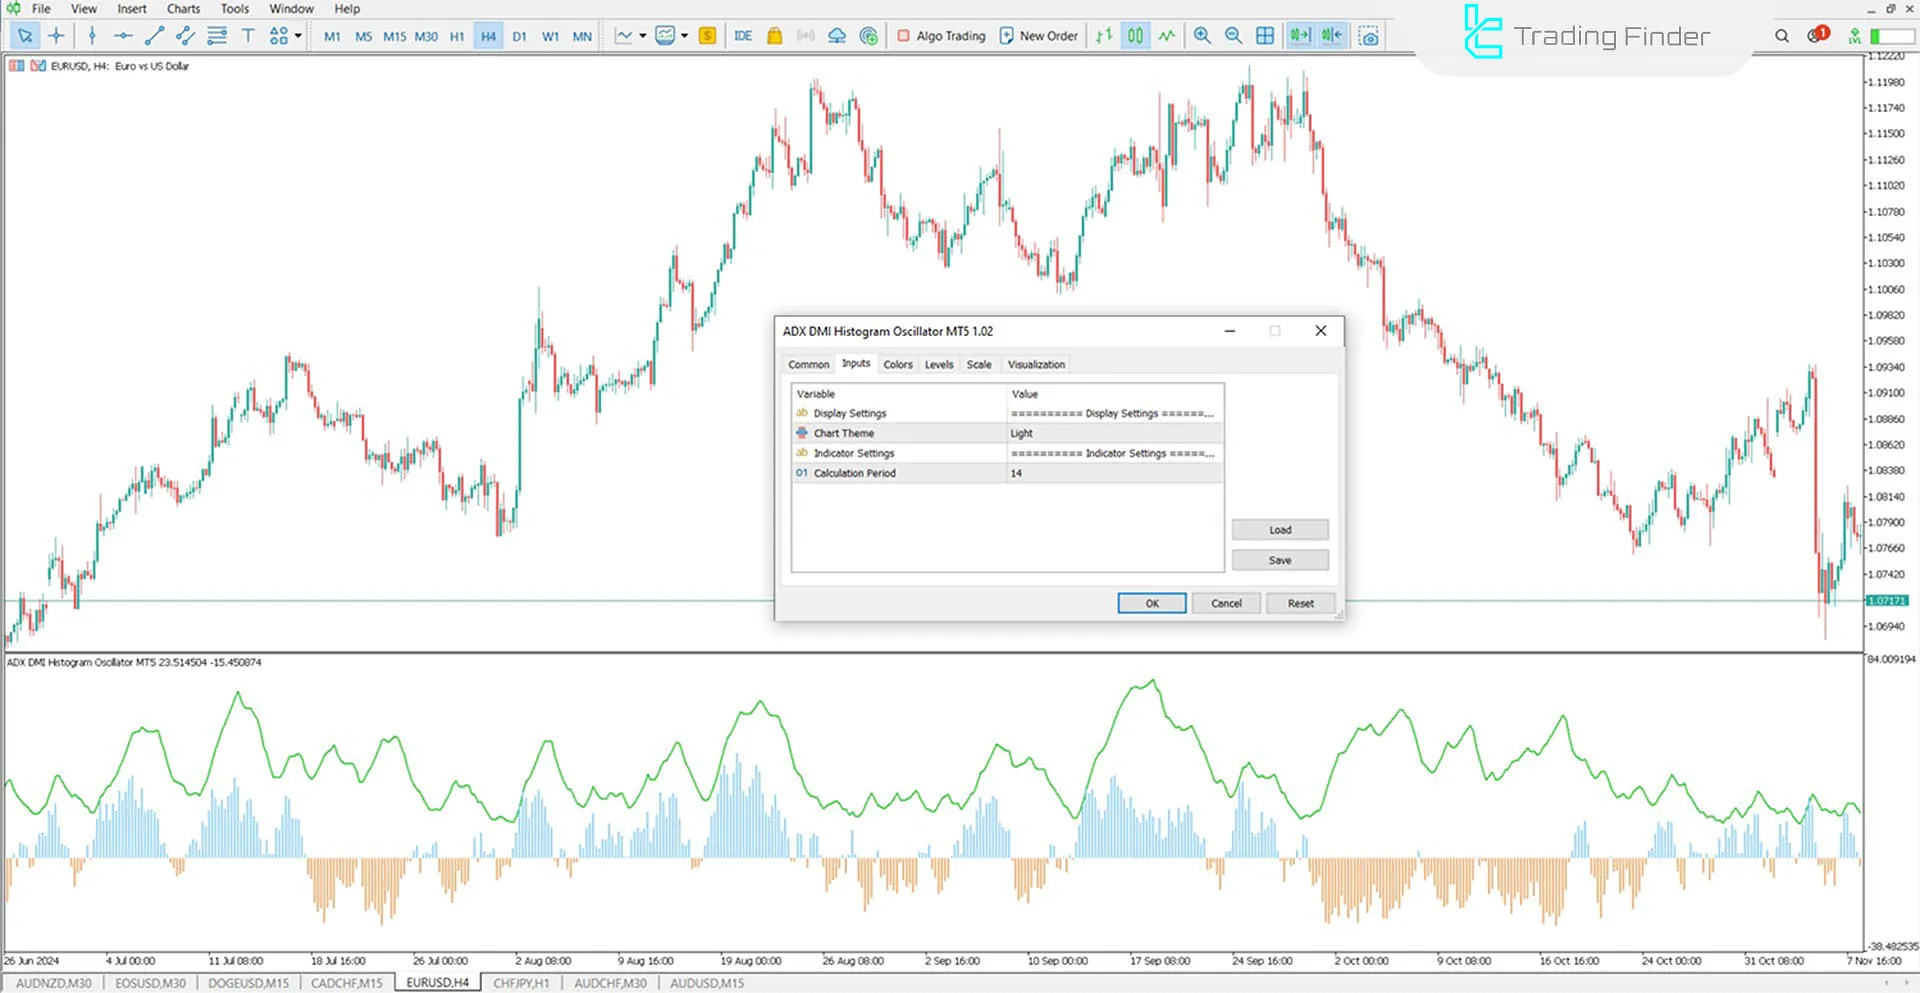
- Chart Theme: Background color of the chart;
- Ma Period: The calculation period for ADX, default set to 14.
Conclusion
The ADX Histogram Indicator (DMI ADX Histogram Oscillator) is one of the MetaTrader 5 oscillators, serving as a practical tool for identifying trends and market strength.
Using theADX line and the DMI Histogram, it helps traders determine the direction and strength of trends. Green histogram bars represent an uptrend, while red histogram bars indicate a downtrend.
Traders can use this indicator for various currency pairs and timeframes.
DMI ADX Histogram MT5 PDF
DMI ADX Histogram MT5 PDF
Click to download DMI ADX Histogram MT5 PDFWhat is the ADX Histogram Indicator?
This indicator combines ADX and DMI to identify market trend direction and strength. Green histograms indicate an uptrend, while red histograms represent a downtrend.
When should this indicator be used?
This indicator is suitable for identifying strong trends and determining entry and exit points across different timeframes.


