![Dollar Index DXY indicator MT5 Download - Free - [TradingFinder]](https://cdn.tradingfinder.com/image/136519/13-43-en-dollar-index-dxy-mt5-1.webp)
![Dollar Index DXY indicator MT5 Download - Free - [TradingFinder] 0](https://cdn.tradingfinder.com/image/136519/13-43-en-dollar-index-dxy-mt5-1.webp)
![Dollar Index DXY indicator MT5 Download - Free - [TradingFinder] 1](https://cdn.tradingfinder.com/image/136518/13-43-en-dollar-index-dxy-mt5-2.webp)
![Dollar Index DXY indicator MT5 Download - Free - [TradingFinder] 2](https://cdn.tradingfinder.com/image/136534/13-43-en-dollar-index-dxy-mt5-3.webp)
![Dollar Index DXY indicator MT5 Download - Free - [TradingFinder] 3](https://cdn.tradingfinder.com/image/136532/13-43-en-dollar-index-dxy-mt5-4.webp)
The DXY indicator is an essential and practical tool in MetaTrader 5. This MT5 volatility indicator measures the strength of the U.S. Dollar against other currencies and assets. It can be used alone or with other analytical tools as a significant guide in investment decision making.
Traders can gain insights into future price movements by examining the convergence and divergence between the U.S. Dollar and other currencies.
Indicator Specifications Table
Indicator Categories: | Oscillators MT5 Indicators Volatility MT5 Indicators Trading Assist MT5 Indicators |
Platforms: | MetaTrader 5 Indicators |
Trading Skills: | Intermediate |
Indicator Types: | Reversal MT5 Indicators |
Timeframe: | Multi-Timeframe MT5 Indicators |
Trading Style: | Swing Trading MT5 Indicators Day Trading MT5 Indicators |
Trading Instruments: | Forex MT5 Indicators Crypto MT5 Indicators Stock MT5 Indicators Commodity MT5 Indicators Forward MT5 Indicators Share Stock MT5 Indicators |
Dollar Index DXYIndicator at a Glance
The purpose of this index is to provide a precise picture of the strength or weakness of the U.S. Dollar compared to major global currencies. Therefore, it can be a useful tool for investors and analysts in financial markets. This MT5 trading assist indicator appears as an oscillator alongside the price chart and displays the value of the U.S. Dollar most simply, showing increases or decreases.
Bullish Trend Analysis
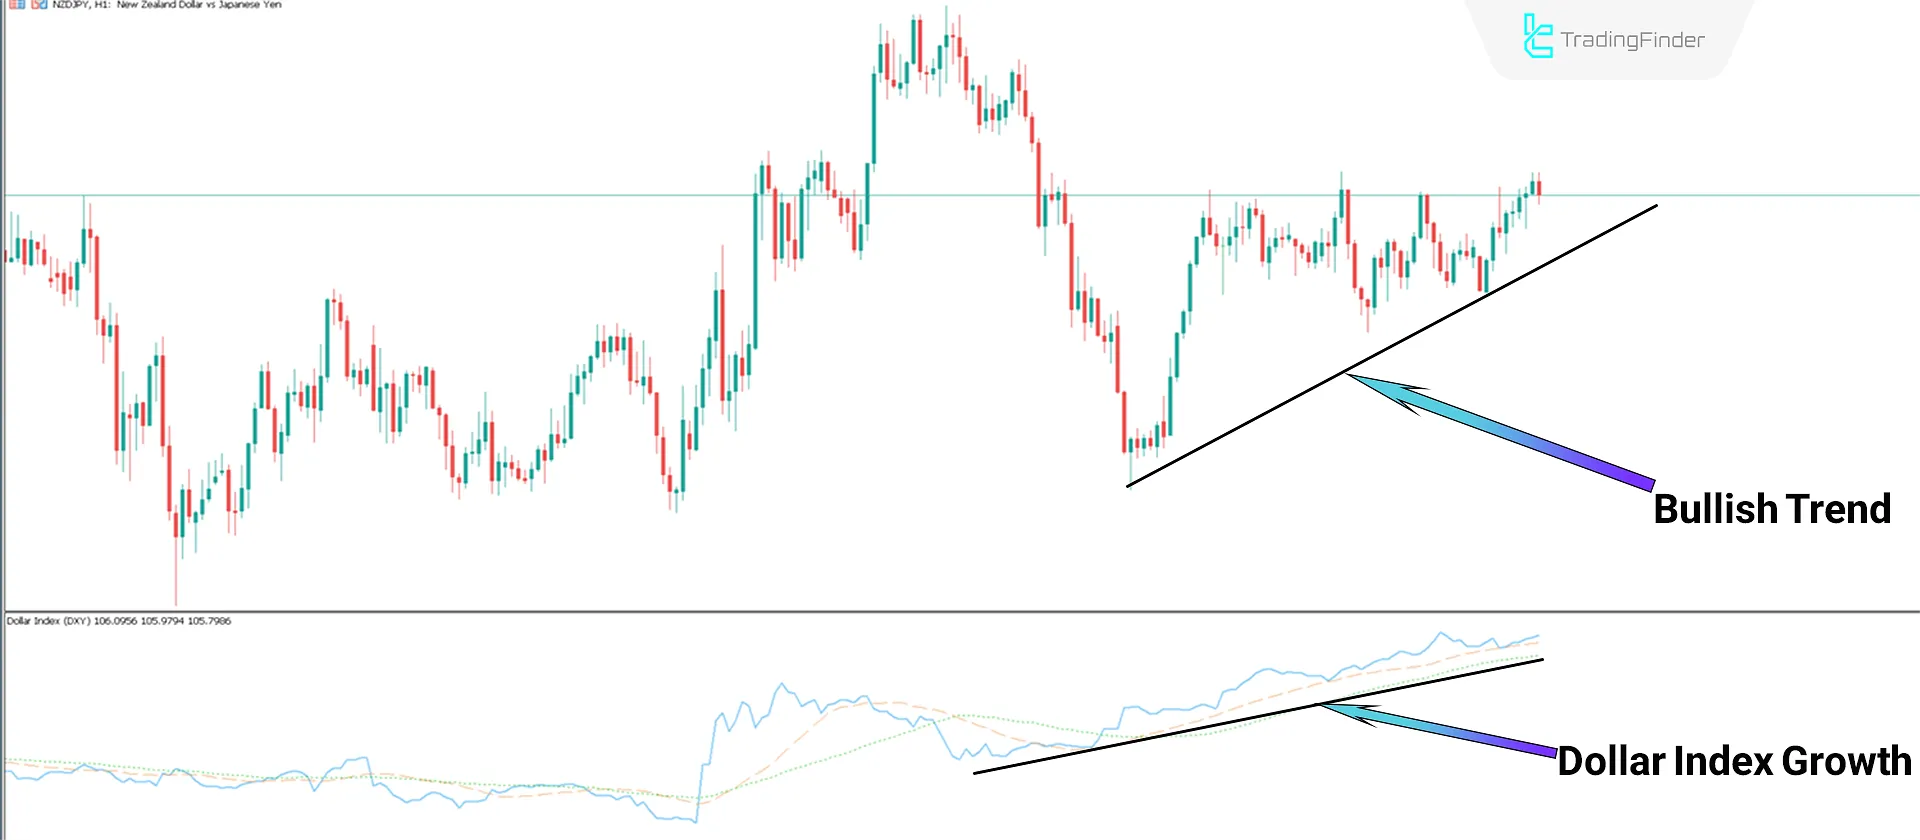
The 1-hour timeframe price chart of the NZD/JPY currency pair shows how the U.S. Dollar Index affects other currencies. As illustrated below, due to its convergence with the U.S. Dollar, the New Zealand Dollar strengthened following an increase in the DXY index. Consequently, the trend in the NZD/JPY chart is bullish.

Bearish Trend Analysis
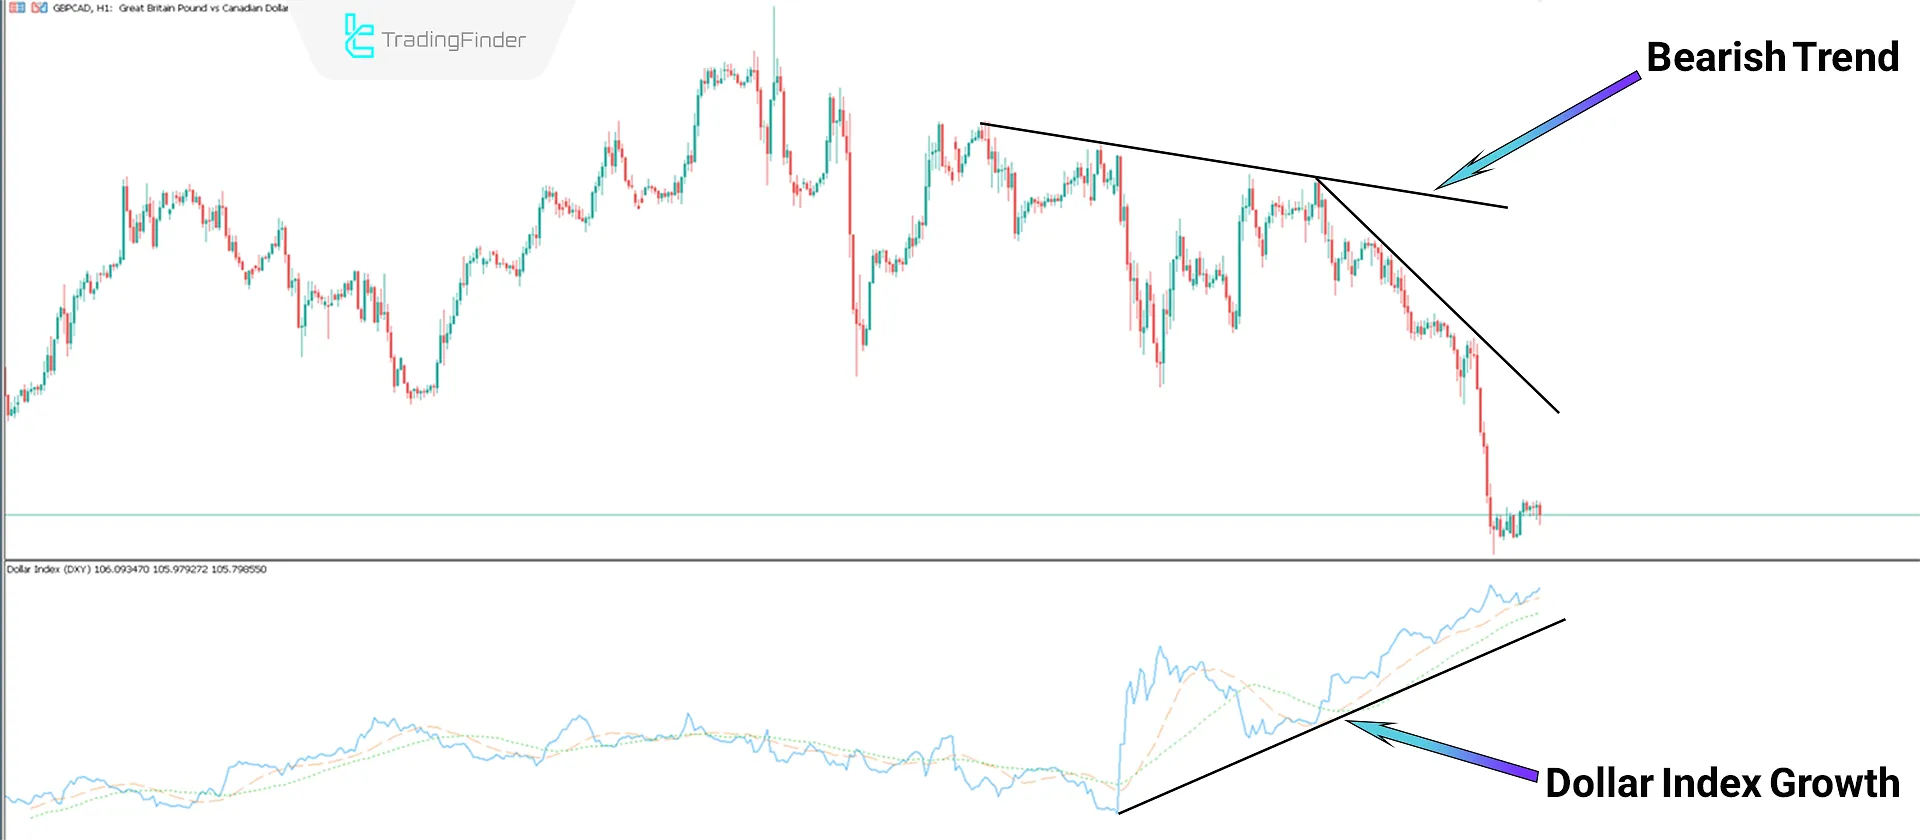
The 1-hour timeframe price chart of the GBP/CAD currency pair shows how the U.S. Dollar Index affects other currencies. As illustrated below, due to its divergence from the U.S. Dollar, the British Pound (GBP) weakens following an increase in the DXY index. Consequently, the trend in the GBP/CAD chart is bearish.

Indicator Settings

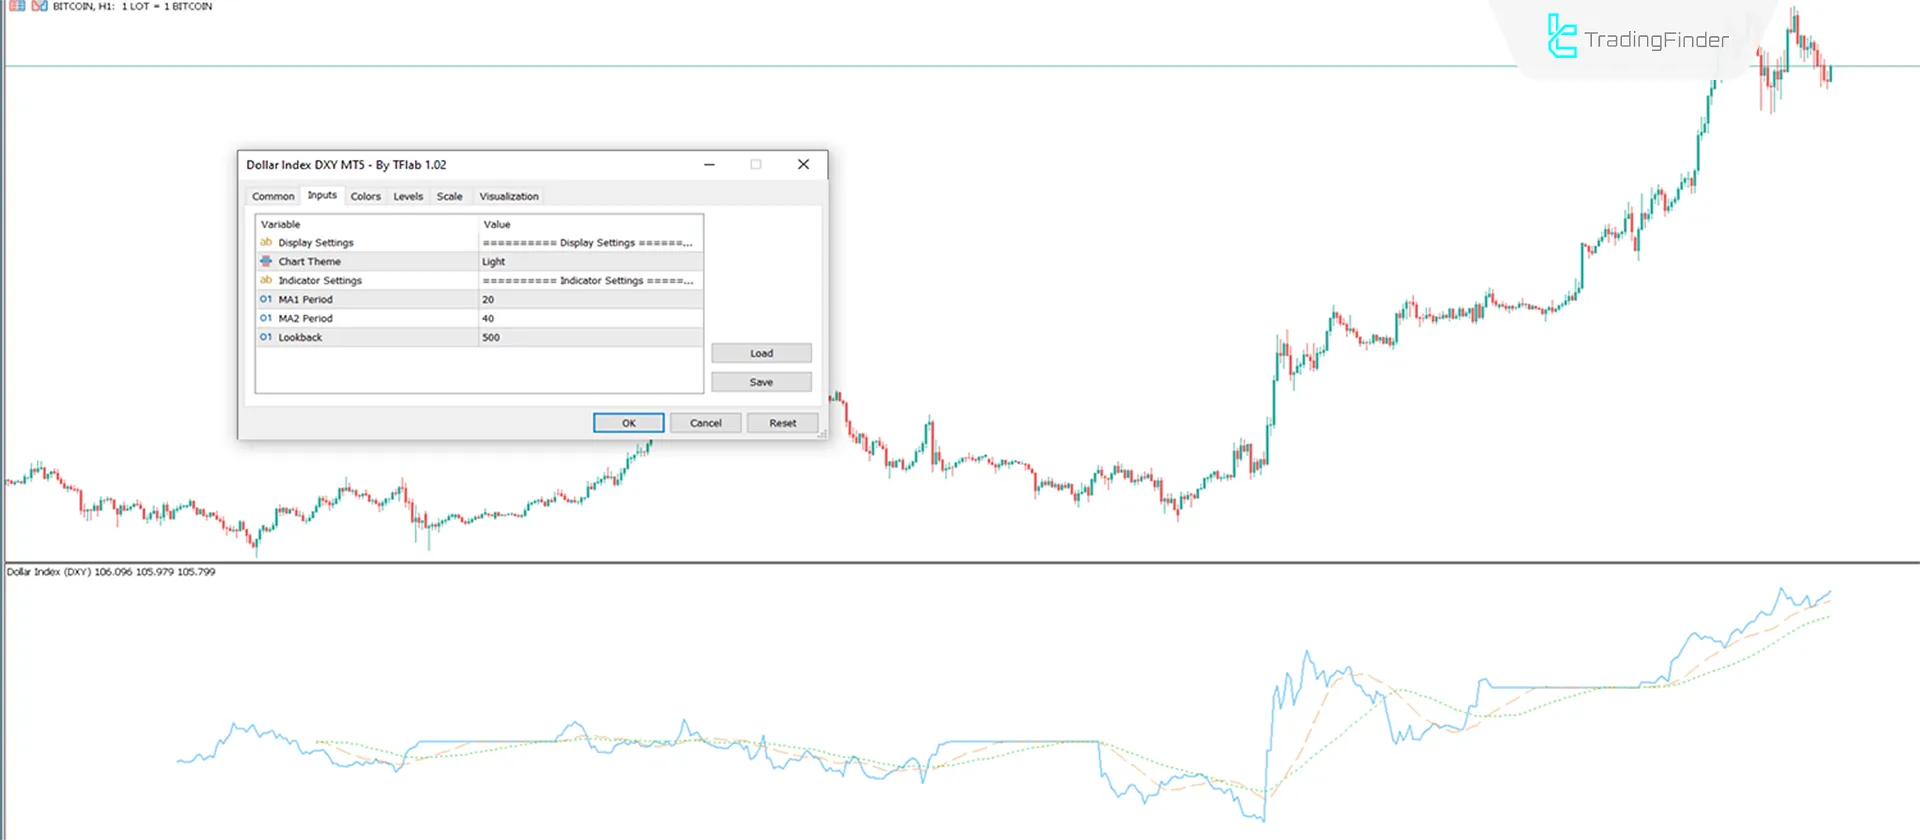
- Chart theme: Indicator theme;
- MA1 period: First moving average period set to 20;
- MA2 period: Second moving average period set to 40;
- Lookback: Data calculation based on candles according to the number 500.
Conclusion
By tracking changes in this index and combining it with other technical and fundamental analyses, traders can gain a precise outlook on the overall trend in financial markets. This MT5 oscillator allows traders to accurately assess the relative value of the dollar. It can be used in all timeframes and across all financial markets.
Dollar Index DXY indicator MT5 PDF
Dollar Index DXY indicator MT5 PDF
Click to download Dollar Index DXY indicator MT5 PDFIs the "DXY" indicator useful for analyzing non-currency markets as well?
This indicator can also be useful for analyzing commodity markets, such as gold, silver, and oil.
Why is the "DXY" Dollar Index particularly important in global markets?
Because the U.S. dollar is one of the world’s primary reserve currencies, many transactions and investments are conducted in dollars.
Thank you for this, just what I was looking for. Simple and works well.


