


![Donchain Channel Indicator for MetaTrader5 Download - Free [Trading Finder]](https://cdn.tradingfinder.com/image/342759/5en.webp)
![Donchain Channel Indicator for MetaTrader5 Download - Free [Trading Finder] 1](https://cdn.tradingfinder.com/image/342757/10-07-en-donchain-channel-mt5-02.webp)
![Donchain Channel Indicator for MetaTrader5 Download - Free [Trading Finder] 2](https://cdn.tradingfinder.com/image/342758/10-07-en-donchain-channel-mt5-03.webp)
![Donchain Channel Indicator for MetaTrader5 Download - Free [Trading Finder] 3](https://cdn.tradingfinder.com/image/342756/10-07-en-donchain-channel-mt5-04.webp)
On June 23, 2025, in version 2, alert/notification functionality was added to this indicator
The Donchian Channel indicator is one of the MetaTrader 5 indicators that functions as a dynamic channel moving along with the price chart. The bands of this indicator act as support and resistance levels, and a buy or sell signal is issued when the price exits either side of the channel.
The Donchian Channel is drawn based on thehighs and lows over different periods, and when the price breaks the upper band (blue band), it indicates an uptrend, while breaking the lower band (red band) signals a downtrend.
This indicator is most effective in volatile markets and does not provide reliable signals in range-bound markets.
Indicator Table
Indicator Categories: | Signal & Forecast MT5 Indicators Bands & Channels MT5 Indicators Levels MT5 Indicators |
Platforms: | MetaTrader 5 Indicators |
Trading Skills: | Elementary |
Indicator Types: | Leading MT5 Indicators Breakout MT5 Indicators Non-Repaint MT5 Indicators |
Timeframe: | Multi-Timeframe MT5 Indicators |
Trading Style: | Intraday MT5 Indicators Scalper MT5 Indicators Day Trading MT5 Indicators |
Trading Instruments: | Forex MT5 Indicators Crypto MT5 Indicators Stock MT5 Indicators Commodity MT5 Indicators Indices MT5 Indicators Share Stock MT5 Indicators |
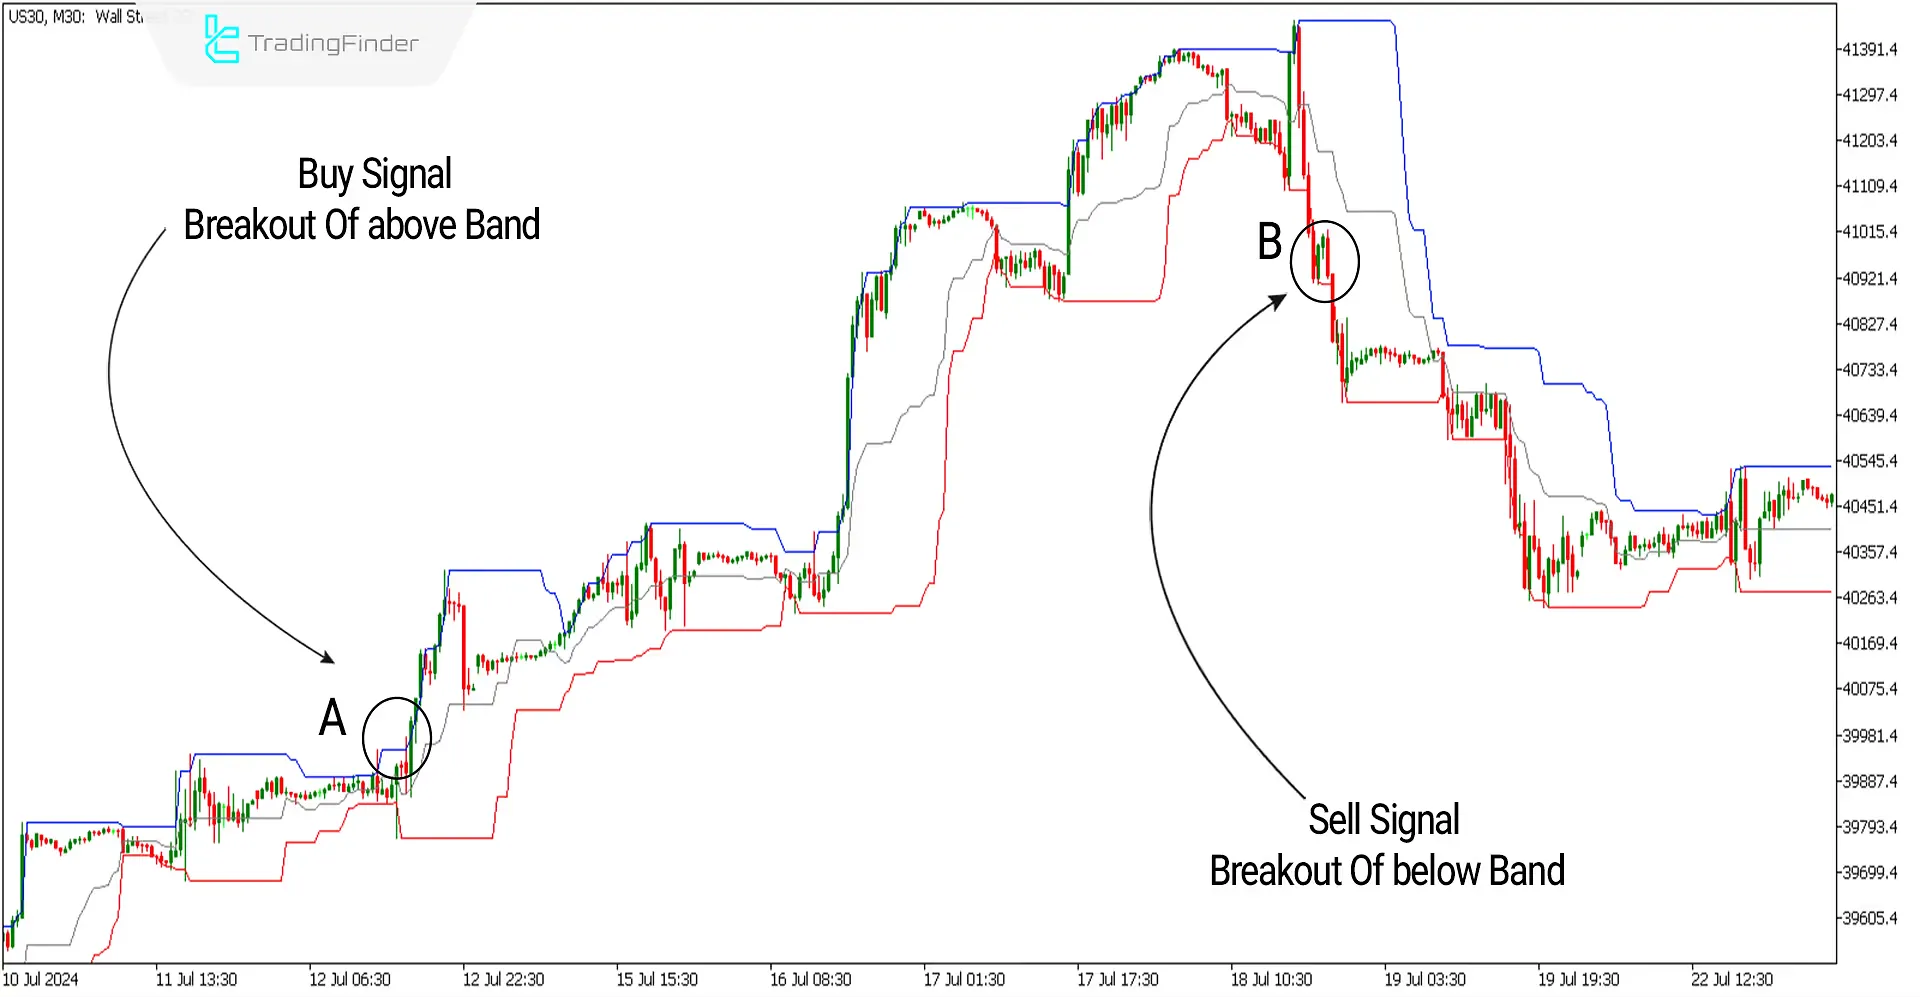
The image below displays theDow Jones Index chart with the symbol [US30] in a 30-minute timeframe. At point A, the start of a strong uptrend is confirmed by breaking the upper band of the channel, making this an excellent opportunity to look for buy positions.
Similarly, at point B, the lower band of the Donchian Channel is broken with solid momentum, signaling a trend reversal from bullish to bearish, which presents an opportunity to enter sell positions.
Overview
The Donchian Channel indicator is a technical analysis tool used to identify strong market movements and trend changes. This channel can trade in the direction of influential market trends. The bands of this indicator are automatically drawn based on the highest (High) and lowest (Low) prices within a specified period.
The upper band represents the highest price, while the lower band represents the lowest price within that period. The middle band is calculated as the average of the high and low prices.
Uptrend Signals (Buy Positions)
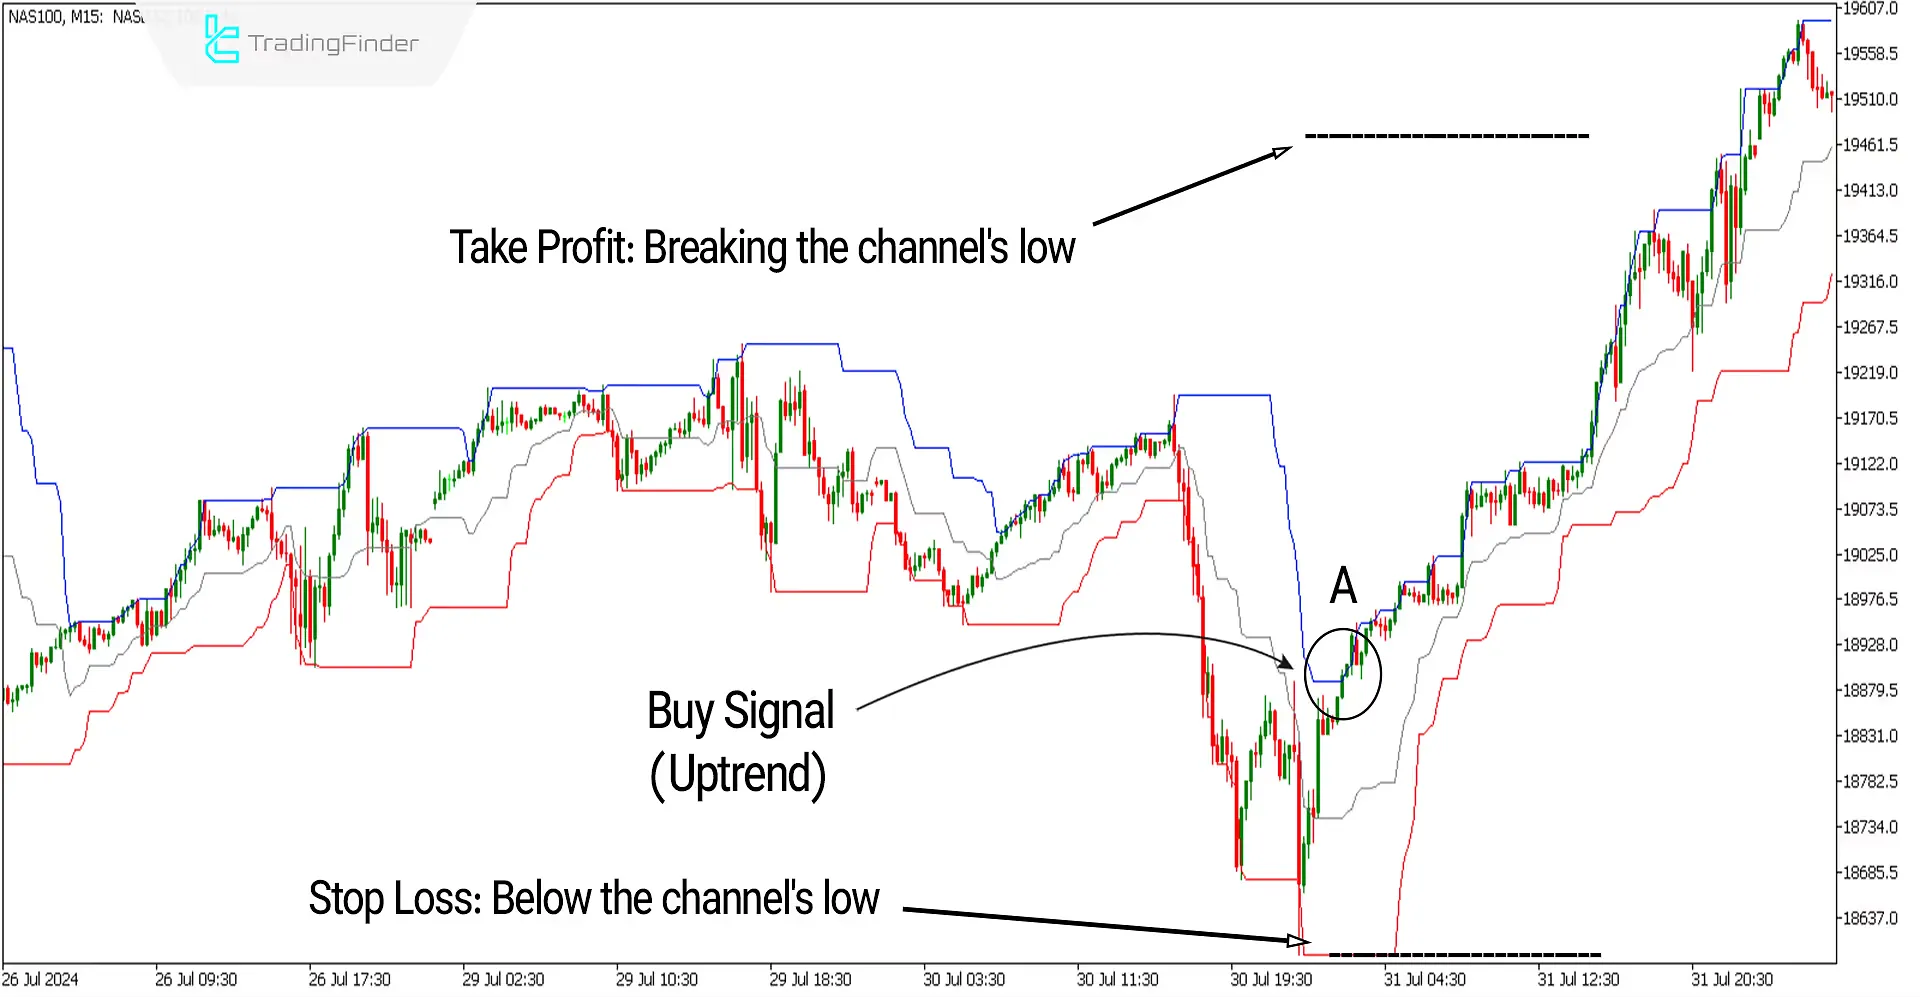
The image below displays the NASDAQ Index chart with the symbol (NAS100) in a 15-minute timeframe. At point A, the price breaks the upper band of the channel with a solid bullish candle. Under these conditions, entering a buy trade would be an opportunity.
Take Profit and Stop Loss for Buy Signals
To set the stop loss (SL) as shown in the image, it can be placed below the lower band of the channel. For setting the take profit (TP), you can consider the price reaching the opposite band (breaking the lower channel) as the criterion.
In the example below, you can use the trailing stop loss (SL Trailing) technique due to the prolonged uptrend to maximize potential profits while protecting your gains.
Downtrend Signals (Sell Positions)
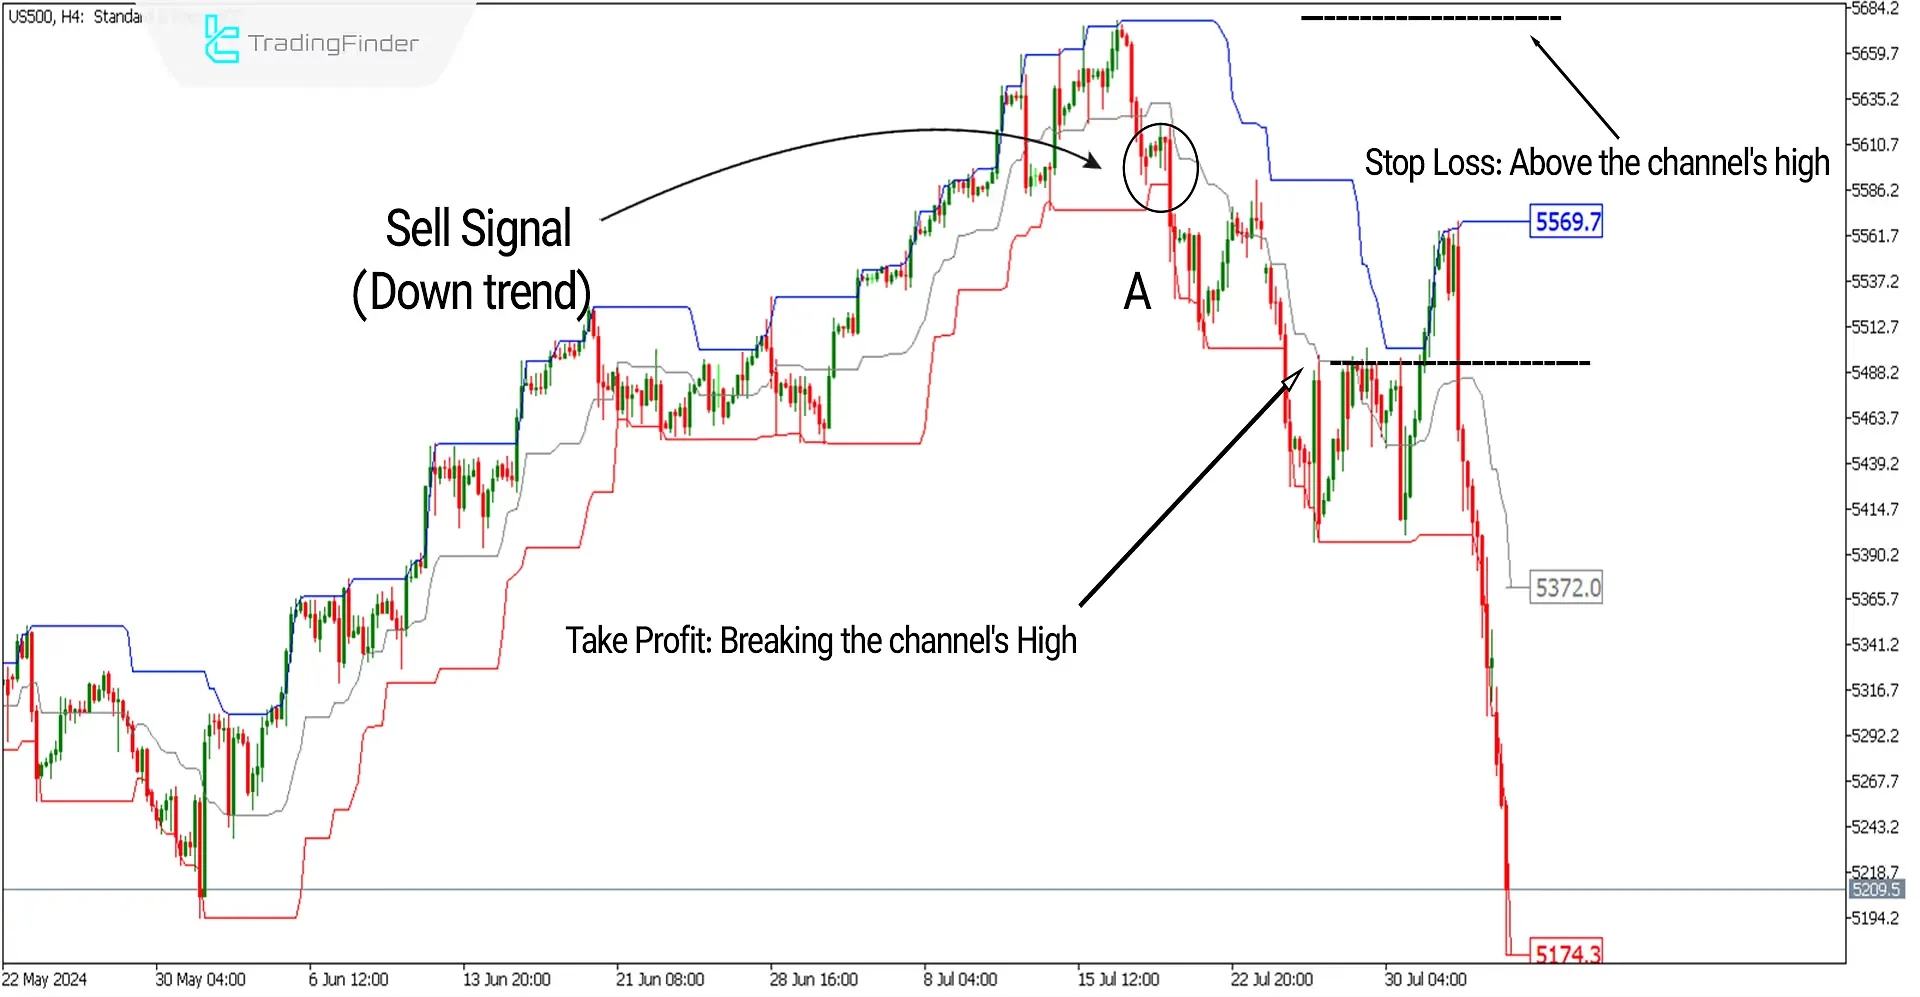
In the image below, the S&P 500 Index chart with the symbol (US500) is displayed in a 4-hour timeframe. At point A, the price breaks the lower band of the channel with a robust and bearish candle. Under these conditions, a sell position opportunity is presented.
Take Profit and Stop Loss for Sell Signals
The take profit for sell trades can be set by considering the price reaching the opposite band (breaking the upper channel). As shown in the signal below, the stop loss can be placed above the upper channel.
This approach helps manage risk and optimize potential returns based on the channel's boundaries.
Settings of the Donchian Channel

- Period of the channel: 20 is used for the channel's timeframe;
- Show price of the level: The option 'true' displays numbers on the chart.
Conclusion
The Donchian Channel indicator is a technical analysis tool used in financial markets to identify the direction of solid trends through a price channel. The MetaTrader 5 Bands and Channels indicator is helpful for both trend-following trades and counter-trend (reversal) trades.
While it can be applied across various timeframes, it is recommended not to use this trading tool in lower timeframes, such as 1-minute and 5-minute charts, due to the influence of multiple factors that can affect prices, including economic news and market emotions.
Using it in higher timeframes helps avoid the noise and false signals that are more prevalent in shorter timeframes.
Donchain Channel MT5 PDF
Donchain Channel MT5 PDF
Click to download Donchain Channel MT5 PDFCan the Donchain Channel indicator be used for all trading instruments?
No. It is better to invest in volatile markets such as Forex and stocks. Its signals should not be relied upon to make decisions in range-bound or trendless markets.
Can the signals from the Donchain Channel indicator be used independently?
Yes, this indicator can provide traders with optimal trade entry and exit points.


